
 Login Sign Up


| |||||
 |  | ||||

| 12Stocks.com Market Intelligence |
Best SmallCap Stocks
|
| In a hurry? Small Cap Stock Lists: Performance Trends Table, Stock Charts
Sort Small Cap stocks: Daily, Weekly, Year-to-Date, Market Cap & Trends. Filter Small Cap stocks list by sector: Show all, Tech, Finance, Energy, Staples, Retail, Industrial, Materials, Utilities and HealthCare Filter Small Cap stocks list by size: All Large Medium Small and MicroCap |
| 12Stocks.com Small Cap Stocks Performances & Trends Daily | |||||||||
|
|  The overall Smart Investing & Trading Score is 87 (0-bearish to 100-bullish) which puts Small Cap index in short term bullish trend. The Smart Investing & Trading Score from previous trading session is 82 and hence an improvement of trend.
| ||||||||
Here are the Smart Investing & Trading Scores of the most requested small cap stocks at 12Stocks.com (click stock name for detailed review):
|


| 12Stocks.com: Investing in Smallcap Index with Stocks | |
|
The following table helps investors and traders sort through current performance and trends (as measured by Smart Investing & Trading Score) of various
stocks in the Smallcap Index. Quick View: Move mouse or cursor over stock symbol (ticker) to view short-term technical chart and over stock name to view long term chart. Click on  to add stock symbol to your watchlist and to add stock symbol to your watchlist and  to view watchlist. Click on any ticker or stock name for detailed market intelligence report for that stock. to view watchlist. Click on any ticker or stock name for detailed market intelligence report for that stock. |
12Stocks.com Performance of Stocks in Smallcap Index
| Ticker | Stock Name | Watchlist | Category | Recent Price | Smart Investing & Trading Score | Change % | YTD Change% |
| TUSK | Mammoth Energy |   | Energy | 2.96 | 0 | -3.58 | -33.63% |
| PFIS | Peoples Financial | | Financials | 37.90 | 25 | -3.59 | -22.18% |
| IHRT | iHeartMedia | | Services & Goods | 2.27 | 64 | -3.60 | -14.79% |
| BRY | Berry | | Energy | 7.68 | 26 | -3.64 | 9.25% |
| DCGO | DocGo | | Health Care | 3.56 | 38 | -3.65 | -36.31% |
| GPRO | GoPro | | Consumer Staples | 1.84 | 42 | -3.66 | -46.97% |
| OLO | Olo | | Technology | 4.69 | 31 | -3.70 | -18.01% |
| OOMA | Ooma | | Technology | 6.88 | 10 | -3.78 | -35.88% |
| INNV | InnovAge Holding | | Health Care | 4.26 | 67 | -3.84 | -25.26% |
| CUTR | Cutera | | Health Care | 2.75 | 90 | -3.85 | -21.99% |
| PKST | Peakstone Realty | | Financials | 13.75 | 55 | -3.85 | -32.99% |
| OBIO | Orchestra BioMed | | Health Care | 4.98 | 47 | -3.86 | -45.33% |
| HPP | Hudson Pacific | | Financials | 5.22 | 10 | -3.87 | -43.93% |
| VERV | Verve | | Health Care | 6.16 | 30 | -3.98 | -55.86% |
| BXC | BlueLinx | | Services & Goods | 99.88 | 0 | -4.00 | -11.85% |
| DC | Dakota Gold | | Materials | 2.64 | 90 | -4.00 | 1.54% |
| BLMN | Bloomin | | Services & Goods | 23.96 | 0 | -4.01 | -14.88% |
| LNZA | LanzaTech Global | | Industrials | 2.73 | 52 | -4.04 | -44.69% |
| ATRI | Atrion | | Health Care | 417.20 | 73 | -4.09 | 10.14% |
| TMDX | TransMedics Group | | Health Care | 127.22 | 90 | -4.10 | 61.19% |
| MKTW | MarketWise | | Technology | 1.63 | 37 | -4.12 | -39.63% |
| WOW | WideOpenWest | | Technology | 4.64 | 88 | -4.13 | 14.57% |
| NRGV | Energy Vault | | Utilities | 1.39 | 67 | -4.14 | -40.34% |
| CLPR | Clipper Realty | | Financials | 3.93 | 0 | -4.15 | -27.22% |
| ALGT | Allegiant Travel | | Transports | 53.89 | 10 | -4.21 | -34.77% |


| Too many stocks? View smallcap stocks filtered by marketcap & sector |
| Marketcap: All SmallCap Stocks (default-no microcap), Large, Mid-Range, Small |
| Smallcap Sector: Tech, Finance, Energy, Staples, Retail, Industrial, Materials, & Medical |
|
Get the most comprehensive stock market coverage daily at 12Stocks.com ➞ Best Stocks Today ➞ Best Stocks Weekly ➞ Best Stocks Year-to-Date ➞ Best Stocks Trends ➞  Best Stocks Today 12Stocks.com Best Nasdaq Stocks ➞ Best S&P 500 Stocks ➞ Best Tech Stocks ➞ Best Biotech Stocks ➞ |
| Detailed Overview of SmallCap Stocks |
| SmallCap Technical Overview, Leaders & Laggards, Top SmallCap ETF Funds & Detailed SmallCap Stocks List, Charts, Trends & More |
| Smallcap: Technical Analysis, Trends & YTD Performance | |
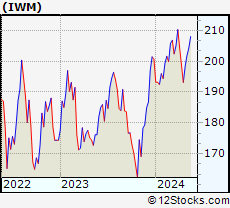
| SmallCap segment as represented by
IWM, an exchange-traded fund [ETF], holds basket of thousands of smallcap stocks from across all major sectors of the US stock market. The smallcap index (contains stocks like Riverbed & Sotheby's) is up by 2.12% and is currently underperforming the overall market by -6% year-to-date. Below is a quick view of technical charts and trends: | |
 IWM Weekly Chart |
|
| Long Term Trend: Very Good | |
| Medium Term Trend: Very Good | |
 IWM Daily Chart |
|
| Short Term Trend: Very Good | |
| Overall Trend Score: 87 | |
| YTD Performance: 2.12% | |
| **Trend Scores & Views Are Only For Educational Purposes And Not For Investing | |
| 12Stocks.com: Top Performing Small Cap Index Stocks | ||||||||||||||||||||||||||||||||||||||||||||||||
 The top performing Small Cap Index stocks year to date are
Now, more recently, over last week, the top performing Small Cap Index stocks on the move are


|
||||||||||||||||||||||||||||||||||||||||||||||||
| 12Stocks.com: Investing in Smallcap Index using Exchange Traded Funds | |
|
The following table shows list of key exchange traded funds (ETF) that
help investors track Smallcap index. The following list also includes leveraged ETF funds that track twice or thrice the daily returns of Smallcap indices. Short or inverse ETF funds move in the opposite direction to the index they track and are useful during market pullbacks or during bear markets. Quick View: Move mouse or cursor over ETF symbol (ticker) to view short-term technical chart and over ETF name to view long term chart. Click on ticker or stock name for detailed view. Click on to add stock symbol to your watchlist and to view watchlist. |
12Stocks.com List of ETFs that track Smallcap Index
| Ticker | ETF Name | Watchlist | Recent Price | Smart Investing & Trading Score | Change % | Week % | Year-to-date % |
| IWM | iShares Russell 2000 | | 204.97 | 87 | 0.22 | 1.52 | 2.12% |
| IJR | iShares Core S&P Small-Cap | | 108.62 | 100 | 0.33 | 1.39 | 0.34% |
| VTWO | Vanguard Russell 2000 ETF | | 82.84 | 82 | 0.22 | 1.51 | 2.15% |
| IWN | iShares Russell 2000 Value | | 155.63 | 100 | -0.01 | 0.92 | 0.19% |
| IWO | iShares Russell 2000 Growth | | 262.30 | 82 | 0.49 | 2.11 | 4% |
| IJS | iShares S&P Small-Cap 600 Value | | 99.68 | 69 | -0.07 | 0.97 | -3.29% |
| IJT | iShares S&P Small-Cap 600 Growth | | 129.84 | 95 | 0.56 | 1.63 | 3.76% |
| XSLV | PowerShares S&P SmallCap Low Volatil ETF | | 44.00 | 100 | 0.96 | 1.8 | -0.34% |
| SAA | ProShares Ultra SmallCap600 | | 24.39 | 95 | 1.16 | 3.39 | -2.24% |
| SMLV | SPDR SSGA US Small Cap Low Volatil ETF | | 110.48 | 100 | -0.10 | 0.72 | -1.81% |
| SBB | ProShares Short SmallCap600 | | 15.97 | 0 | -0.50 | -1.18 | 0.25% |
| SDD | ProShares UltraShort SmallCap600 | | 18.22 | 10 | -1.10 | -3.33 | -1.13% |
| 12Stocks.com: Charts, Trends, Fundamental Data and Performances of SmallCap Stocks | |
|
We now take in-depth look at all SmallCap stocks including charts, multi-period performances and overall trends (as measured by Smart Investing & Trading Score). One can sort SmallCap stocks (click link to choose) by Daily, Weekly and by Year-to-Date performances. Also, one can sort by size of the company or by market capitalization. |
| Select Your Default Chart Type: | |||||
| |||||
| Click on stock symbol or name for detailed view. Click on to add stock symbol to your watchlist and to view watchlist. Quick View: Move mouse or cursor over "Daily" to quickly view daily technical stock chart and over "Weekly" to view weekly technical stock chart. | |||||

 | TUSK Mammoth Energy Services, Inc. |
| Sector: Energy | |
| SubSector: Oil & Gas Drilling & Exploration | |
| MarketCap: 59.5139 Millions | |
| Recent Price: 2.96 Smart Investing & Trading Score: 0 | |
| Day Percent Change: -3.58% Day Change: -0.11 | |
| Week Change: -3.9% Year-to-date Change: -33.6% | |
| TUSK Links: Profile News Message Board | |
| Charts:- Daily , Weekly | |
| Add TUSK to Watchlist: View: Get Complete TUSK Trend Analysis ➞ | |
 | PFIS Peoples Financial Services Corp. |
| Sector: Financials | |
| SubSector: Regional - Northeast Banks | |
| MarketCap: 305.499 Millions | |
| Recent Price: 37.90 Smart Investing & Trading Score: 25 | |
| Day Percent Change: -3.59% Day Change: -1.41 | |
| Week Change: -4.29% Year-to-date Change: -22.2% | |
| PFIS Links: Profile News Message Board | |
| Charts:- Daily , Weekly | |
| Add PFIS to Watchlist: View: Get Complete PFIS Trend Analysis ➞ | |
 | IHRT iHeartMedia, Inc. |
| Sector: Services & Goods | |
| SubSector: Broadcasting - Radio | |
| MarketCap: 694 Millions | |
| Recent Price: 2.27 Smart Investing & Trading Score: 64 | |
| Day Percent Change: -3.60% Day Change: -0.08 | |
| Week Change: 1.11% Year-to-date Change: -14.8% | |
| IHRT Links: Profile News Message Board | |
| Charts:- Daily , Weekly | |
| Add IHRT to Watchlist: View: Get Complete IHRT Trend Analysis ➞ | |
 | BRY Berry Corporation |
| Sector: Energy | |
| SubSector: Independent Oil & Gas | |
| MarketCap: 254.793 Millions | |
| Recent Price: 7.68 Smart Investing & Trading Score: 26 | |
| Day Percent Change: -3.64% Day Change: -0.29 | |
| Week Change: -4% Year-to-date Change: 9.3% | |
| BRY Links: Profile News Message Board | |
| Charts:- Daily , Weekly | |
| Add BRY to Watchlist: View: Get Complete BRY Trend Analysis ➞ | |
 | DCGO DocGo Inc. |
| Sector: Health Care | |
| SubSector: Medical Care Facilities | |
| MarketCap: 972 Millions | |
| Recent Price: 3.56 Smart Investing & Trading Score: 38 | |
| Day Percent Change: -3.65% Day Change: -0.13 | |
| Week Change: -1.39% Year-to-date Change: -36.3% | |
| DCGO Links: Profile News Message Board | |
| Charts:- Daily , Weekly | |
| Add DCGO to Watchlist: View: Get Complete DCGO Trend Analysis ➞ | |
 | GPRO GoPro, Inc. |
| Sector: Consumer Staples | |
| SubSector: Photographic Equipment & Supplies | |
| MarketCap: 475.925 Millions | |
| Recent Price: 1.84 Smart Investing & Trading Score: 42 | |
| Day Percent Change: -3.66% Day Change: -0.07 | |
| Week Change: -4.17% Year-to-date Change: -47.0% | |
| GPRO Links: Profile News Message Board | |
| Charts:- Daily , Weekly | |
| Add GPRO to Watchlist: View: Get Complete GPRO Trend Analysis ➞ | |
 | OLO Olo Inc. |
| Sector: Technology | |
| SubSector: Software - Application | |
| MarketCap: 1030 Millions | |
| Recent Price: 4.69 Smart Investing & Trading Score: 31 | |
| Day Percent Change: -3.70% Day Change: -0.18 | |
| Week Change: -2.09% Year-to-date Change: -18.0% | |
| OLO Links: Profile News Message Board | |
| Charts:- Daily , Weekly | |
| Add OLO to Watchlist: View: Get Complete OLO Trend Analysis ➞ | |
 | OOMA Ooma, Inc. |
| Sector: Technology | |
| SubSector: Diversified Communication Services | |
| MarketCap: 222.064 Millions | |
| Recent Price: 6.88 Smart Investing & Trading Score: 10 | |
| Day Percent Change: -3.78% Day Change: -0.27 | |
| Week Change: -4.84% Year-to-date Change: -35.9% | |
| OOMA Links: Profile News Message Board | |
| Charts:- Daily , Weekly | |
| Add OOMA to Watchlist: View: Get Complete OOMA Trend Analysis ➞ | |
 | INNV InnovAge Holding Corp. |
| Sector: Health Care | |
| SubSector: Medical Care Facilities | |
| MarketCap: 1010 Millions | |
| Recent Price: 4.26 Smart Investing & Trading Score: 67 | |
| Day Percent Change: -3.84% Day Change: -0.17 | |
| Week Change: 5.19% Year-to-date Change: -25.3% | |
| INNV Links: Profile News Message Board | |
| Charts:- Daily , Weekly | |
| Add INNV to Watchlist: View: Get Complete INNV Trend Analysis ➞ | |
 | CUTR Cutera, Inc. |
| Sector: Health Care | |
| SubSector: Medical Appliances & Equipment | |
| MarketCap: 143.68 Millions | |
| Recent Price: 2.75 Smart Investing & Trading Score: 90 | |
| Day Percent Change: -3.85% Day Change: -0.11 | |
| Week Change: 8.7% Year-to-date Change: -22.0% | |
| CUTR Links: Profile News Message Board | |
| Charts:- Daily , Weekly | |
| Add CUTR to Watchlist: View: Get Complete CUTR Trend Analysis ➞ | |
 | PKST Peakstone Realty Trust |
| Sector: Financials | |
| SubSector: REIT - Diversified | |
| MarketCap: 1050 Millions | |
| Recent Price: 13.75 Smart Investing & Trading Score: 55 | |
| Day Percent Change: -3.85% Day Change: -0.55 | |
| Week Change: -2.45% Year-to-date Change: -33.0% | |
| PKST Links: Profile News Message Board | |
| Charts:- Daily , Weekly | |
| Add PKST to Watchlist: View: Get Complete PKST Trend Analysis ➞ | |
 | OBIO Orchestra BioMed Holdings, Inc. |
| Sector: Health Care | |
| SubSector: Biotechnology | |
| MarketCap: 271 Millions | |
| Recent Price: 4.98 Smart Investing & Trading Score: 47 | |
| Day Percent Change: -3.86% Day Change: -0.20 | |
| Week Change: 0.61% Year-to-date Change: -45.3% | |
| OBIO Links: Profile News Message Board | |
| Charts:- Daily , Weekly | |
| Add OBIO to Watchlist: View: Get Complete OBIO Trend Analysis ➞ | |
 | HPP Hudson Pacific Properties, Inc. |
| Sector: Financials | |
| SubSector: REIT - Office | |
| MarketCap: 3267.16 Millions | |
| Recent Price: 5.22 Smart Investing & Trading Score: 10 | |
| Day Percent Change: -3.87% Day Change: -0.21 | |
| Week Change: -5.26% Year-to-date Change: -43.9% | |
| HPP Links: Profile News Message Board | |
| Charts:- Daily , Weekly | |
| Add HPP to Watchlist: View: Get Complete HPP Trend Analysis ➞ | |
 | VERV Verve Therapeutics, Inc. |
| Sector: Health Care | |
| SubSector: Biotechnology | |
| MarketCap: 1200 Millions | |
| Recent Price: 6.16 Smart Investing & Trading Score: 30 | |
| Day Percent Change: -3.98% Day Change: -0.25 | |
| Week Change: -5.67% Year-to-date Change: -55.9% | |
| VERV Links: Profile News Message Board | |
| Charts:- Daily , Weekly | |
| Add VERV to Watchlist: View: Get Complete VERV Trend Analysis ➞ | |
 | BXC BlueLinx Holdings Inc. |
| Sector: Services & Goods | |
| SubSector: Building Materials Wholesale | |
| MarketCap: 60.7243 Millions | |
| Recent Price: 99.88 Smart Investing & Trading Score: 0 | |
| Day Percent Change: -4.00% Day Change: -4.16 | |
| Week Change: -2.59% Year-to-date Change: -11.9% | |
| BXC Links: Profile News Message Board | |
| Charts:- Daily , Weekly | |
| Add BXC to Watchlist: View: Get Complete BXC Trend Analysis ➞ | |
 | DC Dakota Gold Corp. |
| Sector: Materials | |
| SubSector: Gold | |
| MarketCap: 218 Millions | |
| Recent Price: 2.64 Smart Investing & Trading Score: 90 | |
| Day Percent Change: -4.00% Day Change: -0.11 | |
| Week Change: 9.09% Year-to-date Change: 1.5% | |
| DC Links: Profile News Message Board | |
| Charts:- Daily , Weekly | |
| Add DC to Watchlist: View: Get Complete DC Trend Analysis ➞ | |
 | BLMN Bloomin Brands, Inc. |
| Sector: Services & Goods | |
| SubSector: Restaurants | |
| MarketCap: 503.47 Millions | |
| Recent Price: 23.96 Smart Investing & Trading Score: 0 | |
| Day Percent Change: -4.01% Day Change: -1.00 | |
| Week Change: -6.44% Year-to-date Change: -14.9% | |
| BLMN Links: Profile News Message Board | |
| Charts:- Daily , Weekly | |
| Add BLMN to Watchlist: View: Get Complete BLMN Trend Analysis ➞ | |
 | LNZA LanzaTech Global, Inc. |
| Sector: Industrials | |
| SubSector: Waste Management | |
| MarketCap: 1340 Millions | |
| Recent Price: 2.73 Smart Investing & Trading Score: 52 | |
| Day Percent Change: -4.04% Day Change: -0.12 | |
| Week Change: 2.63% Year-to-date Change: -44.7% | |
| LNZA Links: Profile News Message Board | |
| Charts:- Daily , Weekly | |
| Add LNZA to Watchlist: View: Get Complete LNZA Trend Analysis ➞ | |
 | ATRI Atrion Corporation |
| Sector: Health Care | |
| SubSector: Medical Instruments & Supplies | |
| MarketCap: 1234.6 Millions | |
| Recent Price: 417.20 Smart Investing & Trading Score: 73 | |
| Day Percent Change: -4.09% Day Change: -17.80 | |
| Week Change: 0.54% Year-to-date Change: 10.1% | |
| ATRI Links: Profile News Message Board | |
| Charts:- Daily , Weekly | |
| Add ATRI to Watchlist: View: Get Complete ATRI Trend Analysis ➞ | |
 | TMDX TransMedics Group, Inc. |
| Sector: Health Care | |
| SubSector: Medical Appliances & Equipment | |
| MarketCap: 331.68 Millions | |
| Recent Price: 127.22 Smart Investing & Trading Score: 90 | |
| Day Percent Change: -4.10% Day Change: -5.44 | |
| Week Change: -0.6% Year-to-date Change: 61.2% | |
| TMDX Links: Profile News Message Board | |
| Charts:- Daily , Weekly | |
| Add TMDX to Watchlist: View: Get Complete TMDX Trend Analysis ➞ | |
 | MKTW MarketWise, Inc. |
| Sector: Technology | |
| SubSector: Software - Application | |
| MarketCap: 646 Millions | |
| Recent Price: 1.63 Smart Investing & Trading Score: 37 | |
| Day Percent Change: -4.12% Day Change: -0.07 | |
| Week Change: 0.93% Year-to-date Change: -39.6% | |
| MKTW Links: Profile News Message Board | |
| Charts:- Daily , Weekly | |
| Add MKTW to Watchlist: View: Get Complete MKTW Trend Analysis ➞ | |
 | WOW WideOpenWest, Inc. |
| Sector: Technology | |
| SubSector: CATV Systems | |
| MarketCap: 328.932 Millions | |
| Recent Price: 4.64 Smart Investing & Trading Score: 88 | |
| Day Percent Change: -4.13% Day Change: -0.20 | |
| Week Change: -4.53% Year-to-date Change: 14.6% | |
| WOW Links: Profile News Message Board | |
| Charts:- Daily , Weekly | |
| Add WOW to Watchlist: View: Get Complete WOW Trend Analysis ➞ | |
 | NRGV Energy Vault Holdings, Inc. |
| Sector: Utilities | |
| SubSector: Utilities - Renewable | |
| MarketCap: 364 Millions | |
| Recent Price: 1.39 Smart Investing & Trading Score: 67 | |
| Day Percent Change: -4.14% Day Change: -0.06 | |
| Week Change: 10.76% Year-to-date Change: -40.3% | |
| NRGV Links: Profile News Message Board | |
| Charts:- Daily , Weekly | |
| Add NRGV to Watchlist: View: Get Complete NRGV Trend Analysis ➞ | |
 | CLPR Clipper Realty Inc. |
| Sector: Financials | |
| SubSector: REIT - Diversified | |
| MarketCap: 113.253 Millions | |
| Recent Price: 3.93 Smart Investing & Trading Score: 0 | |
| Day Percent Change: -4.15% Day Change: -0.17 | |
| Week Change: -4.84% Year-to-date Change: -27.2% | |
| CLPR Links: Profile News Message Board | |
| Charts:- Daily , Weekly | |
| Add CLPR to Watchlist: View: Get Complete CLPR Trend Analysis ➞ | |
 | ALGT Allegiant Travel Company |
| Sector: Transports | |
| SubSector: Regional Airlines | |
| MarketCap: 1317.7 Millions | |
| Recent Price: 53.89 Smart Investing & Trading Score: 10 | |
| Day Percent Change: -4.21% Day Change: -2.37 | |
| Week Change: -3.13% Year-to-date Change: -34.8% | |
| ALGT Links: Profile News Message Board | |
| Charts:- Daily , Weekly | |
| Add ALGT to Watchlist: View: Get Complete ALGT Trend Analysis ➞ | |
| Too many stocks? View smallcap stocks filtered by marketcap & sector |
| Marketcap: All SmallCap Stocks (default-no microcap), Large, Mid-Range, Small & MicroCap |
| Sector: Tech, Finance, Energy, Staples, Retail, Industrial, Materials, Utilities & Medical |
|
Best Stocks Today 12Stocks.com |
© 2024 12Stocks.com Terms & Conditions Privacy Contact Us
All Information Provided Only For Education And Not To Be Used For Investing or Trading. See Terms & Conditions


One More Thing ... Get Best Stocks Delivered Daily!
Never Ever Miss A Move With Our Top Ten Stocks Lists
Find Best Stocks In Any Market - Bull or Bear Market
Take A Peek At Our Top Ten Stocks Lists: Daily, Weekly, Year-to-Date & Top Trends
Find Best Stocks In Any Market - Bull or Bear Market
Take A Peek At Our Top Ten Stocks Lists: Daily, Weekly, Year-to-Date & Top Trends
Smallcap Stocks With Best Up Trends [0-bearish to 100-bullish]: Design [100], Ambac Financial[100], Summit [100], EverQuote [100], Zeta Global[100], Coca-Cola Consolidated[100], J & J Snack Foods[100], Sterling Construction[100], Vanda [100], CPI Card[100], Semrush [100]
Best Smallcap Stocks Year-to-Date:
CareMax [570.1%], Janux [472.36%], Viking [327.78%], Longboard [260.8%], Alpine Immune[239.34%], Bakkt [226.91%], Vera [190.7%], Super Micro[188.22%], Cullinan Oncology[187.89%], Avidity Biosciences[180.86%], Y-mAbs [152.49%] Best Smallcap Stocks This Week:
Perficient [52.32%], Thoughtworks Holding[34.22%], Trupanion [28.72%], DASAN Zhone[26.29%], Great Lakes[25.72%], Workhorse Group[24.5%], Design [23.42%], Ambac Financial[22.97%], P3 Health[22.36%], Outset Medical[21.09%], Summit [20.96%] Best Smallcap Stocks Daily:
Design [28.85%], Great Lakes[24.29%], Thoughtworks Holding[19.84%], Ambac Financial[19.31%], Summit [18.79%], EverQuote [18.40%], Origin Materials[18.38%], Zeta Global[18.35%], FibroGen [18.10%], Coca-Cola Consolidated[17.65%], Children s[16.44%]