
 Login Sign Up


| |||||
 |  | ||||

| 12Stocks.com Market Intelligence |
Best MidCap Stocks
|
| In a hurry? Mid Cap Stocks Lists: Performance Trends Table, Stock Charts
Sort midcap stocks: Daily, Weekly, Year-to-Date, Market Cap & Trends. Filter midcap stocks list by sector: Show all, Tech, Finance, Energy, Staples, Retail, Industrial, Materials, Utilities and HealthCare Filter midcap stocks list by size:All MidCap Large Mid-Range Small |
| 12Stocks.com Mid Cap Stocks Performances & Trends Daily | |||||||||
|
|  The overall Smart Investing & Trading Score is 38 (0-bearish to 100-bullish) which puts Mid Cap index in short term bearish to neutral trend. The Smart Investing & Trading Score from previous trading session is 70 and hence a deterioration of trend.
| ||||||||
Here are the Smart Investing & Trading Scores of the most requested mid cap stocks at 12Stocks.com (click stock name for detailed review):
|


| 12Stocks.com: Top Performing Mid Cap Index Stocks | ||||||||||||||||||||||||||||||||||||||||||||||||
 The top performing Mid Cap Index stocks year to date are
Now, more recently, over last week, the top performing Mid Cap Index stocks on the move are


|
||||||||||||||||||||||||||||||||||||||||||||||||
| 12Stocks.com: Investing in Midcap Index with Stocks | |
|
The following table helps investors and traders sort through current performance and trends (as measured by Smart Investing & Trading Score) of various
stocks in the Midcap Index. Quick View: Move mouse or cursor over stock symbol (ticker) to view short-term technical chart and over stock name to view long term chart. Click on  to add stock symbol to your watchlist and to add stock symbol to your watchlist and  to view watchlist. Click on any ticker or stock name for detailed market intelligence report for that stock. to view watchlist. Click on any ticker or stock name for detailed market intelligence report for that stock. |
12Stocks.com Performance of Stocks in Midcap Index
| Ticker | Stock Name | Watchlist | Category | Recent Price | Smart Investing & Trading Score | Change % | YTD Change% |
| RL | Ralph Lauren |   | Consumer Staples | 163.64 | 48 | -2.03 | 13.48% |
| CCL | Carnival | | Services & Goods | 14.82 | 32 | -2.05 | -20.06% |
| TOL | Toll Brothers | | Industrials | 119.11 | 63 | -2.06 | 15.88% |
| JKHY | Jack Henry | | Technology | 162.69 | 5 | -2.06 | -0.44% |
| ICLR | ICON Public | | Health Care | 297.88 | 41 | -2.06 | 5.23% |
| ALLY | Ally Financial | | Financials | 38.35 | 51 | -2.07 | 9.82% |
| ROIV | Roivant Sciences | | Health Care | 10.90 | 41 | -2.07 | -1.85% |
| KSS | Kohl s | | Services & Goods | 23.94 | 32 | -2.09 | -16.53% |
| JBL | Jabil | | Technology | 117.36 | 17 | -2.09 | -7.88% |
| TXT | Textron | | Industrials | 84.59 | 21 | -2.09 | 5.19% |
| FNF | Fidelity National | | Financials | 49.50 | 22 | -2.10 | -2.98% |
| GDDY | GoDaddy | | Technology | 122.38 | 38 | -2.10 | 15.28% |
| WHR | Whirlpool | | Consumer Staples | 94.86 | 18 | -2.11 | -22.10% |
| SON | Sonoco Products | | Consumer Staples | 56.05 | 32 | -2.11 | 0.32% |
| VMI | Valmont Industries | | Industrials | 204.80 | 10 | -2.12 | -12.29% |
| VNT | Vontier | | Technology | 40.63 | 51 | -2.14 | 17.60% |
| DLB | Dolby | | Technology | 77.66 | 0 | -2.15 | -9.89% |
| GWRE | Guidewire Software | | Technology | 110.40 | 7 | -2.15 | 1.25% |
| JWN | Nordstrom | | Services & Goods | 19.01 | 44 | -2.16 | 3.04% |
| DASH | DoorDash | | Technology | 129.26 | 63 | -2.16 | 30.82% |
| WMB | Williams | | Energy | 38.36 | 51 | -2.17 | 10.13% |
| AVT | Avnet | | Services & Goods | 48.87 | 68 | -2.18 | -3.04% |
| EXPD | Expeditors | | Transports | 111.31 | 0 | -2.18 | -12.49% |
| CCCS | CCC Intelligent | | Technology | 11.21 | 26 | -2.18 | -1.19% |
| FIS | Fidelity National | | Technology | 67.92 | 31 | -2.19 | 13.07% |
| For chart view version of above stock list: Chart View ➞ 0 - 25 , 25 - 50 , 50 - 75 , 75 - 100 , 100 - 125 , 125 - 150 , 150 - 175 , 175 - 200 , 200 - 225 , 225 - 250 , 250 - 275 , 275 - 300 , 300 - 325 , 325 - 350 , 350 - 375 , 375 - 400 , 400 - 425 , 425 - 450 , 450 - 475 , 475 - 500 , 500 - 525 , 525 - 550 , 550 - 575 , 575 - 600 , 600 - 625 , 625 - 650 , 650 - 675 , 675 - 700 , 700 - 725 , 725 - 750 , 750 - 775 | ||
 | Click To Change The Sort Order: By Market Cap or Company Size Performance: Year-to-date, Week and Day |  |
|
Get the most comprehensive stock market coverage daily at 12Stocks.com ➞ Best Stocks Today ➞ Best Stocks Weekly ➞ Best Stocks Year-to-Date ➞ Best Stocks Trends ➞  Best Stocks Today 12Stocks.com Best Nasdaq Stocks ➞ Best S&P 500 Stocks ➞ Best Tech Stocks ➞ Best Biotech Stocks ➞ |
| Detailed Overview of Midcap Stocks |
| Midcap Technical Overview, Leaders & Laggards, Top Midcap ETF Funds & Detailed Midcap Stocks List, Charts, Trends & More |
| Midcap: Technical Analysis, Trends & YTD Performance | |
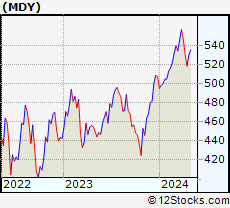
| MidCap segment as represented by
MDY, an exchange-traded fund [ETF], holds basket of about four hundred midcap stocks from across all major sectors of the US stock market. The midcap index (contains stocks like Green Mountain Coffee Roasters and Tractor Supply Company) is up by 3.03% and is currently underperforming the overall market by -1.77% year-to-date. Below is a quick view of technical charts and trends: | |
 MDY Weekly Chart |
|
| Long Term Trend: Good | |
| Medium Term Trend: Not Good | |
 MDY Daily Chart |
|
| Short Term Trend: Not Good | |
| Overall Trend Score: 38 | |
| YTD Performance: 3.03% | |
| **Trend Scores & Views Are Only For Educational Purposes And Not For Investing | |
| 12Stocks.com: Investing in Midcap Index using Exchange Traded Funds | |
|
The following table shows list of key exchange traded funds (ETF) that
help investors track Midcap index. The following list also includes leveraged ETF funds that track twice or thrice the daily returns of Midcap indices. Short or inverse ETF funds move in the opposite direction to the index they track and are useful during market pullbacks or during bear markets. Quick View: Move mouse or cursor over ETF symbol (ticker) to view short-term technical chart and over ETF name to view long term chart. Click on ticker or stock name for detailed view. Click on to add stock symbol to your watchlist and to view watchlist. |
12Stocks.com List of ETFs that track Midcap Index
| Ticker | ETF Name | Watchlist | Recent Price | Smart Investing & Trading Score | Change % | Week % | Year-to-date % |
| IJH | iShares Core S&P Mid-Cap | | 57.13 | 33 | -1.79 | -1.19 | 3.07% |
| MDY | SPDR S&P MidCap 400 ETF | | 522.76 | 38 | -1.79 | -1.25 | 3.03% |
| IWR | iShares Russell Mid-Cap | | 79.62 | 38 | -1.68 | -1.12 | 2.43% |
| IWP | iShares Russell Mid-Cap Growth | | 107.44 | 33 | -1.85 | -1.41 | 2.85% |
| IJK | iShares S&P Mid-Cap 400 Growth | | 85.84 | 38 | -1.91 | -1.33 | 8.36% |
| IWS | iShares Russell Mid-Cap Value | | 118.86 | 43 | -1.57 | -0.94 | 2.21% |
| IJJ | iShares S&P Mid-Cap 400 Value | | 111.06 | 20 | -1.59 | -1.04 | -2.61% |
| XMLV | PowerShares S&P MidCap Low Volatil ETF | | 54.44 | 58 | -0.91 | -0.38 | 2.37% |
| UMDD | ProShares UltraPro MidCap400 | | 23.26 | 31 | -4.36 | -2.92 | 4.21% |
| SMDD | ProShares UltraPro Short MidCap400 | | 12.21 | 57 | 5.08 | 3.21 | -9.31% |
| MVV | ProShares Ultra MidCap400 | | 59.89 | 38 | -3.10 | -2.51 | 3.45% |
| MYY | ProShares Short MidCap400 | | 20.91 | 40 | 1.06 | 0.58 | -2.54% |
| MZZ | ProShares UltraShort MidCap400 | | 11.82 | 27 | 1.98 | 1.2 | -5.97% |
| 12Stocks.com: Charts, Trends, Fundamental Data and Performances of MidCap Stocks | |
|
We now take in-depth look at all MidCap stocks including charts, multi-period performances and overall trends (as measured by Smart Investing & Trading Score). One can sort MidCap stocks (click link to choose) by Daily, Weekly and by Year-to-Date performances. Also, one can sort by size of the company or by market capitalization. |
| Select Your Default Chart Type: | |||||
| |||||
| Click on stock symbol or name for detailed view. Click on to add stock symbol to your watchlist and to view watchlist. Quick View: Move mouse or cursor over "Daily" to quickly view daily technical stock chart and over "Weekly" to view weekly technical stock chart. | |||||

 | RL Ralph Lauren Corporation |
| Sector: Consumer Staples | |
| SubSector: Textile - Apparel Clothing | |
| MarketCap: 5589.95 Millions | |
| Recent Price: 163.64 Smart Investing & Trading Score: 48 | |
| Day Percent Change: -2.03% Day Change: -3.39 | |
| Week Change: -1.71% Year-to-date Change: 13.5% | |
| RL Links: Profile News Message Board | |
| Charts:- Daily , Weekly | |
| Add RL to Watchlist: View: Get Complete RL Trend Analysis ➞ | |
 | CCL Carnival Corporation & Plc |
| Sector: Services & Goods | |
| SubSector: Resorts & Casinos | |
| MarketCap: 11725.4 Millions | |
| Recent Price: 14.82 Smart Investing & Trading Score: 32 | |
| Day Percent Change: -2.05% Day Change: -0.31 | |
| Week Change: -1.72% Year-to-date Change: -20.1% | |
| CCL Links: Profile News Message Board | |
| Charts:- Daily , Weekly | |
| Add CCL to Watchlist: View: Get Complete CCL Trend Analysis ➞ | |
 | TOL Toll Brothers, Inc. |
| Sector: Industrials | |
| SubSector: Residential Construction | |
| MarketCap: 2278.26 Millions | |
| Recent Price: 119.11 Smart Investing & Trading Score: 63 | |
| Day Percent Change: -2.06% Day Change: -2.50 | |
| Week Change: -0.92% Year-to-date Change: 15.9% | |
| TOL Links: Profile News Message Board | |
| Charts:- Daily , Weekly | |
| Add TOL to Watchlist: View: Get Complete TOL Trend Analysis ➞ | |
 | JKHY Jack Henry & Associates, Inc. |
| Sector: Technology | |
| SubSector: Information Technology Services | |
| MarketCap: 10695.4 Millions | |
| Recent Price: 162.69 Smart Investing & Trading Score: 5 | |
| Day Percent Change: -2.06% Day Change: -3.43 | |
| Week Change: -1.33% Year-to-date Change: -0.4% | |
| JKHY Links: Profile News Message Board | |
| Charts:- Daily , Weekly | |
| Add JKHY to Watchlist: View: Get Complete JKHY Trend Analysis ➞ | |
 | ICLR ICON Public Limited Company |
| Sector: Health Care | |
| SubSector: Medical Laboratories & Research | |
| MarketCap: 7011 Millions | |
| Recent Price: 297.88 Smart Investing & Trading Score: 41 | |
| Day Percent Change: -2.06% Day Change: -6.26 | |
| Week Change: -3.38% Year-to-date Change: 5.2% | |
| ICLR Links: Profile News Message Board | |
| Charts:- Daily , Weekly | |
| Add ICLR to Watchlist: View: Get Complete ICLR Trend Analysis ➞ | |
 | ALLY Ally Financial Inc. |
| Sector: Financials | |
| SubSector: Mortgage Investment | |
| MarketCap: 4643.99 Millions | |
| Recent Price: 38.35 Smart Investing & Trading Score: 51 | |
| Day Percent Change: -2.07% Day Change: -0.81 | |
| Week Change: -2.42% Year-to-date Change: 9.8% | |
| ALLY Links: Profile News Message Board | |
| Charts:- Daily , Weekly | |
| Add ALLY to Watchlist: View: Get Complete ALLY Trend Analysis ➞ | |
 | ROIV Roivant Sciences Ltd. |
| Sector: Health Care | |
| SubSector: Biotechnology | |
| MarketCap: 7780 Millions | |
| Recent Price: 10.90 Smart Investing & Trading Score: 41 | |
| Day Percent Change: -2.07% Day Change: -0.23 | |
| Week Change: -1.22% Year-to-date Change: -1.9% | |
| ROIV Links: Profile News Message Board | |
| Charts:- Daily , Weekly | |
| Add ROIV to Watchlist: View: Get Complete ROIV Trend Analysis ➞ | |
 | KSS Kohl s Corporation |
| Sector: Services & Goods | |
| SubSector: Department Stores | |
| MarketCap: 3068 Millions | |
| Recent Price: 23.94 Smart Investing & Trading Score: 32 | |
| Day Percent Change: -2.09% Day Change: -0.51 | |
| Week Change: -2.41% Year-to-date Change: -16.5% | |
| KSS Links: Profile News Message Board | |
| Charts:- Daily , Weekly | |
| Add KSS to Watchlist: View: Get Complete KSS Trend Analysis ➞ | |
 | JBL Jabil Inc. |
| Sector: Technology | |
| SubSector: Printed Circuit Boards | |
| MarketCap: 3272.15 Millions | |
| Recent Price: 117.36 Smart Investing & Trading Score: 17 | |
| Day Percent Change: -2.09% Day Change: -2.51 | |
| Week Change: -0.77% Year-to-date Change: -7.9% | |
| JBL Links: Profile News Message Board | |
| Charts:- Daily , Weekly | |
| Add JBL to Watchlist: View: Get Complete JBL Trend Analysis ➞ | |
 | TXT Textron Inc. |
| Sector: Industrials | |
| SubSector: Aerospace/Defense - Major Diversified | |
| MarketCap: 6123.09 Millions | |
| Recent Price: 84.59 Smart Investing & Trading Score: 21 | |
| Day Percent Change: -2.09% Day Change: -1.81 | |
| Week Change: -2.22% Year-to-date Change: 5.2% | |
| TXT Links: Profile News Message Board | |
| Charts:- Daily , Weekly | |
| Add TXT to Watchlist: View: Get Complete TXT Trend Analysis ➞ | |
 | FNF Fidelity National Financial, Inc. |
| Sector: Financials | |
| SubSector: Surety & Title Insurance | |
| MarketCap: 6532.18 Millions | |
| Recent Price: 49.50 Smart Investing & Trading Score: 22 | |
| Day Percent Change: -2.10% Day Change: -1.06 | |
| Week Change: -1.77% Year-to-date Change: -3.0% | |
| FNF Links: Profile News Message Board | |
| Charts:- Daily , Weekly | |
| Add FNF to Watchlist: View: Get Complete FNF Trend Analysis ➞ | |
 | GDDY GoDaddy Inc. |
| Sector: Technology | |
| SubSector: Internet Software & Services | |
| MarketCap: 9570.51 Millions | |
| Recent Price: 122.38 Smart Investing & Trading Score: 38 | |
| Day Percent Change: -2.10% Day Change: -2.63 | |
| Week Change: -2.1% Year-to-date Change: 15.3% | |
| GDDY Links: Profile News Message Board | |
| Charts:- Daily , Weekly | |
| Add GDDY to Watchlist: View: Get Complete GDDY Trend Analysis ➞ | |
 | WHR Whirlpool Corporation |
| Sector: Consumer Staples | |
| SubSector: Appliances | |
| MarketCap: 5015.08 Millions | |
| Recent Price: 94.86 Smart Investing & Trading Score: 18 | |
| Day Percent Change: -2.11% Day Change: -2.04 | |
| Week Change: 0.27% Year-to-date Change: -22.1% | |
| WHR Links: Profile News Message Board | |
| Charts:- Daily , Weekly | |
| Add WHR to Watchlist: View: Get Complete WHR Trend Analysis ➞ | |
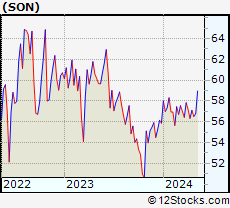 | SON Sonoco Products Company |
| Sector: Consumer Staples | |
| SubSector: Packaging & Containers | |
| MarketCap: 4564.33 Millions | |
| Recent Price: 56.05 Smart Investing & Trading Score: 32 | |
| Day Percent Change: -2.11% Day Change: -1.21 | |
| Week Change: -0.81% Year-to-date Change: 0.3% | |
| SON Links: Profile News Message Board | |
| Charts:- Daily , Weekly | |
| Add SON to Watchlist: View: Get Complete SON Trend Analysis ➞ | |
 | VMI Valmont Industries, Inc. |
| Sector: Industrials | |
| SubSector: Metal Fabrication | |
| MarketCap: 2251.6 Millions | |
| Recent Price: 204.80 Smart Investing & Trading Score: 10 | |
| Day Percent Change: -2.12% Day Change: -4.44 | |
| Week Change: -2.47% Year-to-date Change: -12.3% | |
| VMI Links: Profile News Message Board | |
| Charts:- Daily , Weekly | |
| Add VMI to Watchlist: View: Get Complete VMI Trend Analysis ➞ | |
 | VNT Vontier Corporation |
| Sector: Technology | |
| SubSector: Scientific & Technical Instruments | |
| MarketCap: 53787 Millions | |
| Recent Price: 40.63 Smart Investing & Trading Score: 51 | |
| Day Percent Change: -2.14% Day Change: -0.89 | |
| Week Change: -1.43% Year-to-date Change: 17.6% | |
| VNT Links: Profile News Message Board | |
| Charts:- Daily , Weekly | |
| Add VNT to Watchlist: View: Get Complete VNT Trend Analysis ➞ | |
 | DLB Dolby Laboratories, Inc. |
| Sector: Technology | |
| SubSector: Diversified Electronics | |
| MarketCap: 5618.16 Millions | |
| Recent Price: 77.66 Smart Investing & Trading Score: 0 | |
| Day Percent Change: -2.15% Day Change: -1.71 | |
| Week Change: -1.94% Year-to-date Change: -9.9% | |
| DLB Links: Profile News Message Board | |
| Charts:- Daily , Weekly | |
| Add DLB to Watchlist: View: Get Complete DLB Trend Analysis ➞ | |
 | GWRE Guidewire Software, Inc. |
| Sector: Technology | |
| SubSector: Business Software & Services | |
| MarketCap: 7073.18 Millions | |
| Recent Price: 110.40 Smart Investing & Trading Score: 7 | |
| Day Percent Change: -2.15% Day Change: -2.43 | |
| Week Change: -2.77% Year-to-date Change: 1.3% | |
| GWRE Links: Profile News Message Board | |
| Charts:- Daily , Weekly | |
| Add GWRE to Watchlist: View: Get Complete GWRE Trend Analysis ➞ | |
 | JWN Nordstrom, Inc. |
| Sector: Services & Goods | |
| SubSector: Apparel Stores | |
| MarketCap: 3351.68 Millions | |
| Recent Price: 19.01 Smart Investing & Trading Score: 44 | |
| Day Percent Change: -2.16% Day Change: -0.42 | |
| Week Change: -0.63% Year-to-date Change: 3.0% | |
| JWN Links: Profile News Message Board | |
| Charts:- Daily , Weekly | |
| Add JWN to Watchlist: View: Get Complete JWN Trend Analysis ➞ | |
 | DASH DoorDash, Inc. |
| Sector: Technology | |
| SubSector: Internet Content & Information | |
| MarketCap: 59087 Millions | |
| Recent Price: 129.26 Smart Investing & Trading Score: 63 | |
| Day Percent Change: -2.16% Day Change: -2.86 | |
| Week Change: -2.16% Year-to-date Change: 30.8% | |
| DASH Links: Profile News Message Board | |
| Charts:- Daily , Weekly | |
| Add DASH to Watchlist: View: Get Complete DASH Trend Analysis ➞ | |
 | WMB The Williams Companies, Inc. |
| Sector: Energy | |
| SubSector: Oil & Gas Pipelines | |
| MarketCap: 16851.5 Millions | |
| Recent Price: 38.36 Smart Investing & Trading Score: 51 | |
| Day Percent Change: -2.17% Day Change: -0.85 | |
| Week Change: -2.29% Year-to-date Change: 10.1% | |
| WMB Links: Profile News Message Board | |
| Charts:- Daily , Weekly | |
| Add WMB to Watchlist: View: Get Complete WMB Trend Analysis ➞ | |
 | AVT Avnet, Inc. |
| Sector: Services & Goods | |
| SubSector: Electronics Wholesale | |
| MarketCap: 2776.33 Millions | |
| Recent Price: 48.87 Smart Investing & Trading Score: 68 | |
| Day Percent Change: -2.18% Day Change: -1.09 | |
| Week Change: -2.46% Year-to-date Change: -3.0% | |
| AVT Links: Profile News Message Board | |
| Charts:- Daily , Weekly | |
| Add AVT to Watchlist: View: Get Complete AVT Trend Analysis ➞ | |
 | EXPD Expeditors International of Washington, Inc. |
| Sector: Transports | |
| SubSector: Air Delivery & Freight Services | |
| MarketCap: 10129.8 Millions | |
| Recent Price: 111.31 Smart Investing & Trading Score: 0 | |
| Day Percent Change: -2.18% Day Change: -2.48 | |
| Week Change: -1.76% Year-to-date Change: -12.5% | |
| EXPD Links: Profile News Message Board | |
| Charts:- Daily , Weekly | |
| Add EXPD to Watchlist: View: Get Complete EXPD Trend Analysis ➞ | |
 | CCCS CCC Intelligent Solutions Holdings Inc. |
| Sector: Technology | |
| SubSector: Software - Infrastructure | |
| MarketCap: 6990 Millions | |
| Recent Price: 11.21 Smart Investing & Trading Score: 26 | |
| Day Percent Change: -2.18% Day Change: -0.25 | |
| Week Change: -2.44% Year-to-date Change: -1.2% | |
| CCCS Links: Profile News Message Board | |
| Charts:- Daily , Weekly | |
| Add CCCS to Watchlist: View: Get Complete CCCS Trend Analysis ➞ | |
 | FIS Fidelity National Information Services, Inc. |
| Sector: Technology | |
| SubSector: Information Technology Services | |
| MarketCap: 71126.8 Millions | |
| Recent Price: 67.92 Smart Investing & Trading Score: 31 | |
| Day Percent Change: -2.19% Day Change: -1.52 | |
| Week Change: -2.41% Year-to-date Change: 13.1% | |
| FIS Links: Profile News Message Board | |
| Charts:- Daily , Weekly | |
| Add FIS to Watchlist: View: Get Complete FIS Trend Analysis ➞ | |
| For tabular summary view of above stock list: Summary View ➞ 0 - 25 , 25 - 50 , 50 - 75 , 75 - 100 , 100 - 125 , 125 - 150 , 150 - 175 , 175 - 200 , 200 - 225 , 225 - 250 , 250 - 275 , 275 - 300 , 300 - 325 , 325 - 350 , 350 - 375 , 375 - 400 , 400 - 425 , 425 - 450 , 450 - 475 , 475 - 500 , 500 - 525 , 525 - 550 , 550 - 575 , 575 - 600 , 600 - 625 , 625 - 650 , 650 - 675 , 675 - 700 , 700 - 725 , 725 - 750 , 750 - 775 | ||
| Click To Change The Sort Order: By Market Cap or Company Size Performance: Year-to-date, Week and Day | |
| Select Chart Type: | ||
|
Best Stocks Today 12Stocks.com |
© 2024 12Stocks.com Terms & Conditions Privacy Contact Us
All Information Provided Only For Education And Not To Be Used For Investing or Trading. See Terms & Conditions


One More Thing ... Get Best Stocks Delivered Daily!
Never Ever Miss A Move With Our Top Ten Stocks Lists
Find Best Stocks In Any Market - Bull or Bear Market
Take A Peek At Our Top Ten Stocks Lists: Daily, Weekly, Year-to-Date & Top Trends
Find Best Stocks In Any Market - Bull or Bear Market
Take A Peek At Our Top Ten Stocks Lists: Daily, Weekly, Year-to-Date & Top Trends
Midcap Stocks With Best Up Trends [0-bearish to 100-bullish]: Tenet [100], Woodward [100], Sensata Technologies[100], Leidos [100], Corning [100], Zebra Technologies[100], Timken [100], OneMain [100], CAVA [100], Mosaic [100], Texas Roadhouse[100]
Best Midcap Stocks Year-to-Date:
Vistra Energy[96.88%], AppLovin [77.26%], ShockWave Medical[73.27%], EMCOR [65.79%], CAVA [65.46%], Constellation Energy[58.77%], Wingstop [49.97%], Antero Resources[49.96%], Spotify [49.24%], Tenet [48.59%], Natera [48.28%] Best Midcap Stocks This Week:
Tenet [16.81%], agilon health[10%], Sensata Technologies[9.52%], Woodward [7.82%], Leidos [7.56%], Corning [6.54%], Maravai LifeSciences[6.49%], 10x Genomics[6.13%], Domino s[6.05%], Zebra Technologies[5.84%], Timken [4.99%] Best Midcap Stocks Daily:
Tenet [13.25%], Woodward [7.47%], agilon health[7.21%], Sensata Technologies[7.13%], Leidos [6.53%], Corning [5.03%], Zebra Technologies[4.85%], Maravai LifeSciences[4.46%], 10x Genomics[3.10%], Quidel [3.02%], Timken [2.91%]