
 Login Sign Up


| |||||
 |  | ||||

| 12Stocks.com Market Intelligence |
Best MidCap Stocks
|
| In a hurry? Mid Cap Stocks Lists: Performance Trends Table, Stock Charts
Sort midcap stocks: Daily, Weekly, Year-to-Date, Market Cap & Trends. Filter midcap stocks list by sector: Show all, Tech, Finance, Energy, Staples, Retail, Industrial, Materials, Utilities and HealthCare Filter midcap stocks list by size:All MidCap Large Mid-Range Small |
| 12Stocks.com Mid Cap Stocks Performances & Trends Daily | |||||||||
|
|  The overall Smart Investing & Trading Score is 70 (0-bearish to 100-bullish) which puts Mid Cap index in short term neutral to bullish trend. The Smart Investing & Trading Score from previous trading session is 56 and hence an improvement of trend.
| ||||||||
Here are the Smart Investing & Trading Scores of the most requested mid cap stocks at 12Stocks.com (click stock name for detailed review):
|


| 12Stocks.com: Top Performing Mid Cap Index Stocks | ||||||||||||||||||||||||||||||||||||||||||||||||
 The top performing Mid Cap Index stocks year to date are
Now, more recently, over last week, the top performing Mid Cap Index stocks on the move are


|
||||||||||||||||||||||||||||||||||||||||||||||||
| 12Stocks.com: Investing in Midcap Index with Stocks | |
|
The following table helps investors and traders sort through current performance and trends (as measured by Smart Investing & Trading Score) of various
stocks in the Midcap Index. Quick View: Move mouse or cursor over stock symbol (ticker) to view short-term technical chart and over stock name to view long term chart. Click on  to add stock symbol to your watchlist and to add stock symbol to your watchlist and  to view watchlist. Click on any ticker or stock name for detailed market intelligence report for that stock. to view watchlist. Click on any ticker or stock name for detailed market intelligence report for that stock. |
12Stocks.com Performance of Stocks in Midcap Index
| Ticker | Stock Name | Watchlist | Category | Recent Price | Smart Investing & Trading Score | Change % | YTD Change% |
| ACGL | Arch Capital |   | Financials | 91.25 | 46 | 0.39 | 22.86% |
| MTG | MGIC | | Financials | 20.56 | 90 | 0.39 | 6.58% |
| XRAY | DENTSPLY SIRONA | | Health Care | 30.69 | 35 | 0.39 | -13.77% |
| MANH | Manhattan Associates | | Technology | 209.83 | 32 | 0.39 | -2.55% |
| HES | Hess | | Energy | 163.13 | 100 | 0.37 | 13.16% |
| AAP | Advance Auto | | Services & Goods | 75.42 | 68 | 0.37 | 23.58% |
| CHH | Choice Hotels | | Services & Goods | 119.49 | 42 | 0.37 | 5.46% |
| SPR | Spirit Aero | | Industrials | 32.61 | 68 | 0.37 | 2.61% |
| CTVA | Corteva | | Materials | 55.13 | 83 | 0.37 | 15.04% |
| ZI | ZoomInfo Technologies | | Technology | 16.43 | 100 | 0.37 | -11.14% |
| TTEK | Tetra Tech | | Services & Goods | 193.20 | 69 | 0.36 | 15.74% |
| LNT | Alliant Energy | | Utilities | 49.77 | 68 | 0.36 | -2.98% |
| MPWR | Monolithic Power | | Technology | 679.70 | 95 | 0.36 | 7.76% |
| BRKR | Bruker | | Health Care | 81.26 | 43 | 0.36 | 10.59% |
| RPRX | Royalty Pharma | | Health Care | 28.10 | 17 | 0.36 | 0.04% |
| STWD | Starwood Property | | Financials | 19.57 | 64 | 0.36 | -6.90% |
| FDS | FactSet Research | | Technology | 422.94 | 35 | 0.35 | -11.34% |
| CTRA | Contura Energy | | Materials | 28.39 | 88 | 0.35 | 11.25% |
| FNF | Fidelity National | | Financials | 50.56 | 88 | 0.34 | -0.90% |
| CCL | Carnival | | Services & Goods | 15.13 | 57 | 0.33 | -18.39% |
| RL | Ralph Lauren | | Consumer Staples | 167.03 | 73 | 0.33 | 15.83% |
| WWD | Woodward | | Industrials | 151.07 | 85 | 0.33 | 10.97% |
| VEEV | Veeva | | Technology | 201.58 | 25 | 0.33 | 4.71% |
| CIEN | Ciena | | Technology | 46.76 | 64 | 0.32 | 3.89% |
| VRSK | Verisk Analytics | | Services & Goods | 221.85 | 42 | 0.32 | -7.12% |
| For chart view version of above stock list: Chart View ➞ 0 - 25 , 25 - 50 , 50 - 75 , 75 - 100 , 100 - 125 , 125 - 150 , 150 - 175 , 175 - 200 , 200 - 225 , 225 - 250 , 250 - 275 , 275 - 300 , 300 - 325 , 325 - 350 , 350 - 375 , 375 - 400 , 400 - 425 , 425 - 450 , 450 - 475 , 475 - 500 , 500 - 525 , 525 - 550 , 550 - 575 , 575 - 600 , 600 - 625 , 625 - 650 , 650 - 675 , 675 - 700 , 700 - 725 , 725 - 750 , 750 - 775 | ||
 | Click To Change The Sort Order: By Market Cap or Company Size Performance: Year-to-date, Week and Day |  |
|
Get the most comprehensive stock market coverage daily at 12Stocks.com ➞ Best Stocks Today ➞ Best Stocks Weekly ➞ Best Stocks Year-to-Date ➞ Best Stocks Trends ➞  Best Stocks Today 12Stocks.com Best Nasdaq Stocks ➞ Best S&P 500 Stocks ➞ Best Tech Stocks ➞ Best Biotech Stocks ➞ |
| Detailed Overview of Midcap Stocks |
| Midcap Technical Overview, Leaders & Laggards, Top Midcap ETF Funds & Detailed Midcap Stocks List, Charts, Trends & More |
| Midcap: Technical Analysis, Trends & YTD Performance | |
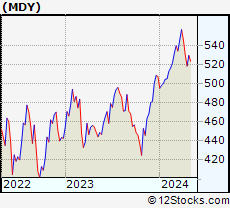
| MidCap segment as represented by
MDY, an exchange-traded fund [ETF], holds basket of about four hundred midcap stocks from across all major sectors of the US stock market. The midcap index (contains stocks like Green Mountain Coffee Roasters and Tractor Supply Company) is up by 4.91% and is currently underperforming the overall market by -1.65% year-to-date. Below is a quick view of technical charts and trends: | |
 MDY Weekly Chart |
|
| Long Term Trend: Very Good | |
| Medium Term Trend: Good | |
 MDY Daily Chart |
|
| Short Term Trend: Very Good | |
| Overall Trend Score: 70 | |
| YTD Performance: 4.91% | |
| **Trend Scores & Views Are Only For Educational Purposes And Not For Investing | |
| 12Stocks.com: Investing in Midcap Index using Exchange Traded Funds | |
|
The following table shows list of key exchange traded funds (ETF) that
help investors track Midcap index. The following list also includes leveraged ETF funds that track twice or thrice the daily returns of Midcap indices. Short or inverse ETF funds move in the opposite direction to the index they track and are useful during market pullbacks or during bear markets. Quick View: Move mouse or cursor over ETF symbol (ticker) to view short-term technical chart and over ETF name to view long term chart. Click on ticker or stock name for detailed view. Click on to add stock symbol to your watchlist and to view watchlist. |
12Stocks.com List of ETFs that track Midcap Index
| Ticker | ETF Name | Watchlist | Recent Price | Smart Investing & Trading Score | Change % | Week % | Year-to-date % |
| IJH | iShares Core S&P Mid-Cap | | 58.17 | 75 | 0.61 | 0.61 | 4.94% |
| IWR | iShares Russell Mid-Cap | | 80.98 | 75 | 0.57 | 0.57 | 4.18% |
| IWP | iShares Russell Mid-Cap Growth | | 109.47 | 78 | 0.45 | 0.45 | 4.8% |
| MDY | SPDR S&P MidCap 400 ETF | | 532.28 | 70 | 0.55 | 0.55 | 4.91% |
| IWS | iShares Russell Mid-Cap Value | | 120.76 | 75 | 0.64 | 0.64 | 3.84% |
| IJK | iShares S&P Mid-Cap 400 Growth | | 87.51 | 70 | 0.59 | 0.59 | 10.46% |
| IJJ | iShares S&P Mid-Cap 400 Value | | 112.85 | 88 | 0.55 | 0.55 | -1.04% |
| XMLV | PowerShares S&P MidCap Low Volatil ETF | | 54.94 | 83 | 0.53 | 0.53 | 3.31% |
| UMDD | ProShares UltraPro MidCap400 | | 24.32 | 71 | 1.50 | 1.5 | 8.96% |
| SMDD | ProShares UltraPro Short MidCap400 | | 11.62 | 10 | -1.78 | -1.78 | -13.69% |
| MYY | ProShares Short MidCap400 | | 20.69 | 18 | -0.48 | -0.48 | -3.56% |
| MZZ | ProShares UltraShort MidCap400 | | 11.59 | 20 | -0.77 | -0.77 | -7.8% |
| MVV | ProShares Ultra MidCap400 | | 61.81 | 75 | 0.61 | 0.61 | 6.76% |
| 12Stocks.com: Charts, Trends, Fundamental Data and Performances of MidCap Stocks | |
|
We now take in-depth look at all MidCap stocks including charts, multi-period performances and overall trends (as measured by Smart Investing & Trading Score). One can sort MidCap stocks (click link to choose) by Daily, Weekly and by Year-to-Date performances. Also, one can sort by size of the company or by market capitalization. |
| Select Your Default Chart Type: | |||||
| |||||
| Click on stock symbol or name for detailed view. Click on to add stock symbol to your watchlist and to view watchlist. Quick View: Move mouse or cursor over "Daily" to quickly view daily technical stock chart and over "Weekly" to view weekly technical stock chart. | |||||

 | ACGL Arch Capital Group Ltd. |
| Sector: Financials | |
| SubSector: Property & Casualty Insurance | |
| MarketCap: 12350.9 Millions | |
| Recent Price: 91.25 Smart Investing & Trading Score: 46 | |
| Day Percent Change: 0.39% Day Change: 0.35 | |
| Week Change: 0.39% Year-to-date Change: 22.9% | |
| ACGL Links: Profile News Message Board | |
| Charts:- Daily , Weekly | |
| Add ACGL to Watchlist: View: Get Complete ACGL Trend Analysis ➞ | |
 | MTG MGIC Investment Corporation |
| Sector: Financials | |
| SubSector: Property & Casualty Insurance | |
| MarketCap: 2521.62 Millions | |
| Recent Price: 20.56 Smart Investing & Trading Score: 90 | |
| Day Percent Change: 0.39% Day Change: 0.08 | |
| Week Change: 0.39% Year-to-date Change: 6.6% | |
| MTG Links: Profile News Message Board | |
| Charts:- Daily , Weekly | |
| Add MTG to Watchlist: View: Get Complete MTG Trend Analysis ➞ | |
 | XRAY DENTSPLY SIRONA Inc. |
| Sector: Health Care | |
| SubSector: Medical Instruments & Supplies | |
| MarketCap: 7746.1 Millions | |
| Recent Price: 30.69 Smart Investing & Trading Score: 35 | |
| Day Percent Change: 0.39% Day Change: 0.12 | |
| Week Change: 0.39% Year-to-date Change: -13.8% | |
| XRAY Links: Profile News Message Board | |
| Charts:- Daily , Weekly | |
| Add XRAY to Watchlist: View: Get Complete XRAY Trend Analysis ➞ | |
 | MANH Manhattan Associates, Inc. |
| Sector: Technology | |
| SubSector: Application Software | |
| MarketCap: 3487.02 Millions | |
| Recent Price: 209.83 Smart Investing & Trading Score: 32 | |
| Day Percent Change: 0.39% Day Change: 0.81 | |
| Week Change: 0.39% Year-to-date Change: -2.6% | |
| MANH Links: Profile News Message Board | |
| Charts:- Daily , Weekly | |
| Add MANH to Watchlist: View: Get Complete MANH Trend Analysis ➞ | |
 | HES Hess Corporation |
| Sector: Energy | |
| SubSector: Independent Oil & Gas | |
| MarketCap: 10465.3 Millions | |
| Recent Price: 163.13 Smart Investing & Trading Score: 100 | |
| Day Percent Change: 0.37% Day Change: 0.60 | |
| Week Change: 0.37% Year-to-date Change: 13.2% | |
| HES Links: Profile News Message Board | |
| Charts:- Daily , Weekly | |
| Add HES to Watchlist: View: Get Complete HES Trend Analysis ➞ | |
 | AAP Advance Auto Parts, Inc. |
| Sector: Services & Goods | |
| SubSector: Auto Parts Stores | |
| MarketCap: 5977.7 Millions | |
| Recent Price: 75.42 Smart Investing & Trading Score: 68 | |
| Day Percent Change: 0.37% Day Change: 0.28 | |
| Week Change: 0.37% Year-to-date Change: 23.6% | |
| AAP Links: Profile News Message Board | |
| Charts:- Daily , Weekly | |
| Add AAP to Watchlist: View: Get Complete AAP Trend Analysis ➞ | |
 | CHH Choice Hotels International, Inc. |
| Sector: Services & Goods | |
| SubSector: Lodging | |
| MarketCap: 3427.56 Millions | |
| Recent Price: 119.49 Smart Investing & Trading Score: 42 | |
| Day Percent Change: 0.37% Day Change: 0.44 | |
| Week Change: 0.37% Year-to-date Change: 5.5% | |
| CHH Links: Profile News Message Board | |
| Charts:- Daily , Weekly | |
| Add CHH to Watchlist: View: Get Complete CHH Trend Analysis ➞ | |
 | SPR Spirit AeroSystems Holdings, Inc. |
| Sector: Industrials | |
| SubSector: Aerospace/Defense Products & Services | |
| MarketCap: 2283.01 Millions | |
| Recent Price: 32.61 Smart Investing & Trading Score: 68 | |
| Day Percent Change: 0.37% Day Change: 0.12 | |
| Week Change: 0.37% Year-to-date Change: 2.6% | |
| SPR Links: Profile News Message Board | |
| Charts:- Daily , Weekly | |
| Add SPR to Watchlist: View: Get Complete SPR Trend Analysis ➞ | |
 | CTVA Corteva, Inc. |
| Sector: Materials | |
| SubSector: Agricultural Chemicals | |
| MarketCap: 18894.3 Millions | |
| Recent Price: 55.13 Smart Investing & Trading Score: 83 | |
| Day Percent Change: 0.37% Day Change: 0.20 | |
| Week Change: 0.37% Year-to-date Change: 15.0% | |
| CTVA Links: Profile News Message Board | |
| Charts:- Daily , Weekly | |
| Add CTVA to Watchlist: View: Get Complete CTVA Trend Analysis ➞ | |
 | ZI ZoomInfo Technologies Inc. |
| Sector: Technology | |
| SubSector: Software Application | |
| MarketCap: 15937 Millions | |
| Recent Price: 16.43 Smart Investing & Trading Score: 100 | |
| Day Percent Change: 0.37% Day Change: 0.06 | |
| Week Change: 0.37% Year-to-date Change: -11.1% | |
| ZI Links: Profile News Message Board | |
| Charts:- Daily , Weekly | |
| Add ZI to Watchlist: View: Get Complete ZI Trend Analysis ➞ | |
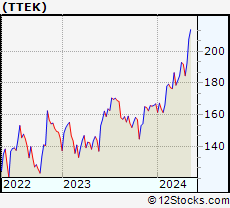 | TTEK Tetra Tech, Inc. |
| Sector: Services & Goods | |
| SubSector: Technical Services | |
| MarketCap: 3985.5 Millions | |
| Recent Price: 193.20 Smart Investing & Trading Score: 69 | |
| Day Percent Change: 0.36% Day Change: 0.70 | |
| Week Change: 0.36% Year-to-date Change: 15.7% | |
| TTEK Links: Profile News Message Board | |
| Charts:- Daily , Weekly | |
| Add TTEK to Watchlist: View: Get Complete TTEK Trend Analysis ➞ | |
 | LNT Alliant Energy Corporation |
| Sector: Utilities | |
| SubSector: Electric Utilities | |
| MarketCap: 10678.4 Millions | |
| Recent Price: 49.77 Smart Investing & Trading Score: 68 | |
| Day Percent Change: 0.36% Day Change: 0.18 | |
| Week Change: 0.36% Year-to-date Change: -3.0% | |
| LNT Links: Profile News Message Board | |
| Charts:- Daily , Weekly | |
| Add LNT to Watchlist: View: Get Complete LNT Trend Analysis ➞ | |
 | MPWR Monolithic Power Systems, Inc. |
| Sector: Technology | |
| SubSector: Semiconductor - Specialized | |
| MarketCap: 6436.4 Millions | |
| Recent Price: 679.70 Smart Investing & Trading Score: 95 | |
| Day Percent Change: 0.36% Day Change: 2.47 | |
| Week Change: 0.36% Year-to-date Change: 7.8% | |
| MPWR Links: Profile News Message Board | |
| Charts:- Daily , Weekly | |
| Add MPWR to Watchlist: View: Get Complete MPWR Trend Analysis ➞ | |
 | BRKR Bruker Corporation |
| Sector: Health Care | |
| SubSector: Medical Laboratories & Research | |
| MarketCap: 5932 Millions | |
| Recent Price: 81.26 Smart Investing & Trading Score: 43 | |
| Day Percent Change: 0.36% Day Change: 0.29 | |
| Week Change: 0.36% Year-to-date Change: 10.6% | |
| BRKR Links: Profile News Message Board | |
| Charts:- Daily , Weekly | |
| Add BRKR to Watchlist: View: Get Complete BRKR Trend Analysis ➞ | |
 | RPRX Royalty Pharma plc |
| Sector: Health Care | |
| SubSector: Biotechnology | |
| MarketCap: 28457 Millions | |
| Recent Price: 28.10 Smart Investing & Trading Score: 17 | |
| Day Percent Change: 0.36% Day Change: 0.10 | |
| Week Change: 0.36% Year-to-date Change: 0.0% | |
| RPRX Links: Profile News Message Board | |
| Charts:- Daily , Weekly | |
| Add RPRX to Watchlist: View: Get Complete RPRX Trend Analysis ➞ | |
 | STWD Starwood Property Trust, Inc. |
| Sector: Financials | |
| SubSector: Mortgage Investment | |
| MarketCap: 3447.09 Millions | |
| Recent Price: 19.57 Smart Investing & Trading Score: 64 | |
| Day Percent Change: 0.36% Day Change: 0.07 | |
| Week Change: 0.36% Year-to-date Change: -6.9% | |
| STWD Links: Profile News Message Board | |
| Charts:- Daily , Weekly | |
| Add STWD to Watchlist: View: Get Complete STWD Trend Analysis ➞ | |
 | FDS FactSet Research Systems Inc. |
| Sector: Technology | |
| SubSector: Information & Delivery Services | |
| MarketCap: 9024.37 Millions | |
| Recent Price: 422.94 Smart Investing & Trading Score: 35 | |
| Day Percent Change: 0.35% Day Change: 1.47 | |
| Week Change: 0.35% Year-to-date Change: -11.3% | |
| FDS Links: Profile News Message Board | |
| Charts:- Daily , Weekly | |
| Add FDS to Watchlist: View: Get Complete FDS Trend Analysis ➞ | |
 | CTRA Contura Energy, Inc. |
| Sector: Materials | |
| SubSector: Industrial Metals & Minerals | |
| MarketCap: 75.291 Millions | |
| Recent Price: 28.39 Smart Investing & Trading Score: 88 | |
| Day Percent Change: 0.35% Day Change: 0.10 | |
| Week Change: 0.35% Year-to-date Change: 11.3% | |
| CTRA Links: Profile News Message Board | |
| Charts:- Daily , Weekly | |
| Add CTRA to Watchlist: View: Get Complete CTRA Trend Analysis ➞ | |
 | FNF Fidelity National Financial, Inc. |
| Sector: Financials | |
| SubSector: Surety & Title Insurance | |
| MarketCap: 6532.18 Millions | |
| Recent Price: 50.56 Smart Investing & Trading Score: 88 | |
| Day Percent Change: 0.34% Day Change: 0.17 | |
| Week Change: 0.34% Year-to-date Change: -0.9% | |
| FNF Links: Profile News Message Board | |
| Charts:- Daily , Weekly | |
| Add FNF to Watchlist: View: Get Complete FNF Trend Analysis ➞ | |
 | CCL Carnival Corporation & Plc |
| Sector: Services & Goods | |
| SubSector: Resorts & Casinos | |
| MarketCap: 11725.4 Millions | |
| Recent Price: 15.13 Smart Investing & Trading Score: 57 | |
| Day Percent Change: 0.33% Day Change: 0.05 | |
| Week Change: 0.33% Year-to-date Change: -18.4% | |
| CCL Links: Profile News Message Board | |
| Charts:- Daily , Weekly | |
| Add CCL to Watchlist: View: Get Complete CCL Trend Analysis ➞ | |
 | RL Ralph Lauren Corporation |
| Sector: Consumer Staples | |
| SubSector: Textile - Apparel Clothing | |
| MarketCap: 5589.95 Millions | |
| Recent Price: 167.03 Smart Investing & Trading Score: 73 | |
| Day Percent Change: 0.33% Day Change: 0.55 | |
| Week Change: 0.33% Year-to-date Change: 15.8% | |
| RL Links: Profile News Message Board | |
| Charts:- Daily , Weekly | |
| Add RL to Watchlist: View: Get Complete RL Trend Analysis ➞ | |
 | WWD Woodward, Inc. |
| Sector: Industrials | |
| SubSector: Aerospace/Defense Products & Services | |
| MarketCap: 3764.01 Millions | |
| Recent Price: 151.07 Smart Investing & Trading Score: 85 | |
| Day Percent Change: 0.33% Day Change: 0.49 | |
| Week Change: 0.33% Year-to-date Change: 11.0% | |
| WWD Links: Profile News Message Board | |
| Charts:- Daily , Weekly | |
| Add WWD to Watchlist: View: Get Complete WWD Trend Analysis ➞ | |
 | VEEV Veeva Systems Inc. |
| Sector: Technology | |
| SubSector: Healthcare Information Services | |
| MarketCap: 21492.1 Millions | |
| Recent Price: 201.58 Smart Investing & Trading Score: 25 | |
| Day Percent Change: 0.33% Day Change: 0.67 | |
| Week Change: 0.33% Year-to-date Change: 4.7% | |
| VEEV Links: Profile News Message Board | |
| Charts:- Daily , Weekly | |
| Add VEEV to Watchlist: View: Get Complete VEEV Trend Analysis ➞ | |
 | CIEN Ciena Corporation |
| Sector: Technology | |
| SubSector: Communication Equipment | |
| MarketCap: 6206.99 Millions | |
| Recent Price: 46.76 Smart Investing & Trading Score: 64 | |
| Day Percent Change: 0.32% Day Change: 0.15 | |
| Week Change: 0.32% Year-to-date Change: 3.9% | |
| CIEN Links: Profile News Message Board | |
| Charts:- Daily , Weekly | |
| Add CIEN to Watchlist: View: Get Complete CIEN Trend Analysis ➞ | |
 | VRSK Verisk Analytics, Inc. |
| Sector: Services & Goods | |
| SubSector: Business Services | |
| MarketCap: 22033.2 Millions | |
| Recent Price: 221.85 Smart Investing & Trading Score: 42 | |
| Day Percent Change: 0.32% Day Change: 0.71 | |
| Week Change: 0.32% Year-to-date Change: -7.1% | |
| VRSK Links: Profile News Message Board | |
| Charts:- Daily , Weekly | |
| Add VRSK to Watchlist: View: Get Complete VRSK Trend Analysis ➞ | |
| For tabular summary view of above stock list: Summary View ➞ 0 - 25 , 25 - 50 , 50 - 75 , 75 - 100 , 100 - 125 , 125 - 150 , 150 - 175 , 175 - 200 , 200 - 225 , 225 - 250 , 250 - 275 , 275 - 300 , 300 - 325 , 325 - 350 , 350 - 375 , 375 - 400 , 400 - 425 , 425 - 450 , 450 - 475 , 475 - 500 , 500 - 525 , 525 - 550 , 550 - 575 , 575 - 600 , 600 - 625 , 625 - 650 , 650 - 675 , 675 - 700 , 700 - 725 , 725 - 750 , 750 - 775 | ||
| Click To Change The Sort Order: By Market Cap or Company Size Performance: Year-to-date, Week and Day | |
| Select Chart Type: | ||
|
Best Stocks Today 12Stocks.com |
© 2024 12Stocks.com Terms & Conditions Privacy Contact Us
All Information Provided Only For Education And Not To Be Used For Investing or Trading. See Terms & Conditions


One More Thing ... Get Best Stocks Delivered Daily!
Never Ever Miss A Move With Our Top Ten Stocks Lists
Find Best Stocks In Any Market - Bull or Bear Market
Take A Peek At Our Top Ten Stocks Lists: Daily, Weekly, Year-to-Date & Top Trends
Find Best Stocks In Any Market - Bull or Bear Market
Take A Peek At Our Top Ten Stocks Lists: Daily, Weekly, Year-to-Date & Top Trends
Midcap Stocks With Best Up Trends [0-bearish to 100-bullish]: Albemarle [100], Medical Properties[100], Domino s[100], Tandem Diabetes[100], Lattice Semiconductor[100], Quest Diagnostics[100], AES [100], Carrier Global[100], Teradyne [100], DaVita [100], Skyworks Solutions[100]
Best Midcap Stocks Year-to-Date:
Vistra Energy[102.39%], AppLovin [83.42%], ShockWave Medical[72.92%], EMCOR [68.8%], CAVA [62.35%], Constellation Energy[61.05%], Spotify [53.34%], Antero Resources[51.23%], Natera [50.13%], Wingstop [49.98%], Pure Storage[47.03%] Best Midcap Stocks This Week:
Ginkgo Bioworks[15.08%], Hertz Global[7.92%], Albemarle [7.57%], Vistra Energy[7.24%], Medical Properties[5.99%], Domino s[5.62%], Liberty SiriusXM[5.49%], Liberty SiriusXM[5.27%], Tandem Diabetes[5.19%], Sirius XM[4.97%], Peloton Interactive[4.43%] Best Midcap Stocks Daily:
Ginkgo Bioworks[15.08%], Hertz Global[7.92%], Albemarle [7.57%], Vistra Energy[7.24%], Medical Properties[5.99%], Domino s[5.62%], Liberty SiriusXM[5.49%], Liberty SiriusXM[5.27%], Tandem Diabetes[5.19%], Sirius XM[4.97%], Peloton Interactive[4.43%]