
 Login Sign Up


| |||||
 |  | ||||

| 12Stocks.com Market Intelligence |
Best MidCap Stocks
|
| In a hurry? Mid Cap Stocks Lists: Performance Trends Table, Stock Charts
Sort midcap stocks: Daily, Weekly, Year-to-Date, Market Cap & Trends. Filter midcap stocks list by sector: Show all, Tech, Finance, Energy, Staples, Retail, Industrial, Materials, Utilities and HealthCare Filter midcap stocks list by size:All MidCap Large Mid-Range Small |
| 12Stocks.com Mid Cap Stocks Performances & Trends Daily | |||||||||
|
|  The overall Smart Investing & Trading Score is 46 (0-bearish to 100-bullish) which puts Mid Cap index in short term neutral trend. The Smart Investing & Trading Score from previous trading session is 70 and hence a deterioration of trend.
| ||||||||
Here are the Smart Investing & Trading Scores of the most requested mid cap stocks at 12Stocks.com (click stock name for detailed review):
|


| 12Stocks.com: Top Performing Mid Cap Index Stocks | ||||||||||||||||||||||||||||||||||||||||||||||||
 The top performing Mid Cap Index stocks year to date are
Now, more recently, over last week, the top performing Mid Cap Index stocks on the move are


|
||||||||||||||||||||||||||||||||||||||||||||||||
| 12Stocks.com: Investing in Midcap Index with Stocks | |
|
The following table helps investors and traders sort through current performance and trends (as measured by Smart Investing & Trading Score) of various
stocks in the Midcap Index. Quick View: Move mouse or cursor over stock symbol (ticker) to view short-term technical chart and over stock name to view long term chart. Click on  to add stock symbol to your watchlist and to add stock symbol to your watchlist and  to view watchlist. Click on any ticker or stock name for detailed market intelligence report for that stock. to view watchlist. Click on any ticker or stock name for detailed market intelligence report for that stock. |
12Stocks.com Performance of Stocks in Midcap Index
| Ticker | Stock Name | Watchlist | Category | Recent Price | Smart Investing & Trading Score | Change % | YTD Change% |
| DT | Dynatrace |   | Technology | 45.31 | 18 | -2.58 | -17.15% |
| AN | AutoNation | | Services & Goods | 161.15 | 73 | -2.59 | 7.30% |
| EWBC | East West | | Financials | 74.47 | 58 | -2.59 | 3.50% |
| TPR | Tapestry | | Consumer Staples | 39.92 | 71 | -2.59 | 8.45% |
| RCL | Royal Caribbean | | Services & Goods | 139.63 | 85 | -2.60 | 7.83% |
| ALLE | Allegion | | Services & Goods | 121.56 | 0 | -2.60 | -4.05% |
| ZG | Zillow | | Technology | 41.99 | 28 | -2.60 | -25.97% |
| CFLT | Confluent | | Technology | 28.11 | 48 | -2.60 | 18.41% |
| CPNG | Coupang | | Services & Goods | 22.50 | 56 | -2.60 | 38.89% |
| OZK | Bank OZK | | Financials | 44.65 | 61 | -2.62 | -10.40% |
| MHK | Mohawk Industries | | Consumer Staples | 115.32 | 90 | -2.63 | 11.42% |
| S | SentinelOne | | Technology | 21.13 | 30 | -2.63 | -23.00% |
| LNC | Loln National | | Financials | 27.27 | 33 | -2.64 | 1.11% |
| CNXC | Concentrix | | Technology | 54.64 | 65 | -2.65 | -44.36% |
| BIO | Bio-Rad | | Health Care | 269.75 | 10 | -2.66 | -16.46% |
| LAD | Lithia Motors | | Services & Goods | 254.38 | 35 | -2.66 | -22.75% |
| GLOB | Globant S.A | | Technology | 178.59 | 28 | -2.67 | -24.96% |
| SPOT | Spotify | | Services & Goods | 280.44 | 61 | -2.67 | 49.24% |
| TRGP | Targa Resources | | Energy | 114.06 | 76 | -2.68 | 31.30% |
| PAYC | Paycom Software | | Technology | 187.98 | 80 | -2.70 | -9.07% |
| IAC | IAC/InterActiveCorp | | Technology | 47.59 | 50 | -2.70 | -9.14% |
| VST | Vistra Energy | | Utilities | 75.84 | 95 | -2.72 | 96.88% |
| DDOG | Datadog | | Technology | 125.56 | 81 | -2.72 | 3.44% |
| PHM | Pulte | | Industrials | 111.42 | 68 | -2.74 | 7.94% |
| RBLX | Roblox | | Services & Goods | 35.56 | 35 | -2.74 | -22.94% |
| For chart view version of above stock list: Chart View ➞ 0 - 25 , 25 - 50 , 50 - 75 , 75 - 100 , 100 - 125 , 125 - 150 , 150 - 175 , 175 - 200 , 200 - 225 , 225 - 250 , 250 - 275 , 275 - 300 , 300 - 325 , 325 - 350 , 350 - 375 , 375 - 400 , 400 - 425 , 425 - 450 , 450 - 475 , 475 - 500 , 500 - 525 , 525 - 550 , 550 - 575 , 575 - 600 , 600 - 625 , 625 - 650 , 650 - 675 , 675 - 700 , 700 - 725 , 725 - 750 , 750 - 775 | ||
 | Click To Change The Sort Order: By Market Cap or Company Size Performance: Year-to-date, Week and Day |  |
|
Get the most comprehensive stock market coverage daily at 12Stocks.com ➞ Best Stocks Today ➞ Best Stocks Weekly ➞ Best Stocks Year-to-Date ➞ Best Stocks Trends ➞  Best Stocks Today 12Stocks.com Best Nasdaq Stocks ➞ Best S&P 500 Stocks ➞ Best Tech Stocks ➞ Best Biotech Stocks ➞ |
| Detailed Overview of Midcap Stocks |
| Midcap Technical Overview, Leaders & Laggards, Top Midcap ETF Funds & Detailed Midcap Stocks List, Charts, Trends & More |
| Midcap: Technical Analysis, Trends & YTD Performance | |
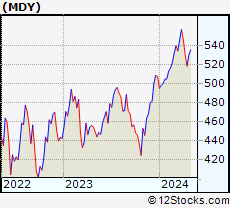
| MidCap segment as represented by
MDY, an exchange-traded fund [ETF], holds basket of about four hundred midcap stocks from across all major sectors of the US stock market. The midcap index (contains stocks like Green Mountain Coffee Roasters and Tractor Supply Company) is up by 3.03% and is currently underperforming the overall market by -1.77% year-to-date. Below is a quick view of technical charts and trends: | |
 MDY Weekly Chart |
|
| Long Term Trend: Good | |
| Medium Term Trend: Not Good | |
 MDY Daily Chart |
|
| Short Term Trend: Not Good | |
| Overall Trend Score: 46 | |
| YTD Performance: 3.03% | |
| **Trend Scores & Views Are Only For Educational Purposes And Not For Investing | |
| 12Stocks.com: Investing in Midcap Index using Exchange Traded Funds | |
|
The following table shows list of key exchange traded funds (ETF) that
help investors track Midcap index. The following list also includes leveraged ETF funds that track twice or thrice the daily returns of Midcap indices. Short or inverse ETF funds move in the opposite direction to the index they track and are useful during market pullbacks or during bear markets. Quick View: Move mouse or cursor over ETF symbol (ticker) to view short-term technical chart and over ETF name to view long term chart. Click on ticker or stock name for detailed view. Click on to add stock symbol to your watchlist and to view watchlist. |
12Stocks.com List of ETFs that track Midcap Index
| Ticker | ETF Name | Watchlist | Recent Price | Smart Investing & Trading Score | Change % | Week % | Year-to-date % |
| IJH | iShares Core S&P Mid-Cap | | 57.13 | 68 | -1.79 | -1.19 | 3.07% |
| MDY | SPDR S&P MidCap 400 ETF | | 522.76 | 46 | -1.79 | -1.25 | 3.03% |
| IWR | iShares Russell Mid-Cap | | 79.64 | 68 | -1.65 | -1.09 | 2.46% |
| IWP | iShares Russell Mid-Cap Growth | | 107.60 | 71 | -1.71 | -1.27 | 3.01% |
| IJK | iShares S&P Mid-Cap 400 Growth | | 85.95 | 63 | -1.78 | -1.21 | 8.5% |
| IWS | iShares Russell Mid-Cap Value | | 118.84 | 68 | -1.59 | -0.96 | 2.19% |
| IJJ | iShares S&P Mid-Cap 400 Value | | 111.50 | 81 | -1.20 | -0.65 | -2.23% |
| XMLV | PowerShares S&P MidCap Low Volatil ETF | | 54.61 | 76 | -0.60 | -0.07 | 2.69% |
| UMDD | ProShares UltraPro MidCap400 | | 23.68 | 31 | -2.63 | -1.17 | 6.09% |
| SMDD | ProShares UltraPro Short MidCap400 | | 11.81 | 57 | 1.64 | -0.17 | -12.28% |
| MVV | ProShares Ultra MidCap400 | | 60.44 | 68 | -2.21 | -1.61 | 4.4% |
| MYY | ProShares Short MidCap400 | | 20.89 | 40 | 0.94 | 0.46 | -2.65% |
| MZZ | ProShares UltraShort MidCap400 | | 11.82 | 27 | 1.98 | 1.2 | -5.97% |
| 12Stocks.com: Charts, Trends, Fundamental Data and Performances of MidCap Stocks | |
|
We now take in-depth look at all MidCap stocks including charts, multi-period performances and overall trends (as measured by Smart Investing & Trading Score). One can sort MidCap stocks (click link to choose) by Daily, Weekly and by Year-to-Date performances. Also, one can sort by size of the company or by market capitalization. |
| Select Your Default Chart Type: | |||||
| |||||
| Click on stock symbol or name for detailed view. Click on to add stock symbol to your watchlist and to view watchlist. Quick View: Move mouse or cursor over "Daily" to quickly view daily technical stock chart and over "Weekly" to view weekly technical stock chart. | |||||

 | DT Dynatrace, Inc. |
| Sector: Technology | |
| SubSector: Application Software | |
| MarketCap: 7007.12 Millions | |
| Recent Price: 45.31 Smart Investing & Trading Score: 18 | |
| Day Percent Change: -2.58% Day Change: -1.20 | |
| Week Change: -3.8% Year-to-date Change: -17.2% | |
| DT Links: Profile News Message Board | |
| Charts:- Daily , Weekly | |
| Add DT to Watchlist: View: Get Complete DT Trend Analysis ➞ | |
 | AN AutoNation, Inc. |
| Sector: Services & Goods | |
| SubSector: Auto Dealerships | |
| MarketCap: 2732.61 Millions | |
| Recent Price: 161.15 Smart Investing & Trading Score: 73 | |
| Day Percent Change: -2.59% Day Change: -4.28 | |
| Week Change: -5.14% Year-to-date Change: 7.3% | |
| AN Links: Profile News Message Board | |
| Charts:- Daily , Weekly | |
| Add AN to Watchlist: View: Get Complete AN Trend Analysis ➞ | |
 | EWBC East West Bancorp, Inc. |
| Sector: Financials | |
| SubSector: Foreign Money Center Banks | |
| MarketCap: 4618.31 Millions | |
| Recent Price: 74.47 Smart Investing & Trading Score: 58 | |
| Day Percent Change: -2.59% Day Change: -1.98 | |
| Week Change: -1.99% Year-to-date Change: 3.5% | |
| EWBC Links: Profile News Message Board | |
| Charts:- Daily , Weekly | |
| Add EWBC to Watchlist: View: Get Complete EWBC Trend Analysis ➞ | |
 | TPR Tapestry, Inc. |
| Sector: Consumer Staples | |
| SubSector: Textile - Apparel Footwear & Accessories | |
| MarketCap: 3890.1 Millions | |
| Recent Price: 39.92 Smart Investing & Trading Score: 71 | |
| Day Percent Change: -2.59% Day Change: -1.06 | |
| Week Change: -0.32% Year-to-date Change: 8.5% | |
| TPR Links: Profile News Message Board | |
| Charts:- Daily , Weekly | |
| Add TPR to Watchlist: View: Get Complete TPR Trend Analysis ➞ | |
 | RCL Royal Caribbean Cruises Ltd. |
| Sector: Services & Goods | |
| SubSector: Resorts & Casinos | |
| MarketCap: 7294.14 Millions | |
| Recent Price: 139.63 Smart Investing & Trading Score: 85 | |
| Day Percent Change: -2.60% Day Change: -3.73 | |
| Week Change: -0.68% Year-to-date Change: 7.8% | |
| RCL Links: Profile News Message Board | |
| Charts:- Daily , Weekly | |
| Add RCL to Watchlist: View: Get Complete RCL Trend Analysis ➞ | |
 | ALLE Allegion plc |
| Sector: Services & Goods | |
| SubSector: Security & Protection Services | |
| MarketCap: 8515.93 Millions | |
| Recent Price: 121.56 Smart Investing & Trading Score: 0 | |
| Day Percent Change: -2.60% Day Change: -3.25 | |
| Week Change: -1.85% Year-to-date Change: -4.1% | |
| ALLE Links: Profile News Message Board | |
| Charts:- Daily , Weekly | |
| Add ALLE to Watchlist: View: Get Complete ALLE Trend Analysis ➞ | |
 | ZG Zillow Group, Inc. |
| Sector: Technology | |
| SubSector: Internet Information Providers | |
| MarketCap: 6536.7 Millions | |
| Recent Price: 41.99 Smart Investing & Trading Score: 28 | |
| Day Percent Change: -2.60% Day Change: -1.12 | |
| Week Change: -2.64% Year-to-date Change: -26.0% | |
| ZG Links: Profile News Message Board | |
| Charts:- Daily , Weekly | |
| Add ZG to Watchlist: View: Get Complete ZG Trend Analysis ➞ | |
 | CFLT Confluent, Inc. |
| Sector: Technology | |
| SubSector: Software - Infrastructure | |
| MarketCap: 10820 Millions | |
| Recent Price: 28.11 Smart Investing & Trading Score: 48 | |
| Day Percent Change: -2.60% Day Change: -0.75 | |
| Week Change: -5.54% Year-to-date Change: 18.4% | |
| CFLT Links: Profile News Message Board | |
| Charts:- Daily , Weekly | |
| Add CFLT to Watchlist: View: Get Complete CFLT Trend Analysis ➞ | |
 | CPNG Coupang, Inc. |
| Sector: Services & Goods | |
| SubSector: Internet Retail | |
| MarketCap: 30840 Millions | |
| Recent Price: 22.50 Smart Investing & Trading Score: 56 | |
| Day Percent Change: -2.60% Day Change: -0.60 | |
| Week Change: -1.79% Year-to-date Change: 38.9% | |
| CPNG Links: Profile News Message Board | |
| Charts:- Daily , Weekly | |
| Add CPNG to Watchlist: View: Get Complete CPNG Trend Analysis ➞ | |
 | OZK Bank OZK |
| Sector: Financials | |
| SubSector: Regional - Southeast Banks | |
| MarketCap: 2518.35 Millions | |
| Recent Price: 44.65 Smart Investing & Trading Score: 61 | |
| Day Percent Change: -2.62% Day Change: -1.20 | |
| Week Change: -2.98% Year-to-date Change: -10.4% | |
| OZK Links: Profile News Message Board | |
| Charts:- Daily , Weekly | |
| Add OZK to Watchlist: View: Get Complete OZK Trend Analysis ➞ | |
 | MHK Mohawk Industries, Inc. |
| Sector: Consumer Staples | |
| SubSector: Home Furnishings & Fixtures | |
| MarketCap: 4682.25 Millions | |
| Recent Price: 115.32 Smart Investing & Trading Score: 90 | |
| Day Percent Change: -2.63% Day Change: -3.11 | |
| Week Change: -0.11% Year-to-date Change: 11.4% | |
| MHK Links: Profile News Message Board | |
| Charts:- Daily , Weekly | |
| Add MHK to Watchlist: View: Get Complete MHK Trend Analysis ➞ | |
 | S SentinelOne, Inc. |
| Sector: Technology | |
| SubSector: Software - Infrastructure | |
| MarketCap: 4420 Millions | |
| Recent Price: 21.13 Smart Investing & Trading Score: 30 | |
| Day Percent Change: -2.63% Day Change: -0.57 | |
| Week Change: -1.99% Year-to-date Change: -23.0% | |
| S Links: Profile News Message Board | |
| Charts:- Daily , Weekly | |
| Add S to Watchlist: View: Get Complete S Trend Analysis ➞ | |
 | LNC Lincoln National Corporation |
| Sector: Financials | |
| SubSector: Life Insurance | |
| MarketCap: 4545.26 Millions | |
| Recent Price: 27.27 Smart Investing & Trading Score: 33 | |
| Day Percent Change: -2.64% Day Change: -0.74 | |
| Week Change: -1.94% Year-to-date Change: 1.1% | |
| LNC Links: Profile News Message Board | |
| Charts:- Daily , Weekly | |
| Add LNC to Watchlist: View: Get Complete LNC Trend Analysis ➞ | |
 | CNXC Concentrix Corporation |
| Sector: Technology | |
| SubSector: Information Technology Services | |
| MarketCap: 51987 Millions | |
| Recent Price: 54.64 Smart Investing & Trading Score: 65 | |
| Day Percent Change: -2.65% Day Change: -1.49 | |
| Week Change: -0.67% Year-to-date Change: -44.4% | |
| CNXC Links: Profile News Message Board | |
| Charts:- Daily , Weekly | |
| Add CNXC to Watchlist: View: Get Complete CNXC Trend Analysis ➞ | |
 | BIO Bio-Rad Laboratories, Inc. |
| Sector: Health Care | |
| SubSector: Medical Laboratories & Research | |
| MarketCap: 10660 Millions | |
| Recent Price: 269.75 Smart Investing & Trading Score: 10 | |
| Day Percent Change: -2.66% Day Change: -7.36 | |
| Week Change: -2.24% Year-to-date Change: -16.5% | |
| BIO Links: Profile News Message Board | |
| Charts:- Daily , Weekly | |
| Add BIO to Watchlist: View: Get Complete BIO Trend Analysis ➞ | |
 | LAD Lithia Motors, Inc. |
| Sector: Services & Goods | |
| SubSector: Auto Dealerships | |
| MarketCap: 1727.21 Millions | |
| Recent Price: 254.38 Smart Investing & Trading Score: 35 | |
| Day Percent Change: -2.66% Day Change: -6.95 | |
| Week Change: -3.17% Year-to-date Change: -22.8% | |
| LAD Links: Profile News Message Board | |
| Charts:- Daily , Weekly | |
| Add LAD to Watchlist: View: Get Complete LAD Trend Analysis ➞ | |
 | GLOB Globant S.A. |
| Sector: Technology | |
| SubSector: Information Technology Services | |
| MarketCap: 2976.88 Millions | |
| Recent Price: 178.59 Smart Investing & Trading Score: 28 | |
| Day Percent Change: -2.67% Day Change: -4.90 | |
| Week Change: -1.24% Year-to-date Change: -25.0% | |
| GLOB Links: Profile News Message Board | |
| Charts:- Daily , Weekly | |
| Add GLOB to Watchlist: View: Get Complete GLOB Trend Analysis ➞ | |
 | SPOT Spotify Technology S.A. |
| Sector: Services & Goods | |
| SubSector: Broadcasting - Radio | |
| MarketCap: 24379.5 Millions | |
| Recent Price: 280.44 Smart Investing & Trading Score: 61 | |
| Day Percent Change: -2.67% Day Change: -7.69 | |
| Week Change: -3.16% Year-to-date Change: 49.2% | |
| SPOT Links: Profile News Message Board | |
| Charts:- Daily , Weekly | |
| Add SPOT to Watchlist: View: Get Complete SPOT Trend Analysis ➞ | |
 | TRGP Targa Resources Corp. |
| Sector: Energy | |
| SubSector: Oil & Gas Pipelines | |
| MarketCap: 2210.65 Millions | |
| Recent Price: 114.06 Smart Investing & Trading Score: 76 | |
| Day Percent Change: -2.68% Day Change: -3.14 | |
| Week Change: -2.4% Year-to-date Change: 31.3% | |
| TRGP Links: Profile News Message Board | |
| Charts:- Daily , Weekly | |
| Add TRGP to Watchlist: View: Get Complete TRGP Trend Analysis ➞ | |
 | PAYC Paycom Software, Inc. |
| Sector: Technology | |
| SubSector: Application Software | |
| MarketCap: 13041.6 Millions | |
| Recent Price: 187.98 Smart Investing & Trading Score: 80 | |
| Day Percent Change: -2.70% Day Change: -5.21 | |
| Week Change: -0.48% Year-to-date Change: -9.1% | |
| PAYC Links: Profile News Message Board | |
| Charts:- Daily , Weekly | |
| Add PAYC to Watchlist: View: Get Complete PAYC Trend Analysis ➞ | |
 | IAC IAC/InterActiveCorp |
| Sector: Technology | |
| SubSector: Internet Information Providers | |
| MarketCap: 12561.2 Millions | |
| Recent Price: 47.59 Smart Investing & Trading Score: 50 | |
| Day Percent Change: -2.70% Day Change: -1.32 | |
| Week Change: -2.12% Year-to-date Change: -9.1% | |
| IAC Links: Profile News Message Board | |
| Charts:- Daily , Weekly | |
| Add IAC to Watchlist: View: Get Complete IAC Trend Analysis ➞ | |
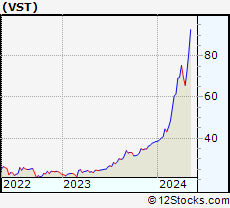 | VST Vistra Energy Corp. |
| Sector: Utilities | |
| SubSector: Electric Utilities | |
| MarketCap: 8396.44 Millions | |
| Recent Price: 75.84 Smart Investing & Trading Score: 95 | |
| Day Percent Change: -2.72% Day Change: -2.12 | |
| Week Change: 4.32% Year-to-date Change: 96.9% | |
| VST Links: Profile News Message Board | |
| Charts:- Daily , Weekly | |
| Add VST to Watchlist: View: Get Complete VST Trend Analysis ➞ | |
 | DDOG Datadog, Inc. |
| Sector: Technology | |
| SubSector: Application Software | |
| MarketCap: 10653.2 Millions | |
| Recent Price: 125.56 Smart Investing & Trading Score: 81 | |
| Day Percent Change: -2.72% Day Change: -3.51 | |
| Week Change: -4.48% Year-to-date Change: 3.4% | |
| DDOG Links: Profile News Message Board | |
| Charts:- Daily , Weekly | |
| Add DDOG to Watchlist: View: Get Complete DDOG Trend Analysis ➞ | |
 | PHM PulteGroup, Inc. |
| Sector: Industrials | |
| SubSector: Residential Construction | |
| MarketCap: 6186.46 Millions | |
| Recent Price: 111.42 Smart Investing & Trading Score: 68 | |
| Day Percent Change: -2.74% Day Change: -3.14 | |
| Week Change: -2.09% Year-to-date Change: 7.9% | |
| PHM Links: Profile News Message Board | |
| Charts:- Daily , Weekly | |
| Add PHM to Watchlist: View: Get Complete PHM Trend Analysis ➞ | |
 | RBLX Roblox Corporation |
| Sector: Services & Goods | |
| SubSector: Electronic Gaming & Multimedia | |
| MarketCap: 25420 Millions | |
| Recent Price: 35.56 Smart Investing & Trading Score: 35 | |
| Day Percent Change: -2.74% Day Change: -1.00 | |
| Week Change: -1.25% Year-to-date Change: -22.9% | |
| RBLX Links: Profile News Message Board | |
| Charts:- Daily , Weekly | |
| Add RBLX to Watchlist: View: Get Complete RBLX Trend Analysis ➞ | |
| For tabular summary view of above stock list: Summary View ➞ 0 - 25 , 25 - 50 , 50 - 75 , 75 - 100 , 100 - 125 , 125 - 150 , 150 - 175 , 175 - 200 , 200 - 225 , 225 - 250 , 250 - 275 , 275 - 300 , 300 - 325 , 325 - 350 , 350 - 375 , 375 - 400 , 400 - 425 , 425 - 450 , 450 - 475 , 475 - 500 , 500 - 525 , 525 - 550 , 550 - 575 , 575 - 600 , 600 - 625 , 625 - 650 , 650 - 675 , 675 - 700 , 700 - 725 , 725 - 750 , 750 - 775 | ||
| Click To Change The Sort Order: By Market Cap or Company Size Performance: Year-to-date, Week and Day | |
| Select Chart Type: | ||
|
Best Stocks Today 12Stocks.com |
© 2024 12Stocks.com Terms & Conditions Privacy Contact Us
All Information Provided Only For Education And Not To Be Used For Investing or Trading. See Terms & Conditions


One More Thing ... Get Best Stocks Delivered Daily!
Never Ever Miss A Move With Our Top Ten Stocks Lists
Find Best Stocks In Any Market - Bull or Bear Market
Take A Peek At Our Top Ten Stocks Lists: Daily, Weekly, Year-to-Date & Top Trends
Find Best Stocks In Any Market - Bull or Bear Market
Take A Peek At Our Top Ten Stocks Lists: Daily, Weekly, Year-to-Date & Top Trends
Midcap Stocks With Best Up Trends [0-bearish to 100-bullish]: Tenet [100], Sensata Technologies[100], Leidos [100], Corning [100], Zebra Technologies[100], Timken [100], CAVA [100], Tandem Diabetes[100], Campbell Soup[100], Mosaic [100], Federal Realty[100]
Best Midcap Stocks Year-to-Date:
Vistra Energy[96.88%], AppLovin [77.26%], ShockWave Medical[73.23%], EMCOR [65.79%], CAVA [65.46%], Constellation Energy[58.77%], Wingstop [50%], Antero Resources[49.96%], Spotify [49.24%], Tenet [48.59%], Natera [48.36%] Best Midcap Stocks This Week:
Tenet [16.81%], agilon health[10%], Sensata Technologies[9.52%], Woodward [7.83%], Leidos [7.56%], Tandem Diabetes[7.18%], Corning [6.54%], Maravai LifeSciences[6.49%], Domino s[6.05%], 10x Genomics[6.02%], Zebra Technologies[5.76%] Best Midcap Stocks Daily:
Tenet [13.25%], Woodward [7.48%], agilon health[7.21%], Sensata Technologies[7.13%], Leidos [6.53%], Corning [5.03%], Zebra Technologies[4.78%], Maravai LifeSciences[4.46%], Quidel [3.15%], 10x Genomics[2.99%], Timken [2.91%]