
 Login Sign Up


| |||||
 |  | ||||

| 12Stocks.com Market Intelligence |
Best MidCap Stocks
|
| In a hurry? Mid Cap Stocks Lists: Performance Trends Table, Stock Charts
Sort midcap stocks: Daily, Weekly, Year-to-Date, Market Cap & Trends. Filter midcap stocks list by sector: Show all, Tech, Finance, Energy, Staples, Retail, Industrial, Materials, Utilities and HealthCare Filter midcap stocks list by size:All MidCap Large Mid-Range Small |
| 12Stocks.com Mid Cap Stocks Performances & Trends Daily | |||||||||
|
|  The overall Smart Investing & Trading Score is 45 (0-bearish to 100-bullish) which puts Mid Cap index in short term neutral trend. The Smart Investing & Trading Score from previous trading session is 38 and hence an improvement of trend.
| ||||||||
Here are the Smart Investing & Trading Scores of the most requested mid cap stocks at 12Stocks.com (click stock name for detailed review):
|


| 12Stocks.com: Top Performing Mid Cap Index Stocks | ||||||||||||||||||||||||||||||||||||||||||||||||
 The top performing Mid Cap Index stocks year to date are
Now, more recently, over last week, the top performing Mid Cap Index stocks on the move are


|
||||||||||||||||||||||||||||||||||||||||||||||||
| 12Stocks.com: Investing in Midcap Index with Stocks | |
|
The following table helps investors and traders sort through current performance and trends (as measured by Smart Investing & Trading Score) of various
stocks in the Midcap Index. Quick View: Move mouse or cursor over stock symbol (ticker) to view short-term technical chart and over stock name to view long term chart. Click on  to add stock symbol to your watchlist and to add stock symbol to your watchlist and  to view watchlist. Click on any ticker or stock name for detailed market intelligence report for that stock. to view watchlist. Click on any ticker or stock name for detailed market intelligence report for that stock. |
12Stocks.com Performance of Stocks in Midcap Index
| Ticker | Stock Name | Watchlist | Category | Recent Price | Smart Investing & Trading Score | Change % | YTD Change% |
| PLTK | Playtika Holding |   | Services & Goods | 7.53 | 100 | 3.72 | -12.70% |
| VOYA | Voya Financial | | Financials | 70.55 | 100 | 3.51 | -3.30% |
| ESTC | Elastic N.V | | Technology | 105.75 | 37 | 3.45 | -6.17% |
| WAL | Western Alliance | | Financials | 58.77 | 55 | 3.41 | -10.67% |
| WOOF | Petco Health | | Services & Goods | 1.55 | 35 | 3.33 | -50.95% |
| EXR | Extra Space | | Financials | 138.70 | 59 | 3.29 | -13.49% |
| THC | Tenet | | Health Care | 115.95 | 100 | 3.26 | 53.43% |
| HXL | Hexcel | | Industrials | 66.29 | 57 | 3.24 | -10.12% |
| SRPT | Sarepta | | Health Care | 130.76 | 67 | 3.24 | 35.61% |
| BMRN | BioMarin Pharmaceutical | | Health Care | 83.30 | 42 | 3.15 | -13.61% |
| ZI | ZoomInfo Technologies | | Technology | 16.35 | 60 | 3.09 | -11.57% |
| MKTX | MarketAxess | | Financials | 206.24 | 52 | 3.07 | -29.58% |
| SIRI | Sirius XM | | Services & Goods | 3.03 | 35 | 3.06 | -44.61% |
| TTD | Trade Desk | | Technology | 85.38 | 32 | 3.05 | 18.64% |
| NCNO | nCino | | Technology | 30.04 | 38 | 3.00 | -10.69% |
| MRVI | Maravai LifeSciences | | Health Care | 8.44 | 80 | 2.93 | 28.85% |
| ZION | Zions Ban | | Financials | 41.83 | 100 | 2.57 | -4.65% |
| WTM | White Mountains | | Financials | 1823.74 | 95 | 2.56 | 21.18% |
| ROKU | Roku | | Technology | 59.11 | 43 | 2.51 | -35.51% |
| MEDP | Medpace | | Health Care | 398.04 | 0 | 2.49 | 29.85% |
| LBRDK | Liberty Broadband | | Services & Goods | 50.94 | 59 | 2.43 | -36.79% |
| ACGL | Arch Capital | | Financials | 95.77 | 100 | 2.38 | 28.95% |
| IT | Gartner | | Technology | 422.39 | 0 | 2.38 | -6.37% |
| LSXMK | Liberty SiriusXM | | Services & Goods | 24.63 | 5 | 2.37 | -14.42% |
| LBRDA | Liberty Broadband | | Technology | 51.30 | 47 | 2.33 | -36.38% |
| For chart view version of above stock list: Chart View ➞ 0 - 25 , 25 - 50 , 50 - 75 , 75 - 100 , 100 - 125 , 125 - 150 , 150 - 175 , 175 - 200 , 200 - 225 , 225 - 250 , 250 - 275 , 275 - 300 , 300 - 325 , 325 - 350 , 350 - 375 , 375 - 400 , 400 - 425 , 425 - 450 , 450 - 475 , 475 - 500 , 500 - 525 , 525 - 550 , 550 - 575 , 575 - 600 , 600 - 625 , 625 - 650 , 650 - 675 , 675 - 700 , 700 - 725 , 725 - 750 , 750 - 775 | ||
 | Click To Change The Sort Order: By Market Cap or Company Size Performance: Year-to-date, Week and Day |  |
|
Get the most comprehensive stock market coverage daily at 12Stocks.com ➞ Best Stocks Today ➞ Best Stocks Weekly ➞ Best Stocks Year-to-Date ➞ Best Stocks Trends ➞  Best Stocks Today 12Stocks.com Best Nasdaq Stocks ➞ Best S&P 500 Stocks ➞ Best Tech Stocks ➞ Best Biotech Stocks ➞ |
| Detailed Overview of Midcap Stocks |
| Midcap Technical Overview, Leaders & Laggards, Top Midcap ETF Funds & Detailed Midcap Stocks List, Charts, Trends & More |
| Midcap: Technical Analysis, Trends & YTD Performance | |
| MidCap segment as represented by
MDY, an exchange-traded fund [ETF], holds basket of about four hundred midcap stocks from across all major sectors of the US stock market. The midcap index (contains stocks like Green Mountain Coffee Roasters and Tractor Supply Company) is up by 3.12% and is currently underperforming the overall market by -1.42% year-to-date. Below is a quick view of technical charts and trends: | |
 MDY Weekly Chart |
|
| Long Term Trend: Good | |
| Medium Term Trend: Not Good | |
 MDY Daily Chart |
|
| Short Term Trend: Very Good | |
| Overall Trend Score: 45 | |
| YTD Performance: 3.12% | |
| **Trend Scores & Views Are Only For Educational Purposes And Not For Investing | |
| 12Stocks.com: Investing in Midcap Index using Exchange Traded Funds | |
|
The following table shows list of key exchange traded funds (ETF) that
help investors track Midcap index. The following list also includes leveraged ETF funds that track twice or thrice the daily returns of Midcap indices. Short or inverse ETF funds move in the opposite direction to the index they track and are useful during market pullbacks or during bear markets. Quick View: Move mouse or cursor over ETF symbol (ticker) to view short-term technical chart and over ETF name to view long term chart. Click on ticker or stock name for detailed view. Click on to add stock symbol to your watchlist and to view watchlist. |
12Stocks.com List of ETFs that track Midcap Index
| Ticker | ETF Name | Watchlist | Recent Price | Smart Investing & Trading Score | Change % | Week % | Year-to-date % |
| IJH | iShares Core S&P Mid-Cap | | 57.19 | 7 | 0.11 | -1.09 | 3.18% |
| MDY | SPDR S&P MidCap 400 ETF | | 523.21 | 45 | 0.09 | -1.17 | 3.12% |
| IWR | iShares Russell Mid-Cap | | 79.53 | 7 | -0.11 | -1.23 | 2.32% |
| IWP | iShares Russell Mid-Cap Growth | | 107.52 | 7 | 0.07 | -1.34 | 2.92% |
| IWS | iShares Russell Mid-Cap Value | | 118.71 | 7 | -0.13 | -1.07 | 2.08% |
| IJK | iShares S&P Mid-Cap 400 Growth | | 85.88 | 7 | 0.05 | -1.29 | 8.41% |
| IJJ | iShares S&P Mid-Cap 400 Value | | 111.45 | 15 | 0.35 | -0.7 | -2.27% |
| XMLV | PowerShares S&P MidCap Low Volatil ETF | | 54.86 | 33 | 0.77 | 0.38 | 3.16% |
| MVV | ProShares Ultra MidCap400 | | 61.31 | 17 | 2.37 | -0.2 | 5.91% |
| SMDD | ProShares UltraPro Short MidCap400 | | 12.29 | 88 | 0.66 | 3.89 | -8.72% |
| UMDD | ProShares UltraPro MidCap400 | | 23.07 | 0 | -0.82 | -3.71 | 3.36% |
| MZZ | ProShares UltraShort MidCap400 | | 11.80 | 46 | -0.17 | 1.03 | -6.13% |
| MYY | ProShares Short MidCap400 | | 20.99 | 70 | 0.38 | 0.96 | -2.17% |
| 12Stocks.com: Charts, Trends, Fundamental Data and Performances of MidCap Stocks | |
|
We now take in-depth look at all MidCap stocks including charts, multi-period performances and overall trends (as measured by Smart Investing & Trading Score). One can sort MidCap stocks (click link to choose) by Daily, Weekly and by Year-to-Date performances. Also, one can sort by size of the company or by market capitalization. |
| Select Your Default Chart Type: | |||||
| |||||
| Click on stock symbol or name for detailed view. Click on to add stock symbol to your watchlist and to view watchlist. Quick View: Move mouse or cursor over "Daily" to quickly view daily technical stock chart and over "Weekly" to view weekly technical stock chart. | |||||

 | PLTK Playtika Holding Corp. |
| Sector: Services & Goods | |
| SubSector: Electronic Gaming & Multimedia | |
| MarketCap: 4260 Millions | |
| Recent Price: 7.53 Smart Investing & Trading Score: 100 | |
| Day Percent Change: 3.72% Day Change: 0.27 | |
| Week Change: 5.31% Year-to-date Change: -12.7% | |
| PLTK Links: Profile News Message Board | |
| Charts:- Daily , Weekly | |
| Add PLTK to Watchlist: View: Get Complete PLTK Trend Analysis ➞ | |
 | VOYA Voya Financial, Inc. |
| Sector: Financials | |
| SubSector: Asset Management | |
| MarketCap: 4771.23 Millions | |
| Recent Price: 70.55 Smart Investing & Trading Score: 100 | |
| Day Percent Change: 3.51% Day Change: 2.39 | |
| Week Change: 3.22% Year-to-date Change: -3.3% | |
| VOYA Links: Profile News Message Board | |
| Charts:- Daily , Weekly | |
| Add VOYA to Watchlist: View: Get Complete VOYA Trend Analysis ➞ | |
 | ESTC Elastic N.V. |
| Sector: Technology | |
| SubSector: Application Software | |
| MarketCap: 4420.92 Millions | |
| Recent Price: 105.75 Smart Investing & Trading Score: 37 | |
| Day Percent Change: 3.45% Day Change: 3.53 | |
| Week Change: -1.56% Year-to-date Change: -6.2% | |
| ESTC Links: Profile News Message Board | |
| Charts:- Daily , Weekly | |
| Add ESTC to Watchlist: View: Get Complete ESTC Trend Analysis ➞ | |
 | WAL Western Alliance Bancorporation |
| Sector: Financials | |
| SubSector: Regional - Pacific Banks | |
| MarketCap: 2980.09 Millions | |
| Recent Price: 58.77 Smart Investing & Trading Score: 55 | |
| Day Percent Change: 3.41% Day Change: 1.94 | |
| Week Change: 0.15% Year-to-date Change: -10.7% | |
| WAL Links: Profile News Message Board | |
| Charts:- Daily , Weekly | |
| Add WAL to Watchlist: View: Get Complete WAL Trend Analysis ➞ | |
 | WOOF Petco Health and Wellness Company, Inc. |
| Sector: Services & Goods | |
| SubSector: Specialty Retail | |
| MarketCap: 2030 Millions | |
| Recent Price: 1.55 Smart Investing & Trading Score: 35 | |
| Day Percent Change: 3.33% Day Change: 0.05 | |
| Week Change: 2.65% Year-to-date Change: -51.0% | |
| WOOF Links: Profile News Message Board | |
| Charts:- Daily , Weekly | |
| Add WOOF to Watchlist: View: Get Complete WOOF Trend Analysis ➞ | |
 | EXR Extra Space Storage Inc. |
| Sector: Financials | |
| SubSector: REIT - Industrial | |
| MarketCap: 11203.9 Millions | |
| Recent Price: 138.70 Smart Investing & Trading Score: 59 | |
| Day Percent Change: 3.29% Day Change: 4.42 | |
| Week Change: 3.92% Year-to-date Change: -13.5% | |
| EXR Links: Profile News Message Board | |
| Charts:- Daily , Weekly | |
| Add EXR to Watchlist: View: Get Complete EXR Trend Analysis ➞ | |
 | THC Tenet Healthcare Corporation |
| Sector: Health Care | |
| SubSector: Hospitals | |
| MarketCap: 1544.46 Millions | |
| Recent Price: 115.95 Smart Investing & Trading Score: 100 | |
| Day Percent Change: 3.26% Day Change: 3.66 | |
| Week Change: 20.62% Year-to-date Change: 53.4% | |
| THC Links: Profile News Message Board | |
| Charts:- Daily , Weekly | |
| Add THC to Watchlist: View: Get Complete THC Trend Analysis ➞ | |
 | HXL Hexcel Corporation |
| Sector: Industrials | |
| SubSector: Aerospace/Defense Products & Services | |
| MarketCap: 2905.51 Millions | |
| Recent Price: 66.29 Smart Investing & Trading Score: 57 | |
| Day Percent Change: 3.24% Day Change: 2.08 | |
| Week Change: 3.32% Year-to-date Change: -10.1% | |
| HXL Links: Profile News Message Board | |
| Charts:- Daily , Weekly | |
| Add HXL to Watchlist: View: Get Complete HXL Trend Analysis ➞ | |
 | SRPT Sarepta Therapeutics, Inc. |
| Sector: Health Care | |
| SubSector: Biotechnology | |
| MarketCap: 7388.05 Millions | |
| Recent Price: 130.76 Smart Investing & Trading Score: 67 | |
| Day Percent Change: 3.24% Day Change: 4.10 | |
| Week Change: 1.55% Year-to-date Change: 35.6% | |
| SRPT Links: Profile News Message Board | |
| Charts:- Daily , Weekly | |
| Add SRPT to Watchlist: View: Get Complete SRPT Trend Analysis ➞ | |
 | BMRN BioMarin Pharmaceutical Inc. |
| Sector: Health Care | |
| SubSector: Biotechnology | |
| MarketCap: 14887.5 Millions | |
| Recent Price: 83.30 Smart Investing & Trading Score: 42 | |
| Day Percent Change: 3.15% Day Change: 2.54 | |
| Week Change: 2.95% Year-to-date Change: -13.6% | |
| BMRN Links: Profile News Message Board | |
| Charts:- Daily , Weekly | |
| Add BMRN to Watchlist: View: Get Complete BMRN Trend Analysis ➞ | |
 | ZI ZoomInfo Technologies Inc. |
| Sector: Technology | |
| SubSector: Software Application | |
| MarketCap: 15937 Millions | |
| Recent Price: 16.35 Smart Investing & Trading Score: 60 | |
| Day Percent Change: 3.09% Day Change: 0.49 | |
| Week Change: -0.12% Year-to-date Change: -11.6% | |
| ZI Links: Profile News Message Board | |
| Charts:- Daily , Weekly | |
| Add ZI to Watchlist: View: Get Complete ZI Trend Analysis ➞ | |
 | MKTX MarketAxess Holdings Inc. |
| Sector: Financials | |
| SubSector: Investment Brokerage - National | |
| MarketCap: 12431.5 Millions | |
| Recent Price: 206.24 Smart Investing & Trading Score: 52 | |
| Day Percent Change: 3.07% Day Change: 6.15 | |
| Week Change: 2.2% Year-to-date Change: -29.6% | |
| MKTX Links: Profile News Message Board | |
| Charts:- Daily , Weekly | |
| Add MKTX to Watchlist: View: Get Complete MKTX Trend Analysis ➞ | |
 | SIRI Sirius XM Holdings Inc. |
| Sector: Services & Goods | |
| SubSector: Broadcasting - Radio | |
| MarketCap: 21325.5 Millions | |
| Recent Price: 3.03 Smart Investing & Trading Score: 35 | |
| Day Percent Change: 3.06% Day Change: 0.09 | |
| Week Change: 0.33% Year-to-date Change: -44.6% | |
| SIRI Links: Profile News Message Board | |
| Charts:- Daily , Weekly | |
| Add SIRI to Watchlist: View: Get Complete SIRI Trend Analysis ➞ | |
 | TTD The Trade Desk, Inc. |
| Sector: Technology | |
| SubSector: Application Software | |
| MarketCap: 9006.92 Millions | |
| Recent Price: 85.38 Smart Investing & Trading Score: 32 | |
| Day Percent Change: 3.05% Day Change: 2.53 | |
| Week Change: 0.76% Year-to-date Change: 18.6% | |
| TTD Links: Profile News Message Board | |
| Charts:- Daily , Weekly | |
| Add TTD to Watchlist: View: Get Complete TTD Trend Analysis ➞ | |
 | NCNO nCino, Inc. |
| Sector: Technology | |
| SubSector: Software Application | |
| MarketCap: 74187 Millions | |
| Recent Price: 30.04 Smart Investing & Trading Score: 38 | |
| Day Percent Change: 3.00% Day Change: 0.88 | |
| Week Change: 1.78% Year-to-date Change: -10.7% | |
| NCNO Links: Profile News Message Board | |
| Charts:- Daily , Weekly | |
| Add NCNO to Watchlist: View: Get Complete NCNO Trend Analysis ➞ | |
 | MRVI Maravai LifeSciences Holdings, Inc. |
| Sector: Health Care | |
| SubSector: Biotechnology | |
| MarketCap: 67887 Millions | |
| Recent Price: 8.44 Smart Investing & Trading Score: 80 | |
| Day Percent Change: 2.93% Day Change: 0.24 | |
| Week Change: 9.61% Year-to-date Change: 28.9% | |
| MRVI Links: Profile News Message Board | |
| Charts:- Daily , Weekly | |
| Add MRVI to Watchlist: View: Get Complete MRVI Trend Analysis ➞ | |
 | ZION Zions Bancorporation, National Association |
| Sector: Financials | |
| SubSector: Regional - Pacific Banks | |
| MarketCap: 4577.89 Millions | |
| Recent Price: 41.83 Smart Investing & Trading Score: 100 | |
| Day Percent Change: 2.57% Day Change: 1.05 | |
| Week Change: 0.17% Year-to-date Change: -4.7% | |
| ZION Links: Profile News Message Board | |
| Charts:- Daily , Weekly | |
| Add ZION to Watchlist: View: Get Complete ZION Trend Analysis ➞ | |
 | WTM White Mountains Insurance Group, Ltd. |
| Sector: Financials | |
| SubSector: Property & Casualty Insurance | |
| MarketCap: 2502.62 Millions | |
| Recent Price: 1823.74 Smart Investing & Trading Score: 95 | |
| Day Percent Change: 2.56% Day Change: 45.60 | |
| Week Change: 3.13% Year-to-date Change: 21.2% | |
| WTM Links: Profile News Message Board | |
| Charts:- Daily , Weekly | |
| Add WTM to Watchlist: View: Get Complete WTM Trend Analysis ➞ | |
 | ROKU Roku, Inc. |
| Sector: Technology | |
| SubSector: CATV Systems | |
| MarketCap: 10503.6 Millions | |
| Recent Price: 59.11 Smart Investing & Trading Score: 43 | |
| Day Percent Change: 2.51% Day Change: 1.45 | |
| Week Change: 4.9% Year-to-date Change: -35.5% | |
| ROKU Links: Profile News Message Board | |
| Charts:- Daily , Weekly | |
| Add ROKU to Watchlist: View: Get Complete ROKU Trend Analysis ➞ | |
 | MEDP Medpace Holdings, Inc. |
| Sector: Health Care | |
| SubSector: Medical Laboratories & Research | |
| MarketCap: 2888.7 Millions | |
| Recent Price: 398.04 Smart Investing & Trading Score: 0 | |
| Day Percent Change: 2.49% Day Change: 9.69 | |
| Week Change: 0.53% Year-to-date Change: 29.9% | |
| MEDP Links: Profile News Message Board | |
| Charts:- Daily , Weekly | |
| Add MEDP to Watchlist: View: Get Complete MEDP Trend Analysis ➞ | |
 | LBRDK Liberty Broadband Corporation |
| Sector: Services & Goods | |
| SubSector: Broadcasting - TV | |
| MarketCap: 13847.3 Millions | |
| Recent Price: 50.94 Smart Investing & Trading Score: 59 | |
| Day Percent Change: 2.43% Day Change: 1.21 | |
| Week Change: 3.43% Year-to-date Change: -36.8% | |
| LBRDK Links: Profile News Message Board | |
| Charts:- Daily , Weekly | |
| Add LBRDK to Watchlist: View: Get Complete LBRDK Trend Analysis ➞ | |
 | ACGL Arch Capital Group Ltd. |
| Sector: Financials | |
| SubSector: Property & Casualty Insurance | |
| MarketCap: 12350.9 Millions | |
| Recent Price: 95.77 Smart Investing & Trading Score: 100 | |
| Day Percent Change: 2.38% Day Change: 2.23 | |
| Week Change: 5.36% Year-to-date Change: 29.0% | |
| ACGL Links: Profile News Message Board | |
| Charts:- Daily , Weekly | |
| Add ACGL to Watchlist: View: Get Complete ACGL Trend Analysis ➞ | |
 | IT Gartner, Inc. |
| Sector: Technology | |
| SubSector: Information Technology Services | |
| MarketCap: 7767.98 Millions | |
| Recent Price: 422.39 Smart Investing & Trading Score: 0 | |
| Day Percent Change: 2.38% Day Change: 9.80 | |
| Week Change: -5.88% Year-to-date Change: -6.4% | |
| IT Links: Profile News Message Board | |
| Charts:- Daily , Weekly | |
| Add IT to Watchlist: View: Get Complete IT Trend Analysis ➞ | |
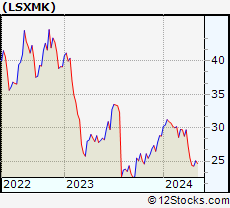 | LSXMK The Liberty SiriusXM Group |
| Sector: Services & Goods | |
| SubSector: Broadcasting - Radio | |
| MarketCap: 5183.95 Millions | |
| Recent Price: 24.63 Smart Investing & Trading Score: 5 | |
| Day Percent Change: 2.37% Day Change: 0.57 | |
| Week Change: 1.48% Year-to-date Change: -14.4% | |
| LSXMK Links: Profile News Message Board | |
| Charts:- Daily , Weekly | |
| Add LSXMK to Watchlist: View: Get Complete LSXMK Trend Analysis ➞ | |
 | LBRDA Liberty Broadband Corporation |
| Sector: Technology | |
| SubSector: CATV Systems | |
| MarketCap: 17001.5 Millions | |
| Recent Price: 51.30 Smart Investing & Trading Score: 47 | |
| Day Percent Change: 2.33% Day Change: 1.17 | |
| Week Change: 3.51% Year-to-date Change: -36.4% | |
| LBRDA Links: Profile News Message Board | |
| Charts:- Daily , Weekly | |
| Add LBRDA to Watchlist: View: Get Complete LBRDA Trend Analysis ➞ | |
| For tabular summary view of above stock list: Summary View ➞ 0 - 25 , 25 - 50 , 50 - 75 , 75 - 100 , 100 - 125 , 125 - 150 , 150 - 175 , 175 - 200 , 200 - 225 , 225 - 250 , 250 - 275 , 275 - 300 , 300 - 325 , 325 - 350 , 350 - 375 , 375 - 400 , 400 - 425 , 425 - 450 , 450 - 475 , 475 - 500 , 500 - 525 , 525 - 550 , 550 - 575 , 575 - 600 , 600 - 625 , 625 - 650 , 650 - 675 , 675 - 700 , 700 - 725 , 725 - 750 , 750 - 775 | ||
| Click To Change The Sort Order: By Market Cap or Company Size Performance: Year-to-date, Week and Day | |
| Select Chart Type: | ||
|
Best Stocks Today 12Stocks.com |
© 2024 12Stocks.com Terms & Conditions Privacy Contact Us
All Information Provided Only For Education And Not To Be Used For Investing or Trading. See Terms & Conditions


One More Thing ... Get Best Stocks Delivered Daily!
Never Ever Miss A Move With Our Top Ten Stocks Lists
Find Best Stocks In Any Market - Bull or Bear Market
Take A Peek At Our Top Ten Stocks Lists: Daily, Weekly, Year-to-Date & Top Trends
Find Best Stocks In Any Market - Bull or Bear Market
Take A Peek At Our Top Ten Stocks Lists: Daily, Weekly, Year-to-Date & Top Trends
Midcap Stocks With Best Up Trends [0-bearish to 100-bullish]: Bio-Techne [100], Garmin [100], Brookfield Renewable[100], Amcor [100], United [100], Axalta Coating[100], DuPont de[100], Clean Harbors[100], Playtika Holding[100], Voya Financial[100], Tenet [100]
Best Midcap Stocks Year-to-Date:
Vistra Energy[99.53%], AppLovin [76.53%], ShockWave Medical[73%], EMCOR [64.9%], Constellation Energy[57.66%], CAVA [56.42%], Tenet [53.43%], Spotify [51.42%], Natera [50.27%], Wingstop [49.64%], Antero Resources[44%] Best Midcap Stocks This Week:
Tenet [20.62%], Pinterest [19.2%], Bio-Techne [14.64%], New York[14.48%], Garmin [13.92%], Sensata Technologies[11.46%], Brookfield Renewable[10.3%], Woodward [10.09%], Maravai LifeSciences[9.61%], Axalta Coating[9.58%], Amcor [9.25%] Best Midcap Stocks Daily:
New York[28.30%], Pinterest [21.02%], Bio-Techne [16.18%], Garmin [13.12%], Brookfield Renewable[10.63%], Amcor [9.62%], United [8.87%], Axalta Coating[8.81%], DuPont de[8.01%], Verisk Analytics[6.87%], Clean Harbors[6.81%]