
 Login Sign Up


| |||||
 |  | ||||

| 12Stocks.com Market Intelligence |
Best MidCap Stocks
|
| In a hurry? Mid Cap Stocks Lists: Performance Trends Table, Stock Charts
Sort midcap stocks: Daily, Weekly, Year-to-Date, Market Cap & Trends. Filter midcap stocks list by sector: Show all, Tech, Finance, Energy, Staples, Retail, Industrial, Materials, Utilities and HealthCare Filter midcap stocks list by size:All MidCap Large Mid-Range Small |
| 12Stocks.com Mid Cap Stocks Performances & Trends Daily | |||||||||
|
|  The overall Smart Investing & Trading Score is 44 (0-bearish to 100-bullish) which puts Mid Cap index in short term neutral trend. The Smart Investing & Trading Score from previous trading session is 36 and hence an improvement of trend.
| ||||||||
Here are the Smart Investing & Trading Scores of the most requested mid cap stocks at 12Stocks.com (click stock name for detailed review):
|


| 12Stocks.com: Top Performing Mid Cap Index Stocks | ||||||||||||||||||||||||||||||||||||||||||||||||
 The top performing Mid Cap Index stocks year to date are
Now, more recently, over last week, the top performing Mid Cap Index stocks on the move are


|
||||||||||||||||||||||||||||||||||||||||||||||||
| 12Stocks.com: Investing in Midcap Index with Stocks | |
|
The following table helps investors and traders sort through current performance and trends (as measured by Smart Investing & Trading Score) of various
stocks in the Midcap Index. Quick View: Move mouse or cursor over stock symbol (ticker) to view short-term technical chart and over stock name to view long term chart. Click on  to add stock symbol to your watchlist and to add stock symbol to your watchlist and  to view watchlist. Click on any ticker or stock name for detailed market intelligence report for that stock. to view watchlist. Click on any ticker or stock name for detailed market intelligence report for that stock. |
12Stocks.com Performance of Stocks in Midcap Index
| Ticker | Stock Name | Watchlist | Category | Recent Price | Smart Investing & Trading Score | Change % | YTD Change% |
| MRO | Marathon Oil |   | Energy | 27.86 | 46 | 1.70 | 15.34% |
| UDR | UDR | | Financials | 36.39 | 55 | 1.70 | -4.96% |
| ARMK | Aramark | | Services & Goods | 31.73 | 68 | 1.70 | 12.92% |
| BXP | Boston Properties | | Financials | 59.68 | 37 | 1.69 | -14.95% |
| BPOP | Popular | | Financials | 83.21 | 32 | 1.69 | 1.39% |
| SEB | Seaboard | | Industrials | 3185.00 | 28 | 1.69 | -10.79% |
| AAL | American Airlines | | Transports | 14.26 | 54 | 1.68 | 3.75% |
| HES | Hess | | Energy | 154.31 | 83 | 1.67 | 7.04% |
| UAA | Under Armour | | Consumer Staples | 6.72 | 32 | 1.66 | -23.55% |
| CHRW | C.H. Robinson | | Transports | 71.01 | 52 | 1.63 | -17.80% |
| NXST | Nexstar Media | | Services & Goods | 164.60 | 42 | 1.63 | 5.01% |
| CMS | CMS Energy | | Utilities | 59.43 | 68 | 1.62 | 2.34% |
| WEC | WEC Energy | | Utilities | 81.74 | 65 | 1.62 | -2.89% |
| DVN | Devon Energy | | Energy | 52.26 | 76 | 1.61 | 15.36% |
| DBX | Dropbox | | Technology | 23.13 | 17 | 1.60 | -21.56% |
| AFG | American Financial | | Financials | 127.41 | 61 | 1.59 | 7.16% |
| MOS | Mosaic | | Materials | 30.95 | 48 | 1.59 | -13.36% |
| DGX | Quest Diagnostics | | Health Care | 127.90 | 28 | 1.58 | -7.24% |
| FANG | Diamondback Energy | | Energy | 202.76 | 58 | 1.58 | 30.74% |
| FOXA | Fox | | Services & Goods | 31.25 | 60 | 1.58 | 5.34% |
| FNB | F.N.B | | Financials | 12.96 | 17 | 1.57 | -5.88% |
| FAF | First American | | Financials | 56.11 | 17 | 1.57 | -12.93% |
| CPT | Camden Property | | Financials | 96.79 | 68 | 1.57 | -2.52% |
| CFR | Cullen/Frost Bankers | | Financials | 110.80 | 68 | 1.57 | 2.13% |
| RHI | Robert Half | | Services & Goods | 70.65 | 18 | 1.57 | -19.64% |
| For chart view version of above stock list: Chart View ➞ 0 - 25 , 25 - 50 , 50 - 75 , 75 - 100 , 100 - 125 , 125 - 150 , 150 - 175 , 175 - 200 , 200 - 225 , 225 - 250 , 250 - 275 , 275 - 300 , 300 - 325 , 325 - 350 , 350 - 375 , 375 - 400 , 400 - 425 , 425 - 450 , 450 - 475 , 475 - 500 , 500 - 525 , 525 - 550 , 550 - 575 , 575 - 600 , 600 - 625 , 625 - 650 , 650 - 675 , 675 - 700 , 700 - 725 , 725 - 750 | ||
 | Click To Change The Sort Order: By Market Cap or Company Size Performance: Year-to-date, Week and Day |  |
|
Get the most comprehensive stock market coverage daily at 12Stocks.com ➞ Best Stocks Today ➞ Best Stocks Weekly ➞ Best Stocks Year-to-Date ➞ Best Stocks Trends ➞  Best Stocks Today 12Stocks.com Best Nasdaq Stocks ➞ Best S&P 500 Stocks ➞ Best Tech Stocks ➞ Best Biotech Stocks ➞ |
| Detailed Overview of Midcap Stocks |
| Midcap Technical Overview, Leaders & Laggards, Top Midcap ETF Funds & Detailed Midcap Stocks List, Charts, Trends & More |
| Midcap: Technical Analysis, Trends & YTD Performance | |
| MidCap segment as represented by
MDY, an exchange-traded fund [ETF], holds basket of about four hundred midcap stocks from across all major sectors of the US stock market. The midcap index (contains stocks like Green Mountain Coffee Roasters and Tractor Supply Company) is up by 2.26% and is currently underperforming the overall market by -1.82% year-to-date. Below is a quick view of technical charts and trends: | |
 MDY Weekly Chart |
|
| Long Term Trend: Good | |
| Medium Term Trend: Not Good | |
 MDY Daily Chart |
|
| Short Term Trend: Deteriorating | |
| Overall Trend Score: 44 | |
| YTD Performance: 2.26% | |
| **Trend Scores & Views Are Only For Educational Purposes And Not For Investing | |
| 12Stocks.com: Investing in Midcap Index using Exchange Traded Funds | |
|
The following table shows list of key exchange traded funds (ETF) that
help investors track Midcap index. The following list also includes leveraged ETF funds that track twice or thrice the daily returns of Midcap indices. Short or inverse ETF funds move in the opposite direction to the index they track and are useful during market pullbacks or during bear markets. Quick View: Move mouse or cursor over ETF symbol (ticker) to view short-term technical chart and over ETF name to view long term chart. Click on ticker or stock name for detailed view. Click on to add stock symbol to your watchlist and to view watchlist. |
12Stocks.com List of ETFs that track Midcap Index
| Ticker | ETF Name | Watchlist | Recent Price | Smart Investing & Trading Score | Change % | Week % | Year-to-date % |
| MDY | SPDR S&P MidCap 400 ETF | | 518.85 | 44 | 0.44 | -2.09 | 2.26% |
| SMDD | ProShares UltraPro Short MidCap400 | | 12.52 | 59 | -1.33 | 6.56 | -7% |
| UMDD | ProShares UltraPro MidCap400 | | 22.57 | 36 | 1.20 | -6.61 | 1.14% |
| MZZ | ProShares UltraShort MidCap400 | | 12.26 | 34 | 0.25 | 5.69 | -2.47% |
| MYY | ProShares Short MidCap400 | | 21.27 | 69 | 0.03 | 2.72 | -0.88% |
| 12Stocks.com: Charts, Trends, Fundamental Data and Performances of MidCap Stocks | |
|
We now take in-depth look at all MidCap stocks including charts, multi-period performances and overall trends (as measured by Smart Investing & Trading Score). One can sort MidCap stocks (click link to choose) by Daily, Weekly and by Year-to-Date performances. Also, one can sort by size of the company or by market capitalization. |
| Select Your Default Chart Type: | |||||
| |||||
| Click on stock symbol or name for detailed view. Click on to add stock symbol to your watchlist and to view watchlist. Quick View: Move mouse or cursor over "Daily" to quickly view daily technical stock chart and over "Weekly" to view weekly technical stock chart. | |||||

 | MRO Marathon Oil Corporation |
| Sector: Energy | |
| SubSector: Independent Oil & Gas | |
| MarketCap: 2911.53 Millions | |
| Recent Price: 27.86 Smart Investing & Trading Score: 46 | |
| Day Percent Change: 1.70% Day Change: 0.46 | |
| Week Change: -4.21% Year-to-date Change: 15.3% | |
| MRO Links: Profile News Message Board | |
| Charts:- Daily , Weekly | |
| Add MRO to Watchlist: View: Get Complete MRO Trend Analysis ➞ | |
 | UDR UDR, Inc. |
| Sector: Financials | |
| SubSector: REIT - Residential | |
| MarketCap: 10180.1 Millions | |
| Recent Price: 36.39 Smart Investing & Trading Score: 55 | |
| Day Percent Change: 1.70% Day Change: 0.61 | |
| Week Change: -0.68% Year-to-date Change: -5.0% | |
| UDR Links: Profile News Message Board | |
| Charts:- Daily , Weekly | |
| Add UDR to Watchlist: View: Get Complete UDR Trend Analysis ➞ | |
 | ARMK Aramark |
| Sector: Services & Goods | |
| SubSector: Specialty Eateries | |
| MarketCap: 5242.27 Millions | |
| Recent Price: 31.73 Smart Investing & Trading Score: 68 | |
| Day Percent Change: 1.70% Day Change: 0.53 | |
| Week Change: 0.44% Year-to-date Change: 12.9% | |
| ARMK Links: Profile News Message Board | |
| Charts:- Daily , Weekly | |
| Add ARMK to Watchlist: View: Get Complete ARMK Trend Analysis ➞ | |
 | BXP Boston Properties, Inc. |
| Sector: Financials | |
| SubSector: REIT - Office | |
| MarketCap: 13788.6 Millions | |
| Recent Price: 59.68 Smart Investing & Trading Score: 37 | |
| Day Percent Change: 1.69% Day Change: 0.99 | |
| Week Change: -1.53% Year-to-date Change: -15.0% | |
| BXP Links: Profile News Message Board | |
| Charts:- Daily , Weekly | |
| Add BXP to Watchlist: View: Get Complete BXP Trend Analysis ➞ | |
 | BPOP Popular, Inc. |
| Sector: Financials | |
| SubSector: Foreign Regional Banks | |
| MarketCap: 2671.99 Millions | |
| Recent Price: 83.21 Smart Investing & Trading Score: 32 | |
| Day Percent Change: 1.69% Day Change: 1.38 | |
| Week Change: 0.56% Year-to-date Change: 1.4% | |
| BPOP Links: Profile News Message Board | |
| Charts:- Daily , Weekly | |
| Add BPOP to Watchlist: View: Get Complete BPOP Trend Analysis ➞ | |
 | SEB Seaboard Corporation |
| Sector: Industrials | |
| SubSector: Conglomerates | |
| MarketCap: 3161.78 Millions | |
| Recent Price: 3185.00 Smart Investing & Trading Score: 28 | |
| Day Percent Change: 1.69% Day Change: 53.01 | |
| Week Change: 2.68% Year-to-date Change: -10.8% | |
| SEB Links: Profile News Message Board | |
| Charts:- Daily , Weekly | |
| Add SEB to Watchlist: View: Get Complete SEB Trend Analysis ➞ | |
 | AAL American Airlines Group Inc. |
| Sector: Transports | |
| SubSector: Major Airlines | |
| MarketCap: 5346.45 Millions | |
| Recent Price: 14.26 Smart Investing & Trading Score: 54 | |
| Day Percent Change: 1.68% Day Change: 0.24 | |
| Week Change: 8.4% Year-to-date Change: 3.8% | |
| AAL Links: Profile News Message Board | |
| Charts:- Daily , Weekly | |
| Add AAL to Watchlist: View: Get Complete AAL Trend Analysis ➞ | |
 | HES Hess Corporation |
| Sector: Energy | |
| SubSector: Independent Oil & Gas | |
| MarketCap: 10465.3 Millions | |
| Recent Price: 154.31 Smart Investing & Trading Score: 83 | |
| Day Percent Change: 1.67% Day Change: 2.53 | |
| Week Change: 0.72% Year-to-date Change: 7.0% | |
| HES Links: Profile News Message Board | |
| Charts:- Daily , Weekly | |
| Add HES to Watchlist: View: Get Complete HES Trend Analysis ➞ | |
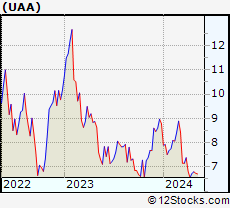 | UAA Under Armour, Inc. |
| Sector: Consumer Staples | |
| SubSector: Textile - Apparel Clothing | |
| MarketCap: 4066.75 Millions | |
| Recent Price: 6.72 Smart Investing & Trading Score: 32 | |
| Day Percent Change: 1.66% Day Change: 0.11 | |
| Week Change: 2.44% Year-to-date Change: -23.6% | |
| UAA Links: Profile News Message Board | |
| Charts:- Daily , Weekly | |
| Add UAA to Watchlist: View: Get Complete UAA Trend Analysis ➞ | |
 | CHRW C.H. Robinson Worldwide, Inc. |
| Sector: Transports | |
| SubSector: Air Delivery & Freight Services | |
| MarketCap: 9194.78 Millions | |
| Recent Price: 71.01 Smart Investing & Trading Score: 52 | |
| Day Percent Change: 1.63% Day Change: 1.14 | |
| Week Change: 0.75% Year-to-date Change: -17.8% | |
| CHRW Links: Profile News Message Board | |
| Charts:- Daily , Weekly | |
| Add CHRW to Watchlist: View: Get Complete CHRW Trend Analysis ➞ | |
 | NXST Nexstar Media Group, Inc. |
| Sector: Services & Goods | |
| SubSector: Broadcasting - TV | |
| MarketCap: 2763.73 Millions | |
| Recent Price: 164.60 Smart Investing & Trading Score: 42 | |
| Day Percent Change: 1.63% Day Change: 2.64 | |
| Week Change: 3.02% Year-to-date Change: 5.0% | |
| NXST Links: Profile News Message Board | |
| Charts:- Daily , Weekly | |
| Add NXST to Watchlist: View: Get Complete NXST Trend Analysis ➞ | |
 | CMS CMS Energy Corporation |
| Sector: Utilities | |
| SubSector: Electric Utilities | |
| MarketCap: 15105.8 Millions | |
| Recent Price: 59.43 Smart Investing & Trading Score: 68 | |
| Day Percent Change: 1.62% Day Change: 0.95 | |
| Week Change: 3.07% Year-to-date Change: 2.3% | |
| CMS Links: Profile News Message Board | |
| Charts:- Daily , Weekly | |
| Add CMS to Watchlist: View: Get Complete CMS Trend Analysis ➞ | |
 | WEC WEC Energy Group, Inc. |
| Sector: Utilities | |
| SubSector: Electric Utilities | |
| MarketCap: 24852 Millions | |
| Recent Price: 81.74 Smart Investing & Trading Score: 65 | |
| Day Percent Change: 1.62% Day Change: 1.30 | |
| Week Change: 3.51% Year-to-date Change: -2.9% | |
| WEC Links: Profile News Message Board | |
| Charts:- Daily , Weekly | |
| Add WEC to Watchlist: View: Get Complete WEC Trend Analysis ➞ | |
 | DVN Devon Energy Corporation |
| Sector: Energy | |
| SubSector: Independent Oil & Gas | |
| MarketCap: 2693.03 Millions | |
| Recent Price: 52.26 Smart Investing & Trading Score: 76 | |
| Day Percent Change: 1.61% Day Change: 0.83 | |
| Week Change: -2.17% Year-to-date Change: 15.4% | |
| DVN Links: Profile News Message Board | |
| Charts:- Daily , Weekly | |
| Add DVN to Watchlist: View: Get Complete DVN Trend Analysis ➞ | |
 | DBX Dropbox, Inc. |
| Sector: Technology | |
| SubSector: Application Software | |
| MarketCap: 7588.32 Millions | |
| Recent Price: 23.13 Smart Investing & Trading Score: 17 | |
| Day Percent Change: 1.60% Day Change: 0.36 | |
| Week Change: 0.59% Year-to-date Change: -21.6% | |
| DBX Links: Profile News Message Board | |
| Charts:- Daily , Weekly | |
| Add DBX to Watchlist: View: Get Complete DBX Trend Analysis ➞ | |
 | AFG American Financial Group, Inc. |
| Sector: Financials | |
| SubSector: Property & Casualty Insurance | |
| MarketCap: 5353.82 Millions | |
| Recent Price: 127.41 Smart Investing & Trading Score: 61 | |
| Day Percent Change: 1.59% Day Change: 2.00 | |
| Week Change: 0.07% Year-to-date Change: 7.2% | |
| AFG Links: Profile News Message Board | |
| Charts:- Daily , Weekly | |
| Add AFG to Watchlist: View: Get Complete AFG Trend Analysis ➞ | |
 | MOS The Mosaic Company |
| Sector: Materials | |
| SubSector: Agricultural Chemicals | |
| MarketCap: 4299.59 Millions | |
| Recent Price: 30.95 Smart Investing & Trading Score: 48 | |
| Day Percent Change: 1.59% Day Change: 0.48 | |
| Week Change: -0.53% Year-to-date Change: -13.4% | |
| MOS Links: Profile News Message Board | |
| Charts:- Daily , Weekly | |
| Add MOS to Watchlist: View: Get Complete MOS Trend Analysis ➞ | |
 | DGX Quest Diagnostics Incorporated |
| Sector: Health Care | |
| SubSector: Medical Laboratories & Research | |
| MarketCap: 11076.1 Millions | |
| Recent Price: 127.90 Smart Investing & Trading Score: 28 | |
| Day Percent Change: 1.58% Day Change: 1.99 | |
| Week Change: -0.49% Year-to-date Change: -7.2% | |
| DGX Links: Profile News Message Board | |
| Charts:- Daily , Weekly | |
| Add DGX to Watchlist: View: Get Complete DGX Trend Analysis ➞ | |
 | FANG Diamondback Energy, Inc. |
| Sector: Energy | |
| SubSector: Independent Oil & Gas | |
| MarketCap: 3009.13 Millions | |
| Recent Price: 202.76 Smart Investing & Trading Score: 58 | |
| Day Percent Change: 1.58% Day Change: 3.16 | |
| Week Change: -2.64% Year-to-date Change: 30.7% | |
| FANG Links: Profile News Message Board | |
| Charts:- Daily , Weekly | |
| Add FANG to Watchlist: View: Get Complete FANG Trend Analysis ➞ | |
 | FOXA Fox Corporation |
| Sector: Services & Goods | |
| SubSector: Entertainment - Diversified | |
| MarketCap: 13440.7 Millions | |
| Recent Price: 31.25 Smart Investing & Trading Score: 60 | |
| Day Percent Change: 1.58% Day Change: 0.48 | |
| Week Change: 1.68% Year-to-date Change: 5.3% | |
| FOXA Links: Profile News Message Board | |
| Charts:- Daily , Weekly | |
| Add FOXA to Watchlist: View: Get Complete FOXA Trend Analysis ➞ | |
 | FNB F.N.B. Corporation |
| Sector: Financials | |
| SubSector: Regional - Southeast Banks | |
| MarketCap: 2445.55 Millions | |
| Recent Price: 12.96 Smart Investing & Trading Score: 17 | |
| Day Percent Change: 1.57% Day Change: 0.20 | |
| Week Change: -0.69% Year-to-date Change: -5.9% | |
| FNB Links: Profile News Message Board | |
| Charts:- Daily , Weekly | |
| Add FNB to Watchlist: View: Get Complete FNB Trend Analysis ➞ | |
 | FAF First American Financial Corporation |
| Sector: Financials | |
| SubSector: Property & Casualty Insurance | |
| MarketCap: 4163.82 Millions | |
| Recent Price: 56.11 Smart Investing & Trading Score: 17 | |
| Day Percent Change: 1.57% Day Change: 0.87 | |
| Week Change: -1.65% Year-to-date Change: -12.9% | |
| FAF Links: Profile News Message Board | |
| Charts:- Daily , Weekly | |
| Add FAF to Watchlist: View: Get Complete FAF Trend Analysis ➞ | |
 | CPT Camden Property Trust |
| Sector: Financials | |
| SubSector: REIT - Residential | |
| MarketCap: 7535.21 Millions | |
| Recent Price: 96.79 Smart Investing & Trading Score: 68 | |
| Day Percent Change: 1.57% Day Change: 1.50 | |
| Week Change: -1.17% Year-to-date Change: -2.5% | |
| CPT Links: Profile News Message Board | |
| Charts:- Daily , Weekly | |
| Add CPT to Watchlist: View: Get Complete CPT Trend Analysis ➞ | |
 | CFR Cullen/Frost Bankers, Inc. |
| Sector: Financials | |
| SubSector: Regional - Southwest Banks | |
| MarketCap: 3536.75 Millions | |
| Recent Price: 110.80 Smart Investing & Trading Score: 68 | |
| Day Percent Change: 1.57% Day Change: 1.71 | |
| Week Change: 2.58% Year-to-date Change: 2.1% | |
| CFR Links: Profile News Message Board | |
| Charts:- Daily , Weekly | |
| Add CFR to Watchlist: View: Get Complete CFR Trend Analysis ➞ | |
 | RHI Robert Half International Inc. |
| Sector: Services & Goods | |
| SubSector: Staffing & Outsourcing Services | |
| MarketCap: 4302 Millions | |
| Recent Price: 70.65 Smart Investing & Trading Score: 18 | |
| Day Percent Change: 1.57% Day Change: 1.09 | |
| Week Change: -1.97% Year-to-date Change: -19.6% | |
| RHI Links: Profile News Message Board | |
| Charts:- Daily , Weekly | |
| Add RHI to Watchlist: View: Get Complete RHI Trend Analysis ➞ | |
| For tabular summary view of above stock list: Summary View ➞ 0 - 25 , 25 - 50 , 50 - 75 , 75 - 100 , 100 - 125 , 125 - 150 , 150 - 175 , 175 - 200 , 200 - 225 , 225 - 250 , 250 - 275 , 275 - 300 , 300 - 325 , 325 - 350 , 350 - 375 , 375 - 400 , 400 - 425 , 425 - 450 , 450 - 475 , 475 - 500 , 500 - 525 , 525 - 550 , 550 - 575 , 575 - 600 , 600 - 625 , 625 - 650 , 650 - 675 , 675 - 700 , 700 - 725 , 725 - 750 | ||
| Click To Change The Sort Order: By Market Cap or Company Size Performance: Year-to-date, Week and Day | |
| Select Chart Type: | ||
|
Best Stocks Today 12Stocks.com |
© 2024 12Stocks.com Terms & Conditions Privacy Contact Us
All Information Provided Only For Education And Not To Be Used For Investing or Trading. See Terms & Conditions


One More Thing ... Get Best Stocks Delivered Daily!
Never Ever Miss A Move With Our Top Ten Stocks Lists
Find Best Stocks In Any Market - Bull or Bear Market
Take A Peek At Our Top Ten Stocks Lists: Daily, Weekly, Year-to-Date & Top Trends
Find Best Stocks In Any Market - Bull or Bear Market
Take A Peek At Our Top Ten Stocks Lists: Daily, Weekly, Year-to-Date & Top Trends
Midcap Stocks With Best Up Trends [0-bearish to 100-bullish]: Bunge [100], Alaska Air[100], Conagra [100], Genuine Parts[100], Flowers Foods[100], United Airlines[100], Medical Properties[100], Generac [93], Commerce Bancshares[93], United [93], Inspire Medical[93]
Best Midcap Stocks Year-to-Date:
ShockWave Medical[71.95%], Vistra Energy[71.92%], AppLovin [69.92%], Constellation Energy[57.45%], EMCOR [54.5%], Spotify [47.6%], CAVA [39.8%], Pure Storage[39.01%], Williams-Sonoma [38.26%], Wingstop [37.35%], Allison Transmission[36.14%] Best Midcap Stocks This Week:
United Airlines[23.18%], AMC Entertainment[17.36%], Medical Properties[17.04%], Genuine Parts[10.93%], Globe Life[10.86%], agilon health[10.71%], Advance Auto[10.04%], Alaska Air[9.77%], Iridium [8.72%], American Airlines[8.4%], UGI [7.97%] Best Midcap Stocks Daily:
AMC Entertainment[6.51%], UGI [6.47%], Fifth Third[5.13%], agilon health[4.48%], Hawaiian Electric[4.11%], Darling Ingredients[3.74%], SSR Mining[3.50%], Bunge [2.96%], Iridium [2.92%], DXC [2.86%], Penn National[2.76%]