
 Login Sign Up


| |||||
 |  | ||||

| 12Stocks.com Market Intelligence |
Best MidCap Stocks
|
| In a hurry? Mid Cap Stocks Lists: Performance Trends Table, Stock Charts
Sort midcap stocks: Daily, Weekly, Year-to-Date, Market Cap & Trends. Filter midcap stocks list by sector: Show all, Tech, Finance, Energy, Staples, Retail, Industrial, Materials, Utilities and HealthCare Filter midcap stocks list by size:All MidCap Large Mid-Range Small |
| 12Stocks.com Mid Cap Stocks Performances & Trends Daily | |||||||||
|
|  The overall Smart Investing & Trading Score is 38 (0-bearish to 100-bullish) which puts Mid Cap index in short term bearish to neutral trend. The Smart Investing & Trading Score from previous trading session is 70 and hence a deterioration of trend.
| ||||||||
Here are the Smart Investing & Trading Scores of the most requested mid cap stocks at 12Stocks.com (click stock name for detailed review):
|


| 12Stocks.com: Top Performing Mid Cap Index Stocks | ||||||||||||||||||||||||||||||||||||||||||||||||
 The top performing Mid Cap Index stocks year to date are
Now, more recently, over last week, the top performing Mid Cap Index stocks on the move are


|
||||||||||||||||||||||||||||||||||||||||||||||||
| 12Stocks.com: Investing in Midcap Index with Stocks | |
|
The following table helps investors and traders sort through current performance and trends (as measured by Smart Investing & Trading Score) of various
stocks in the Midcap Index. Quick View: Move mouse or cursor over stock symbol (ticker) to view short-term technical chart and over stock name to view long term chart. Click on  to add stock symbol to your watchlist and to add stock symbol to your watchlist and  to view watchlist. Click on any ticker or stock name for detailed market intelligence report for that stock. to view watchlist. Click on any ticker or stock name for detailed market intelligence report for that stock. |
12Stocks.com Performance of Stocks in Midcap Index
| Ticker | Stock Name | Watchlist | Category | Recent Price | Smart Investing & Trading Score | Change % | YTD Change% |
| BEN | Franklin Resources |   | Financials | 22.84 | 0 | -2.31 | -23.33% |
| MAS | Masco | | Industrials | 68.45 | 26 | -2.31 | 2.19% |
| ENTG | Entegris | | Technology | 132.92 | 78 | -2.31 | 10.93% |
| ALNY | Alnylam | | Health Care | 143.95 | 35 | -2.31 | -24.79% |
| PEGA | Pega | | Technology | 59.42 | 46 | -2.32 | 21.61% |
| KKR | KKR | | Financials | 93.07 | 26 | -2.32 | 12.34% |
| OTIS | Otis Worldwide | | Industrials | 91.20 | 26 | -2.32 | 1.93% |
| EQT | EQT | | Energy | 40.09 | 68 | -2.34 | 3.70% |
| OLN | Olin | | Materials | 52.28 | 33 | -2.35 | -3.10% |
| MSCI | MSCI | | Technology | 465.79 | 18 | -2.35 | -17.65% |
| WBS | Webster Financial | | Financials | 43.83 | 0 | -2.36 | -13.65% |
| EFX | Equifax | | Financials | 220.19 | 10 | -2.36 | -10.96% |
| DHI | D.R. Horton | | Industrials | 142.49 | 13 | -2.38 | -6.24% |
| LNG | Cheniere Energy | | Energy | 157.82 | 25 | -2.40 | -7.55% |
| AM | Antero Midstream | | Energy | 13.84 | 46 | -2.40 | 10.45% |
| HLT | Hilton Worldwide | | Services & Goods | 197.28 | 33 | -2.41 | 8.34% |
| WLK | Westlake Chemical | | Materials | 147.36 | 46 | -2.41 | 5.29% |
| HOG | Harley-Davidson | | Consumer Staples | 34.39 | 51 | -2.41 | -6.65% |
| PCOR | Procore Technologies | | Technology | 68.42 | 10 | -2.41 | -2.09% |
| CMA | Comerica | | Financials | 50.17 | 10 | -2.43 | -10.11% |
| ALK | Alaska Air | | Transports | 43.02 | 58 | -2.43 | 10.11% |
| USFD | US Foods | | Consumer Staples | 50.25 | 48 | -2.43 | 10.66% |
| ITT | ITT | | Industrials | 129.34 | 48 | -2.44 | 8.40% |
| GL | Globe Life | | Financials | 76.17 | 50 | -2.46 | -37.42% |
| Z | Zillow | | Technology | 42.57 | 10 | -2.47 | -26.43% |
| For chart view version of above stock list: Chart View ➞ 0 - 25 , 25 - 50 , 50 - 75 , 75 - 100 , 100 - 125 , 125 - 150 , 150 - 175 , 175 - 200 , 200 - 225 , 225 - 250 , 250 - 275 , 275 - 300 , 300 - 325 , 325 - 350 , 350 - 375 , 375 - 400 , 400 - 425 , 425 - 450 , 450 - 475 , 475 - 500 , 500 - 525 , 525 - 550 , 550 - 575 , 575 - 600 , 600 - 625 , 625 - 650 , 650 - 675 , 675 - 700 , 700 - 725 , 725 - 750 , 750 - 775 | ||
 | Click To Change The Sort Order: By Market Cap or Company Size Performance: Year-to-date, Week and Day |  |
|
Get the most comprehensive stock market coverage daily at 12Stocks.com ➞ Best Stocks Today ➞ Best Stocks Weekly ➞ Best Stocks Year-to-Date ➞ Best Stocks Trends ➞  Best Stocks Today 12Stocks.com Best Nasdaq Stocks ➞ Best S&P 500 Stocks ➞ Best Tech Stocks ➞ Best Biotech Stocks ➞ |
| Detailed Overview of Midcap Stocks |
| Midcap Technical Overview, Leaders & Laggards, Top Midcap ETF Funds & Detailed Midcap Stocks List, Charts, Trends & More |
| Midcap: Technical Analysis, Trends & YTD Performance | |
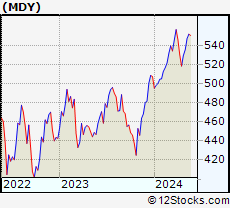
| MidCap segment as represented by
MDY, an exchange-traded fund [ETF], holds basket of about four hundred midcap stocks from across all major sectors of the US stock market. The midcap index (contains stocks like Green Mountain Coffee Roasters and Tractor Supply Company) is up by 3.03% and is currently underperforming the overall market by -1.77% year-to-date. Below is a quick view of technical charts and trends: | |
 MDY Weekly Chart |
|
| Long Term Trend: Good | |
| Medium Term Trend: Not Good | |
 MDY Daily Chart |
|
| Short Term Trend: Not Good | |
| Overall Trend Score: 38 | |
| YTD Performance: 3.03% | |
| **Trend Scores & Views Are Only For Educational Purposes And Not For Investing | |
| 12Stocks.com: Investing in Midcap Index using Exchange Traded Funds | |
|
The following table shows list of key exchange traded funds (ETF) that
help investors track Midcap index. The following list also includes leveraged ETF funds that track twice or thrice the daily returns of Midcap indices. Short or inverse ETF funds move in the opposite direction to the index they track and are useful during market pullbacks or during bear markets. Quick View: Move mouse or cursor over ETF symbol (ticker) to view short-term technical chart and over ETF name to view long term chart. Click on ticker or stock name for detailed view. Click on to add stock symbol to your watchlist and to view watchlist. |
12Stocks.com List of ETFs that track Midcap Index
| Ticker | ETF Name | Watchlist | Recent Price | Smart Investing & Trading Score | Change % | Week % | Year-to-date % |
| IJH | iShares Core S&P Mid-Cap | | 57.13 | 33 | -1.79 | -1.19 | 3.07% |
| MDY | SPDR S&P MidCap 400 ETF | | 522.76 | 38 | -1.79 | -1.25 | 3.03% |
| IWR | iShares Russell Mid-Cap | | 79.62 | 38 | -1.68 | -1.12 | 2.43% |
| IWP | iShares Russell Mid-Cap Growth | | 107.44 | 33 | -1.85 | -1.41 | 2.85% |
| IJK | iShares S&P Mid-Cap 400 Growth | | 85.84 | 38 | -1.91 | -1.33 | 8.36% |
| IWS | iShares Russell Mid-Cap Value | | 118.86 | 43 | -1.57 | -0.94 | 2.21% |
| IJJ | iShares S&P Mid-Cap 400 Value | | 111.06 | 20 | -1.59 | -1.04 | -2.61% |
| XMLV | PowerShares S&P MidCap Low Volatil ETF | | 54.44 | 58 | -0.91 | -0.38 | 2.37% |
| UMDD | ProShares UltraPro MidCap400 | | 23.26 | 31 | -4.36 | -2.92 | 4.21% |
| SMDD | ProShares UltraPro Short MidCap400 | | 12.21 | 57 | 5.08 | 3.21 | -9.31% |
| MVV | ProShares Ultra MidCap400 | | 59.89 | 38 | -3.10 | -2.51 | 3.45% |
| MYY | ProShares Short MidCap400 | | 20.91 | 40 | 1.06 | 0.58 | -2.54% |
| MZZ | ProShares UltraShort MidCap400 | | 11.82 | 27 | 1.98 | 1.2 | -5.97% |
| 12Stocks.com: Charts, Trends, Fundamental Data and Performances of MidCap Stocks | |
|
We now take in-depth look at all MidCap stocks including charts, multi-period performances and overall trends (as measured by Smart Investing & Trading Score). One can sort MidCap stocks (click link to choose) by Daily, Weekly and by Year-to-Date performances. Also, one can sort by size of the company or by market capitalization. |
| Select Your Default Chart Type: | |||||
| |||||
| Click on stock symbol or name for detailed view. Click on to add stock symbol to your watchlist and to view watchlist. Quick View: Move mouse or cursor over "Daily" to quickly view daily technical stock chart and over "Weekly" to view weekly technical stock chart. | |||||

 | BEN Franklin Resources, Inc. |
| Sector: Financials | |
| SubSector: Asset Management | |
| MarketCap: 9419.73 Millions | |
| Recent Price: 22.84 Smart Investing & Trading Score: 0 | |
| Day Percent Change: -2.31% Day Change: -0.54 | |
| Week Change: -8.6% Year-to-date Change: -23.3% | |
| BEN Links: Profile News Message Board | |
| Charts:- Daily , Weekly | |
| Add BEN to Watchlist: View: Get Complete BEN Trend Analysis ➞ | |
 | MAS Masco Corporation |
| Sector: Industrials | |
| SubSector: General Building Materials | |
| MarketCap: 8655.63 Millions | |
| Recent Price: 68.45 Smart Investing & Trading Score: 26 | |
| Day Percent Change: -2.31% Day Change: -1.62 | |
| Week Change: -2% Year-to-date Change: 2.2% | |
| MAS Links: Profile News Message Board | |
| Charts:- Daily , Weekly | |
| Add MAS to Watchlist: View: Get Complete MAS Trend Analysis ➞ | |
 | ENTG Entegris, Inc. |
| Sector: Technology | |
| SubSector: Semiconductor Equipment & Materials | |
| MarketCap: 5890.38 Millions | |
| Recent Price: 132.92 Smart Investing & Trading Score: 78 | |
| Day Percent Change: -2.31% Day Change: -3.14 | |
| Week Change: 0.24% Year-to-date Change: 10.9% | |
| ENTG Links: Profile News Message Board | |
| Charts:- Daily , Weekly | |
| Add ENTG to Watchlist: View: Get Complete ENTG Trend Analysis ➞ | |
 | ALNY Alnylam Pharmaceuticals, Inc. |
| Sector: Health Care | |
| SubSector: Biotechnology | |
| MarketCap: 12793.2 Millions | |
| Recent Price: 143.95 Smart Investing & Trading Score: 35 | |
| Day Percent Change: -2.31% Day Change: -3.41 | |
| Week Change: 0.45% Year-to-date Change: -24.8% | |
| ALNY Links: Profile News Message Board | |
| Charts:- Daily , Weekly | |
| Add ALNY to Watchlist: View: Get Complete ALNY Trend Analysis ➞ | |
 | PEGA Pegasystems Inc. |
| Sector: Technology | |
| SubSector: Business Software & Services | |
| MarketCap: 5924.88 Millions | |
| Recent Price: 59.42 Smart Investing & Trading Score: 46 | |
| Day Percent Change: -2.32% Day Change: -1.41 | |
| Week Change: -3.85% Year-to-date Change: 21.6% | |
| PEGA Links: Profile News Message Board | |
| Charts:- Daily , Weekly | |
| Add PEGA to Watchlist: View: Get Complete PEGA Trend Analysis ➞ | |
 | KKR KKR & Co. Inc. |
| Sector: Financials | |
| SubSector: Asset Management | |
| MarketCap: 17722.5 Millions | |
| Recent Price: 93.07 Smart Investing & Trading Score: 26 | |
| Day Percent Change: -2.32% Day Change: -2.21 | |
| Week Change: -2.59% Year-to-date Change: 12.3% | |
| KKR Links: Profile News Message Board | |
| Charts:- Daily , Weekly | |
| Add KKR to Watchlist: View: Get Complete KKR Trend Analysis ➞ | |
 | OTIS Otis Worldwide Corporation |
| Sector: Industrials | |
| SubSector: Specialty Industrial Machinery | |
| MarketCap: 27727 Millions | |
| Recent Price: 91.20 Smart Investing & Trading Score: 26 | |
| Day Percent Change: -2.32% Day Change: -2.17 | |
| Week Change: -1.08% Year-to-date Change: 1.9% | |
| OTIS Links: Profile News Message Board | |
| Charts:- Daily , Weekly | |
| Add OTIS to Watchlist: View: Get Complete OTIS Trend Analysis ➞ | |
 | EQT EQT Corporation |
| Sector: Energy | |
| SubSector: Independent Oil & Gas | |
| MarketCap: 1886.63 Millions | |
| Recent Price: 40.09 Smart Investing & Trading Score: 68 | |
| Day Percent Change: -2.34% Day Change: -0.96 | |
| Week Change: -1.28% Year-to-date Change: 3.7% | |
| EQT Links: Profile News Message Board | |
| Charts:- Daily , Weekly | |
| Add EQT to Watchlist: View: Get Complete EQT Trend Analysis ➞ | |
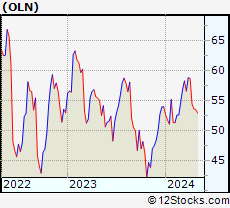 | OLN Olin Corporation |
| Sector: Materials | |
| SubSector: Specialty Chemicals | |
| MarketCap: 2126.87 Millions | |
| Recent Price: 52.28 Smart Investing & Trading Score: 33 | |
| Day Percent Change: -2.35% Day Change: -1.26 | |
| Week Change: -2.24% Year-to-date Change: -3.1% | |
| OLN Links: Profile News Message Board | |
| Charts:- Daily , Weekly | |
| Add OLN to Watchlist: View: Get Complete OLN Trend Analysis ➞ | |
 | MSCI MSCI Inc. |
| Sector: Technology | |
| SubSector: Processing Systems & Products | |
| MarketCap: 21086.3 Millions | |
| Recent Price: 465.79 Smart Investing & Trading Score: 18 | |
| Day Percent Change: -2.35% Day Change: -11.19 | |
| Week Change: -2.51% Year-to-date Change: -17.7% | |
| MSCI Links: Profile News Message Board | |
| Charts:- Daily , Weekly | |
| Add MSCI to Watchlist: View: Get Complete MSCI Trend Analysis ➞ | |
 | WBS Webster Financial Corporation |
| Sector: Financials | |
| SubSector: Regional - Northeast Banks | |
| MarketCap: 2111.59 Millions | |
| Recent Price: 43.83 Smart Investing & Trading Score: 0 | |
| Day Percent Change: -2.36% Day Change: -1.06 | |
| Week Change: -2.66% Year-to-date Change: -13.7% | |
| WBS Links: Profile News Message Board | |
| Charts:- Daily , Weekly | |
| Add WBS to Watchlist: View: Get Complete WBS Trend Analysis ➞ | |
 | EFX Equifax Inc. |
| Sector: Financials | |
| SubSector: Credit Services | |
| MarketCap: 13754.6 Millions | |
| Recent Price: 220.19 Smart Investing & Trading Score: 10 | |
| Day Percent Change: -2.36% Day Change: -5.33 | |
| Week Change: -1.45% Year-to-date Change: -11.0% | |
| EFX Links: Profile News Message Board | |
| Charts:- Daily , Weekly | |
| Add EFX to Watchlist: View: Get Complete EFX Trend Analysis ➞ | |
 | DHI D.R. Horton, Inc. |
| Sector: Industrials | |
| SubSector: Residential Construction | |
| MarketCap: 13372.6 Millions | |
| Recent Price: 142.49 Smart Investing & Trading Score: 13 | |
| Day Percent Change: -2.38% Day Change: -3.48 | |
| Week Change: -1.95% Year-to-date Change: -6.2% | |
| DHI Links: Profile News Message Board | |
| Charts:- Daily , Weekly | |
| Add DHI to Watchlist: View: Get Complete DHI Trend Analysis ➞ | |
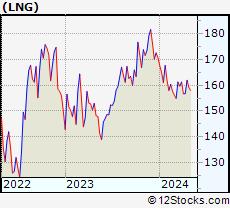 | LNG Cheniere Energy, Inc. |
| Sector: Energy | |
| SubSector: Oil & Gas Pipelines | |
| MarketCap: 9905.15 Millions | |
| Recent Price: 157.82 Smart Investing & Trading Score: 25 | |
| Day Percent Change: -2.40% Day Change: -3.88 | |
| Week Change: -0.83% Year-to-date Change: -7.6% | |
| LNG Links: Profile News Message Board | |
| Charts:- Daily , Weekly | |
| Add LNG to Watchlist: View: Get Complete LNG Trend Analysis ➞ | |
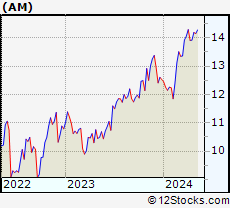 | AM Antero Midstream Corporation |
| Sector: Energy | |
| SubSector: Oil & Gas Pipelines | |
| MarketCap: 1195.35 Millions | |
| Recent Price: 13.84 Smart Investing & Trading Score: 46 | |
| Day Percent Change: -2.40% Day Change: -0.34 | |
| Week Change: -2.47% Year-to-date Change: 10.5% | |
| AM Links: Profile News Message Board | |
| Charts:- Daily , Weekly | |
| Add AM to Watchlist: View: Get Complete AM Trend Analysis ➞ | |
 | HLT Hilton Worldwide Holdings Inc. |
| Sector: Services & Goods | |
| SubSector: Lodging | |
| MarketCap: 18064.6 Millions | |
| Recent Price: 197.28 Smart Investing & Trading Score: 33 | |
| Day Percent Change: -2.41% Day Change: -4.88 | |
| Week Change: -2.39% Year-to-date Change: 8.3% | |
| HLT Links: Profile News Message Board | |
| Charts:- Daily , Weekly | |
| Add HLT to Watchlist: View: Get Complete HLT Trend Analysis ➞ | |
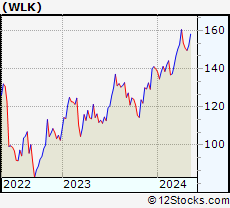 | WLK Westlake Chemical Corporation |
| Sector: Materials | |
| SubSector: Specialty Chemicals | |
| MarketCap: 5221.47 Millions | |
| Recent Price: 147.36 Smart Investing & Trading Score: 46 | |
| Day Percent Change: -2.41% Day Change: -3.64 | |
| Week Change: -1.46% Year-to-date Change: 5.3% | |
| WLK Links: Profile News Message Board | |
| Charts:- Daily , Weekly | |
| Add WLK to Watchlist: View: Get Complete WLK Trend Analysis ➞ | |
 | HOG Harley-Davidson, Inc. |
| Sector: Consumer Staples | |
| SubSector: Recreational Vehicles | |
| MarketCap: 2808.49 Millions | |
| Recent Price: 34.39 Smart Investing & Trading Score: 51 | |
| Day Percent Change: -2.41% Day Change: -0.85 | |
| Week Change: -1.04% Year-to-date Change: -6.7% | |
| HOG Links: Profile News Message Board | |
| Charts:- Daily , Weekly | |
| Add HOG to Watchlist: View: Get Complete HOG Trend Analysis ➞ | |
 | PCOR Procore Technologies, Inc. |
| Sector: Technology | |
| SubSector: Software - Application | |
| MarketCap: 9180 Millions | |
| Recent Price: 68.42 Smart Investing & Trading Score: 10 | |
| Day Percent Change: -2.41% Day Change: -1.69 | |
| Week Change: -2.38% Year-to-date Change: -2.1% | |
| PCOR Links: Profile News Message Board | |
| Charts:- Daily , Weekly | |
| Add PCOR to Watchlist: View: Get Complete PCOR Trend Analysis ➞ | |
 | CMA Comerica Incorporated |
| Sector: Financials | |
| SubSector: Money Center Banks | |
| MarketCap: 4449.49 Millions | |
| Recent Price: 50.17 Smart Investing & Trading Score: 10 | |
| Day Percent Change: -2.43% Day Change: -1.25 | |
| Week Change: -3.65% Year-to-date Change: -10.1% | |
| CMA Links: Profile News Message Board | |
| Charts:- Daily , Weekly | |
| Add CMA to Watchlist: View: Get Complete CMA Trend Analysis ➞ | |
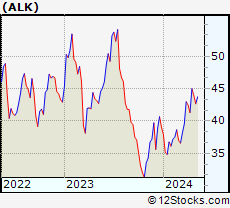 | ALK Alaska Air Group, Inc. |
| Sector: Transports | |
| SubSector: Regional Airlines | |
| MarketCap: 3772.5 Millions | |
| Recent Price: 43.02 Smart Investing & Trading Score: 58 | |
| Day Percent Change: -2.43% Day Change: -1.07 | |
| Week Change: -2.14% Year-to-date Change: 10.1% | |
| ALK Links: Profile News Message Board | |
| Charts:- Daily , Weekly | |
| Add ALK to Watchlist: View: Get Complete ALK Trend Analysis ➞ | |
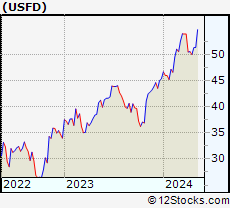 | USFD US Foods Holding Corp. |
| Sector: Consumer Staples | |
| SubSector: Food Wholesale | |
| MarketCap: 3740.99 Millions | |
| Recent Price: 50.25 Smart Investing & Trading Score: 48 | |
| Day Percent Change: -2.43% Day Change: -1.25 | |
| Week Change: -2.14% Year-to-date Change: 10.7% | |
| USFD Links: Profile News Message Board | |
| Charts:- Daily , Weekly | |
| Add USFD to Watchlist: View: Get Complete USFD Trend Analysis ➞ | |
 | ITT ITT Inc. |
| Sector: Industrials | |
| SubSector: Diversified Machinery | |
| MarketCap: 3783.06 Millions | |
| Recent Price: 129.34 Smart Investing & Trading Score: 48 | |
| Day Percent Change: -2.44% Day Change: -3.24 | |
| Week Change: -1.42% Year-to-date Change: 8.4% | |
| ITT Links: Profile News Message Board | |
| Charts:- Daily , Weekly | |
| Add ITT to Watchlist: View: Get Complete ITT Trend Analysis ➞ | |
 | GL Globe Life Inc. |
| Sector: Financials | |
| SubSector: Life Insurance | |
| MarketCap: 7596.46 Millions | |
| Recent Price: 76.17 Smart Investing & Trading Score: 50 | |
| Day Percent Change: -2.46% Day Change: -1.92 | |
| Week Change: 0.55% Year-to-date Change: -37.4% | |
| GL Links: Profile News Message Board | |
| Charts:- Daily , Weekly | |
| Add GL to Watchlist: View: Get Complete GL Trend Analysis ➞ | |
 | Z Zillow Group, Inc. |
| Sector: Technology | |
| SubSector: Internet Information Providers | |
| MarketCap: 3880.4 Millions | |
| Recent Price: 42.57 Smart Investing & Trading Score: 10 | |
| Day Percent Change: -2.47% Day Change: -1.08 | |
| Week Change: -2.52% Year-to-date Change: -26.4% | |
| Z Links: Profile News Message Board | |
| Charts:- Daily , Weekly | |
| Add Z to Watchlist: View: Get Complete Z Trend Analysis ➞ | |
| For tabular summary view of above stock list: Summary View ➞ 0 - 25 , 25 - 50 , 50 - 75 , 75 - 100 , 100 - 125 , 125 - 150 , 150 - 175 , 175 - 200 , 200 - 225 , 225 - 250 , 250 - 275 , 275 - 300 , 300 - 325 , 325 - 350 , 350 - 375 , 375 - 400 , 400 - 425 , 425 - 450 , 450 - 475 , 475 - 500 , 500 - 525 , 525 - 550 , 550 - 575 , 575 - 600 , 600 - 625 , 625 - 650 , 650 - 675 , 675 - 700 , 700 - 725 , 725 - 750 , 750 - 775 | ||
| Click To Change The Sort Order: By Market Cap or Company Size Performance: Year-to-date, Week and Day | |
| Select Chart Type: | ||
|
Best Stocks Today 12Stocks.com |
© 2024 12Stocks.com Terms & Conditions Privacy Contact Us
All Information Provided Only For Education And Not To Be Used For Investing or Trading. See Terms & Conditions


One More Thing ... Get Best Stocks Delivered Daily!
Never Ever Miss A Move With Our Top Ten Stocks Lists
Find Best Stocks In Any Market - Bull or Bear Market
Take A Peek At Our Top Ten Stocks Lists: Daily, Weekly, Year-to-Date & Top Trends
Find Best Stocks In Any Market - Bull or Bear Market
Take A Peek At Our Top Ten Stocks Lists: Daily, Weekly, Year-to-Date & Top Trends
Midcap Stocks With Best Up Trends [0-bearish to 100-bullish]: Tenet [100], Woodward [100], Sensata Technologies[100], Leidos [100], Corning [100], Zebra Technologies[100], Timken [100], OneMain [100], CAVA [100], Mosaic [100], Texas Roadhouse[100]
Best Midcap Stocks Year-to-Date:
Vistra Energy[96.88%], AppLovin [77.26%], ShockWave Medical[73.27%], EMCOR [65.79%], CAVA [65.46%], Constellation Energy[58.77%], Wingstop [49.97%], Antero Resources[49.96%], Spotify [49.24%], Tenet [48.59%], Natera [48.28%] Best Midcap Stocks This Week:
Tenet [16.81%], agilon health[10%], Sensata Technologies[9.52%], Woodward [7.82%], Leidos [7.56%], Corning [6.54%], Maravai LifeSciences[6.49%], 10x Genomics[6.13%], Domino s[6.05%], Zebra Technologies[5.84%], Timken [4.99%] Best Midcap Stocks Daily:
Tenet [13.25%], Woodward [7.47%], agilon health[7.21%], Sensata Technologies[7.13%], Leidos [6.53%], Corning [5.03%], Zebra Technologies[4.85%], Maravai LifeSciences[4.46%], 10x Genomics[3.10%], Quidel [3.02%], Timken [2.91%]