
 Login Sign Up


| |||||
 |  | ||||

| 12Stocks.com Market Intelligence |
Best MidCap Stocks
|
| In a hurry? Mid Cap Stocks Lists: Performance Trends Table, Stock Charts
Sort midcap stocks: Daily, Weekly, Year-to-Date, Market Cap & Trends. Filter midcap stocks list by sector: Show all, Tech, Finance, Energy, Staples, Retail, Industrial, Materials, Utilities and HealthCare Filter midcap stocks list by size:All MidCap Large Mid-Range Small |
| 12Stocks.com Mid Cap Stocks Performances & Trends Daily | |||||||||
|
|  The overall Smart Investing & Trading Score is 38 (0-bearish to 100-bullish) which puts Mid Cap index in short term bearish to neutral trend. The Smart Investing & Trading Score from previous trading session is 70 and hence a deterioration of trend.
| ||||||||
Here are the Smart Investing & Trading Scores of the most requested mid cap stocks at 12Stocks.com (click stock name for detailed review):
|


| 12Stocks.com: Top Performing Mid Cap Index Stocks | ||||||||||||||||||||||||||||||||||||||||||||||||
 The top performing Mid Cap Index stocks year to date are
Now, more recently, over last week, the top performing Mid Cap Index stocks on the move are


|
||||||||||||||||||||||||||||||||||||||||||||||||
| 12Stocks.com: Investing in Midcap Index with Stocks | |
|
The following table helps investors and traders sort through current performance and trends (as measured by Smart Investing & Trading Score) of various
stocks in the Midcap Index. Quick View: Move mouse or cursor over stock symbol (ticker) to view short-term technical chart and over stock name to view long term chart. Click on  to add stock symbol to your watchlist and to add stock symbol to your watchlist and  to view watchlist. Click on any ticker or stock name for detailed market intelligence report for that stock. to view watchlist. Click on any ticker or stock name for detailed market intelligence report for that stock. |
12Stocks.com Performance of Stocks in Midcap Index
| Ticker | Stock Name | Watchlist | Category | Recent Price | Smart Investing & Trading Score | Change % | YTD Change% |
| DD | DuPont de |   | Materials | 72.50 | 36 | -1.89 | -5.76% |
| MSM | MSC Industrial | | Services & Goods | 91.24 | 0 | -1.91 | -9.90% |
| CLH | Clean Harbors | | Industrials | 189.45 | 26 | -1.91 | 8.56% |
| WAT | Waters | | Health Care | 309.04 | 18 | -1.92 | -6.13% |
| SNV | Synovus Financial | | Financials | 35.79 | 5 | -1.92 | -4.94% |
| POOL | Pool | | Consumer Staples | 362.53 | 23 | -1.92 | -9.07% |
| CRUS | Cirrus Logic | | Technology | 88.57 | 93 | -1.92 | 6.47% |
| BSY | Bentley | | Technology | 52.53 | 56 | -1.92 | 0.69% |
| CUBE | CubeSmart | | Financials | 40.44 | 20 | -1.94 | -12.75% |
| FHB | First Hawaiian | | Financials | 21.09 | 42 | -1.95 | -7.74% |
| TTD | Trade Desk | | Technology | 82.85 | 56 | -1.95 | 15.13% |
| CARR | Carrier Global | | Industrials | 61.49 | 100 | -1.95 | 7.03% |
| MKTX | MarketAxess | | Financials | 200.09 | 28 | -1.96 | -31.67% |
| KMX | CarMax | | Services & Goods | 67.97 | 10 | -1.99 | -11.43% |
| FMC | FMC | | Materials | 59.01 | 90 | -1.99 | -6.41% |
| W | Wayfair | | Services & Goods | 50.15 | 36 | -1.99 | -18.72% |
| IVZ | Invesco | | Financials | 14.17 | 10 | -2.01 | -20.57% |
| TDC | Teradata | | Technology | 37.10 | 32 | -2.01 | -14.73% |
| IQV | IQVIA | | Health Care | 231.77 | 61 | -2.01 | 0.17% |
| TECH | Bio-Techne | | Health Care | 63.21 | 42 | -2.02 | -18.08% |
| OC | Owens Corning | | Industrials | 168.21 | 83 | -2.02 | 13.48% |
| RF | Regions Financial | | Financials | 19.27 | 51 | -2.03 | -0.57% |
| STT | State Street | | Financials | 72.49 | 0 | -2.03 | -6.42% |
| SLM | SLM | | Financials | 21.19 | 58 | -2.03 | 10.83% |
| MTD | Mettler-Toledo | | Health Care | 1229.70 | 61 | -2.03 | 1.38% |
| For chart view version of above stock list: Chart View ➞ 0 - 25 , 25 - 50 , 50 - 75 , 75 - 100 , 100 - 125 , 125 - 150 , 150 - 175 , 175 - 200 , 200 - 225 , 225 - 250 , 250 - 275 , 275 - 300 , 300 - 325 , 325 - 350 , 350 - 375 , 375 - 400 , 400 - 425 , 425 - 450 , 450 - 475 , 475 - 500 , 500 - 525 , 525 - 550 , 550 - 575 , 575 - 600 , 600 - 625 , 625 - 650 , 650 - 675 , 675 - 700 , 700 - 725 , 725 - 750 , 750 - 775 | ||
 | Click To Change The Sort Order: By Market Cap or Company Size Performance: Year-to-date, Week and Day |  |
|
Get the most comprehensive stock market coverage daily at 12Stocks.com ➞ Best Stocks Today ➞ Best Stocks Weekly ➞ Best Stocks Year-to-Date ➞ Best Stocks Trends ➞  Best Stocks Today 12Stocks.com Best Nasdaq Stocks ➞ Best S&P 500 Stocks ➞ Best Tech Stocks ➞ Best Biotech Stocks ➞ |
| Detailed Overview of Midcap Stocks |
| Midcap Technical Overview, Leaders & Laggards, Top Midcap ETF Funds & Detailed Midcap Stocks List, Charts, Trends & More |
| Midcap: Technical Analysis, Trends & YTD Performance | |
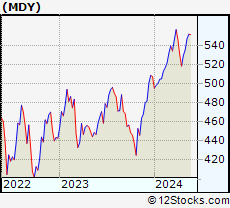
| MidCap segment as represented by
MDY, an exchange-traded fund [ETF], holds basket of about four hundred midcap stocks from across all major sectors of the US stock market. The midcap index (contains stocks like Green Mountain Coffee Roasters and Tractor Supply Company) is up by 3.03% and is currently underperforming the overall market by -1.77% year-to-date. Below is a quick view of technical charts and trends: | |
 MDY Weekly Chart |
|
| Long Term Trend: Good | |
| Medium Term Trend: Not Good | |
 MDY Daily Chart |
|
| Short Term Trend: Not Good | |
| Overall Trend Score: 38 | |
| YTD Performance: 3.03% | |
| **Trend Scores & Views Are Only For Educational Purposes And Not For Investing | |
| 12Stocks.com: Investing in Midcap Index using Exchange Traded Funds | |
|
The following table shows list of key exchange traded funds (ETF) that
help investors track Midcap index. The following list also includes leveraged ETF funds that track twice or thrice the daily returns of Midcap indices. Short or inverse ETF funds move in the opposite direction to the index they track and are useful during market pullbacks or during bear markets. Quick View: Move mouse or cursor over ETF symbol (ticker) to view short-term technical chart and over ETF name to view long term chart. Click on ticker or stock name for detailed view. Click on to add stock symbol to your watchlist and to view watchlist. |
12Stocks.com List of ETFs that track Midcap Index
| Ticker | ETF Name | Watchlist | Recent Price | Smart Investing & Trading Score | Change % | Week % | Year-to-date % |
| IJH | iShares Core S&P Mid-Cap | | 57.13 | 68 | -1.79 | -1.19 | 3.07% |
| MDY | SPDR S&P MidCap 400 ETF | | 522.76 | 38 | -1.79 | -1.25 | 3.03% |
| IWR | iShares Russell Mid-Cap | | 79.62 | 68 | -1.68 | -1.12 | 2.43% |
| IWP | iShares Russell Mid-Cap Growth | | 107.44 | 71 | -1.85 | -1.41 | 2.85% |
| IJK | iShares S&P Mid-Cap 400 Growth | | 85.84 | 63 | -1.91 | -1.33 | 8.36% |
| IWS | iShares Russell Mid-Cap Value | | 118.86 | 68 | -1.57 | -0.94 | 2.21% |
| IJJ | iShares S&P Mid-Cap 400 Value | | 111.06 | 81 | -1.59 | -1.04 | -2.61% |
| XMLV | PowerShares S&P MidCap Low Volatil ETF | | 54.44 | 76 | -0.91 | -0.38 | 2.37% |
| UMDD | ProShares UltraPro MidCap400 | | 23.26 | 31 | -4.36 | -2.92 | 4.21% |
| SMDD | ProShares UltraPro Short MidCap400 | | 12.21 | 57 | 5.08 | 3.21 | -9.31% |
| MVV | ProShares Ultra MidCap400 | | 59.89 | 68 | -3.10 | -2.51 | 3.45% |
| MYY | ProShares Short MidCap400 | | 20.91 | 40 | 1.06 | 0.58 | -2.54% |
| MZZ | ProShares UltraShort MidCap400 | | 11.82 | 27 | 1.98 | 1.2 | -5.97% |
| 12Stocks.com: Charts, Trends, Fundamental Data and Performances of MidCap Stocks | |
|
We now take in-depth look at all MidCap stocks including charts, multi-period performances and overall trends (as measured by Smart Investing & Trading Score). One can sort MidCap stocks (click link to choose) by Daily, Weekly and by Year-to-Date performances. Also, one can sort by size of the company or by market capitalization. |
| Select Your Default Chart Type: | |||||
| |||||
| Click on stock symbol or name for detailed view. Click on to add stock symbol to your watchlist and to view watchlist. Quick View: Move mouse or cursor over "Daily" to quickly view daily technical stock chart and over "Weekly" to view weekly technical stock chart. | |||||

 | DD DuPont de Nemours, Inc. |
| Sector: Materials | |
| SubSector: Agricultural Chemicals | |
| MarketCap: 25631.6 Millions | |
| Recent Price: 72.50 Smart Investing & Trading Score: 36 | |
| Day Percent Change: -1.89% Day Change: -1.40 | |
| Week Change: -1.64% Year-to-date Change: -5.8% | |
| DD Links: Profile News Message Board | |
| Charts:- Daily , Weekly | |
| Add DD to Watchlist: View: Get Complete DD Trend Analysis ➞ | |
 | MSM MSC Industrial Direct Co., Inc. |
| Sector: Services & Goods | |
| SubSector: Industrial Equipment Wholesale | |
| MarketCap: 2701.88 Millions | |
| Recent Price: 91.24 Smart Investing & Trading Score: 0 | |
| Day Percent Change: -1.91% Day Change: -1.78 | |
| Week Change: -2.12% Year-to-date Change: -9.9% | |
| MSM Links: Profile News Message Board | |
| Charts:- Daily , Weekly | |
| Add MSM to Watchlist: View: Get Complete MSM Trend Analysis ➞ | |
 | CLH Clean Harbors, Inc. |
| Sector: Industrials | |
| SubSector: Waste Management | |
| MarketCap: 2391.28 Millions | |
| Recent Price: 189.45 Smart Investing & Trading Score: 26 | |
| Day Percent Change: -1.91% Day Change: -3.68 | |
| Week Change: -2.35% Year-to-date Change: 8.6% | |
| CLH Links: Profile News Message Board | |
| Charts:- Daily , Weekly | |
| Add CLH to Watchlist: View: Get Complete CLH Trend Analysis ➞ | |
 | WAT Waters Corporation |
| Sector: Health Care | |
| SubSector: Medical Instruments & Supplies | |
| MarketCap: 11882 Millions | |
| Recent Price: 309.04 Smart Investing & Trading Score: 18 | |
| Day Percent Change: -1.92% Day Change: -6.05 | |
| Week Change: -0.73% Year-to-date Change: -6.1% | |
| WAT Links: Profile News Message Board | |
| Charts:- Daily , Weekly | |
| Add WAT to Watchlist: View: Get Complete WAT Trend Analysis ➞ | |
 | SNV Synovus Financial Corp. |
| Sector: Financials | |
| SubSector: Regional - Mid-Atlantic Banks | |
| MarketCap: 2697.29 Millions | |
| Recent Price: 35.79 Smart Investing & Trading Score: 5 | |
| Day Percent Change: -1.92% Day Change: -0.70 | |
| Week Change: -2.88% Year-to-date Change: -4.9% | |
| SNV Links: Profile News Message Board | |
| Charts:- Daily , Weekly | |
| Add SNV to Watchlist: View: Get Complete SNV Trend Analysis ➞ | |
 | POOL Pool Corporation |
| Sector: Consumer Staples | |
| SubSector: Sporting Goods | |
| MarketCap: 7479.64 Millions | |
| Recent Price: 362.53 Smart Investing & Trading Score: 23 | |
| Day Percent Change: -1.92% Day Change: -7.08 | |
| Week Change: -2.33% Year-to-date Change: -9.1% | |
| POOL Links: Profile News Message Board | |
| Charts:- Daily , Weekly | |
| Add POOL to Watchlist: View: Get Complete POOL Trend Analysis ➞ | |
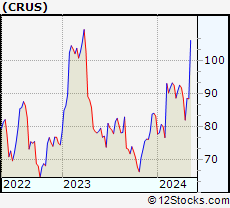 | CRUS Cirrus Logic, Inc. |
| Sector: Technology | |
| SubSector: Semiconductor - Specialized | |
| MarketCap: 3852.6 Millions | |
| Recent Price: 88.57 Smart Investing & Trading Score: 93 | |
| Day Percent Change: -1.92% Day Change: -1.73 | |
| Week Change: 0.05% Year-to-date Change: 6.5% | |
| CRUS Links: Profile News Message Board | |
| Charts:- Daily , Weekly | |
| Add CRUS to Watchlist: View: Get Complete CRUS Trend Analysis ➞ | |
 | BSY Bentley Systems, Incorporated |
| Sector: Technology | |
| SubSector: Software Application | |
| MarketCap: 98687 Millions | |
| Recent Price: 52.53 Smart Investing & Trading Score: 56 | |
| Day Percent Change: -1.92% Day Change: -1.03 | |
| Week Change: -2.7% Year-to-date Change: 0.7% | |
| BSY Links: Profile News Message Board | |
| Charts:- Daily , Weekly | |
| Add BSY to Watchlist: View: Get Complete BSY Trend Analysis ➞ | |
 | CUBE CubeSmart |
| Sector: Financials | |
| SubSector: REIT - Industrial | |
| MarketCap: 4562.99 Millions | |
| Recent Price: 40.44 Smart Investing & Trading Score: 20 | |
| Day Percent Change: -1.94% Day Change: -0.80 | |
| Week Change: -0.79% Year-to-date Change: -12.8% | |
| CUBE Links: Profile News Message Board | |
| Charts:- Daily , Weekly | |
| Add CUBE to Watchlist: View: Get Complete CUBE Trend Analysis ➞ | |
 | FHB First Hawaiian, Inc. |
| Sector: Financials | |
| SubSector: Regional - Pacific Banks | |
| MarketCap: 2398.99 Millions | |
| Recent Price: 21.09 Smart Investing & Trading Score: 42 | |
| Day Percent Change: -1.95% Day Change: -0.42 | |
| Week Change: -3.65% Year-to-date Change: -7.7% | |
| FHB Links: Profile News Message Board | |
| Charts:- Daily , Weekly | |
| Add FHB to Watchlist: View: Get Complete FHB Trend Analysis ➞ | |
 | TTD The Trade Desk, Inc. |
| Sector: Technology | |
| SubSector: Application Software | |
| MarketCap: 9006.92 Millions | |
| Recent Price: 82.85 Smart Investing & Trading Score: 56 | |
| Day Percent Change: -1.95% Day Change: -1.65 | |
| Week Change: -2.22% Year-to-date Change: 15.1% | |
| TTD Links: Profile News Message Board | |
| Charts:- Daily , Weekly | |
| Add TTD to Watchlist: View: Get Complete TTD Trend Analysis ➞ | |
 | CARR Carrier Global Corporation |
| Sector: Industrials | |
| SubSector: Building Products & Equipment | |
| MarketCap: 32547 Millions | |
| Recent Price: 61.49 Smart Investing & Trading Score: 100 | |
| Day Percent Change: -1.95% Day Change: -1.22 | |
| Week Change: 1.64% Year-to-date Change: 7.0% | |
| CARR Links: Profile News Message Board | |
| Charts:- Daily , Weekly | |
| Add CARR to Watchlist: View: Get Complete CARR Trend Analysis ➞ | |
 | MKTX MarketAxess Holdings Inc. |
| Sector: Financials | |
| SubSector: Investment Brokerage - National | |
| MarketCap: 12431.5 Millions | |
| Recent Price: 200.09 Smart Investing & Trading Score: 28 | |
| Day Percent Change: -1.96% Day Change: -4.01 | |
| Week Change: -0.84% Year-to-date Change: -31.7% | |
| MKTX Links: Profile News Message Board | |
| Charts:- Daily , Weekly | |
| Add MKTX to Watchlist: View: Get Complete MKTX Trend Analysis ➞ | |
 | KMX CarMax, Inc. |
| Sector: Services & Goods | |
| SubSector: Auto Dealerships | |
| MarketCap: 8121.71 Millions | |
| Recent Price: 67.97 Smart Investing & Trading Score: 10 | |
| Day Percent Change: -1.99% Day Change: -1.38 | |
| Week Change: -2.33% Year-to-date Change: -11.4% | |
| KMX Links: Profile News Message Board | |
| Charts:- Daily , Weekly | |
| Add KMX to Watchlist: View: Get Complete KMX Trend Analysis ➞ | |
 | FMC FMC Corporation |
| Sector: Materials | |
| SubSector: Chemicals - Major Diversified | |
| MarketCap: 9068.36 Millions | |
| Recent Price: 59.01 Smart Investing & Trading Score: 90 | |
| Day Percent Change: -1.99% Day Change: -1.20 | |
| Week Change: 0.94% Year-to-date Change: -6.4% | |
| FMC Links: Profile News Message Board | |
| Charts:- Daily , Weekly | |
| Add FMC to Watchlist: View: Get Complete FMC Trend Analysis ➞ | |
 | W Wayfair Inc. |
| Sector: Services & Goods | |
| SubSector: Catalog & Mail Order Houses | |
| MarketCap: 3497.02 Millions | |
| Recent Price: 50.15 Smart Investing & Trading Score: 36 | |
| Day Percent Change: -1.99% Day Change: -1.02 | |
| Week Change: -3.58% Year-to-date Change: -18.7% | |
| W Links: Profile News Message Board | |
| Charts:- Daily , Weekly | |
| Add W to Watchlist: View: Get Complete W Trend Analysis ➞ | |
 | IVZ Invesco Ltd. |
| Sector: Financials | |
| SubSector: Asset Management | |
| MarketCap: 4578.23 Millions | |
| Recent Price: 14.17 Smart Investing & Trading Score: 10 | |
| Day Percent Change: -2.01% Day Change: -0.29 | |
| Week Change: -3.41% Year-to-date Change: -20.6% | |
| IVZ Links: Profile News Message Board | |
| Charts:- Daily , Weekly | |
| Add IVZ to Watchlist: View: Get Complete IVZ Trend Analysis ➞ | |
 | TDC Teradata Corporation |
| Sector: Technology | |
| SubSector: Information Technology Services | |
| MarketCap: 2229.48 Millions | |
| Recent Price: 37.10 Smart Investing & Trading Score: 32 | |
| Day Percent Change: -2.01% Day Change: -0.76 | |
| Week Change: -1.51% Year-to-date Change: -14.7% | |
| TDC Links: Profile News Message Board | |
| Charts:- Daily , Weekly | |
| Add TDC to Watchlist: View: Get Complete TDC Trend Analysis ➞ | |
 | IQV IQVIA Holdings Inc. |
| Sector: Health Care | |
| SubSector: Medical Laboratories & Research | |
| MarketCap: 19616.5 Millions | |
| Recent Price: 231.77 Smart Investing & Trading Score: 61 | |
| Day Percent Change: -2.01% Day Change: -4.76 | |
| Week Change: -1.32% Year-to-date Change: 0.2% | |
| IQV Links: Profile News Message Board | |
| Charts:- Daily , Weekly | |
| Add IQV to Watchlist: View: Get Complete IQV Trend Analysis ➞ | |
 | TECH Bio-Techne Corporation |
| Sector: Health Care | |
| SubSector: Biotechnology | |
| MarketCap: 6958.05 Millions | |
| Recent Price: 63.21 Smart Investing & Trading Score: 42 | |
| Day Percent Change: -2.02% Day Change: -1.30 | |
| Week Change: -1.33% Year-to-date Change: -18.1% | |
| TECH Links: Profile News Message Board | |
| Charts:- Daily , Weekly | |
| Add TECH to Watchlist: View: Get Complete TECH Trend Analysis ➞ | |
 | OC Owens Corning |
| Sector: Industrials | |
| SubSector: General Building Materials | |
| MarketCap: 3686.73 Millions | |
| Recent Price: 168.21 Smart Investing & Trading Score: 83 | |
| Day Percent Change: -2.02% Day Change: -3.47 | |
| Week Change: -0.17% Year-to-date Change: 13.5% | |
| OC Links: Profile News Message Board | |
| Charts:- Daily , Weekly | |
| Add OC to Watchlist: View: Get Complete OC Trend Analysis ➞ | |
 | RF Regions Financial Corporation |
| Sector: Financials | |
| SubSector: Regional - Southeast Banks | |
| MarketCap: 8936.25 Millions | |
| Recent Price: 19.27 Smart Investing & Trading Score: 51 | |
| Day Percent Change: -2.03% Day Change: -0.40 | |
| Week Change: -1.78% Year-to-date Change: -0.6% | |
| RF Links: Profile News Message Board | |
| Charts:- Daily , Weekly | |
| Add RF to Watchlist: View: Get Complete RF Trend Analysis ➞ | |
 | STT State Street Corporation |
| Sector: Financials | |
| SubSector: Asset Management | |
| MarketCap: 18623 Millions | |
| Recent Price: 72.49 Smart Investing & Trading Score: 0 | |
| Day Percent Change: -2.03% Day Change: -1.50 | |
| Week Change: -1.23% Year-to-date Change: -6.4% | |
| STT Links: Profile News Message Board | |
| Charts:- Daily , Weekly | |
| Add STT to Watchlist: View: Get Complete STT Trend Analysis ➞ | |
 | SLM SLM Corporation |
| Sector: Financials | |
| SubSector: Credit Services | |
| MarketCap: 3099.78 Millions | |
| Recent Price: 21.19 Smart Investing & Trading Score: 58 | |
| Day Percent Change: -2.03% Day Change: -0.44 | |
| Week Change: -3.24% Year-to-date Change: 10.8% | |
| SLM Links: Profile News Message Board | |
| Charts:- Daily , Weekly | |
| Add SLM to Watchlist: View: Get Complete SLM Trend Analysis ➞ | |
 | MTD Mettler-Toledo International Inc. |
| Sector: Health Care | |
| SubSector: Medical Instruments & Supplies | |
| MarketCap: 15973.1 Millions | |
| Recent Price: 1229.70 Smart Investing & Trading Score: 61 | |
| Day Percent Change: -2.03% Day Change: -25.54 | |
| Week Change: -0.68% Year-to-date Change: 1.4% | |
| MTD Links: Profile News Message Board | |
| Charts:- Daily , Weekly | |
| Add MTD to Watchlist: View: Get Complete MTD Trend Analysis ➞ | |
| For tabular summary view of above stock list: Summary View ➞ 0 - 25 , 25 - 50 , 50 - 75 , 75 - 100 , 100 - 125 , 125 - 150 , 150 - 175 , 175 - 200 , 200 - 225 , 225 - 250 , 250 - 275 , 275 - 300 , 300 - 325 , 325 - 350 , 350 - 375 , 375 - 400 , 400 - 425 , 425 - 450 , 450 - 475 , 475 - 500 , 500 - 525 , 525 - 550 , 550 - 575 , 575 - 600 , 600 - 625 , 625 - 650 , 650 - 675 , 675 - 700 , 700 - 725 , 725 - 750 , 750 - 775 | ||
| Click To Change The Sort Order: By Market Cap or Company Size Performance: Year-to-date, Week and Day | |
| Select Chart Type: | ||
|
Best Stocks Today 12Stocks.com |
© 2024 12Stocks.com Terms & Conditions Privacy Contact Us
All Information Provided Only For Education And Not To Be Used For Investing or Trading. See Terms & Conditions


One More Thing ... Get Best Stocks Delivered Daily!
Never Ever Miss A Move With Our Top Ten Stocks Lists
Find Best Stocks In Any Market - Bull or Bear Market
Take A Peek At Our Top Ten Stocks Lists: Daily, Weekly, Year-to-Date & Top Trends
Find Best Stocks In Any Market - Bull or Bear Market
Take A Peek At Our Top Ten Stocks Lists: Daily, Weekly, Year-to-Date & Top Trends
Midcap Stocks With Best Up Trends [0-bearish to 100-bullish]: Tenet [100], Sensata Technologies[100], Leidos [100], Corning [100], Zebra Technologies[100], Timken [100], CAVA [100], Mosaic [100], Federal Realty[100], Public Service[100], DaVita [100]
Best Midcap Stocks Year-to-Date:
Vistra Energy[96.88%], AppLovin [77.26%], ShockWave Medical[73.27%], EMCOR [65.79%], CAVA [65.46%], Constellation Energy[58.77%], Wingstop [49.97%], Antero Resources[49.96%], Spotify [49.24%], Tenet [48.59%], Natera [48.28%] Best Midcap Stocks This Week:
Tenet [16.81%], agilon health[10%], Sensata Technologies[9.52%], Woodward [7.82%], Leidos [7.56%], Corning [6.54%], Maravai LifeSciences[6.49%], 10x Genomics[6.13%], Domino s[6.05%], Zebra Technologies[5.84%], Timken [4.99%] Best Midcap Stocks Daily:
Tenet [13.25%], Woodward [7.47%], agilon health[7.21%], Sensata Technologies[7.13%], Leidos [6.53%], Corning [5.03%], Zebra Technologies[4.85%], Maravai LifeSciences[4.46%], 10x Genomics[3.10%], Quidel [3.02%], Timken [2.91%]