
 Login Sign Up


| |||||
 |  | ||||

| 12Stocks.com Market Intelligence |
Best MidCap Stocks
|
| In a hurry? Mid Cap Stocks Lists: Performance Trends Table, Stock Charts
Sort midcap stocks: Daily, Weekly, Year-to-Date, Market Cap & Trends. Filter midcap stocks list by sector: Show all, Tech, Finance, Energy, Staples, Retail, Industrial, Materials, Utilities and HealthCare Filter midcap stocks list by size:All MidCap Large Mid-Range Small |
| 12Stocks.com Mid Cap Stocks Performances & Trends Daily | |||||||||
|
|  The overall Smart Investing & Trading Score is 36 (0-bearish to 100-bullish) which puts Mid Cap index in short term bearish to neutral trend. The Smart Investing & Trading Score from previous trading session is 26 and an improvement of trend continues.
| ||||||||
Here are the Smart Investing & Trading Scores of the most requested mid cap stocks at 12Stocks.com (click stock name for detailed review):
|


| 12Stocks.com: Top Performing Mid Cap Index Stocks | ||||||||||||||||||||||||||||||||||||||||||||||||
 The top performing Mid Cap Index stocks year to date are
Now, more recently, over last week, the top performing Mid Cap Index stocks on the move are


|
||||||||||||||||||||||||||||||||||||||||||||||||
| 12Stocks.com: Investing in Midcap Index with Stocks | |
|
The following table helps investors and traders sort through current performance and trends (as measured by Smart Investing & Trading Score) of various
stocks in the Midcap Index. Quick View: Move mouse or cursor over stock symbol (ticker) to view short-term technical chart and over stock name to view long term chart. Click on  to add stock symbol to your watchlist and to add stock symbol to your watchlist and  to view watchlist. Click on any ticker or stock name for detailed market intelligence report for that stock. to view watchlist. Click on any ticker or stock name for detailed market intelligence report for that stock. |
12Stocks.com Performance of Stocks in Midcap Index
| Ticker | Stock Name | Watchlist | Category | Recent Price | Smart Investing & Trading Score | Change % | YTD Change% |
| HES | Hess |   | Energy | 154.35 | 76 | 1.69 | 7.07% |
| MKC | McCormick & | | Consumer Staples | 73.92 | 73 | 1.68 | 8.04% |
| OMF | OneMain | | Financials | 48.70 | 63 | 1.67 | -1.02% |
| VMI | Valmont Industries | | Industrials | 213.20 | 27 | 1.66 | -8.70% |
| AGO | Assured Guaranty | | Financials | 77.52 | 10 | 1.65 | 3.59% |
| AXS | AXIS Capital | | Financials | 62.47 | 68 | 1.63 | 12.82% |
| UI | Ubiquiti | | Technology | 106.67 | 27 | 1.62 | -23.57% |
| BJ | BJ s | | Services & Goods | 73.74 | 36 | 1.61 | 10.62% |
| BPOP | Popular | | Financials | 83.15 | 32 | 1.61 | 1.32% |
| SPB | Spectrum | | Consumer Staples | 80.37 | 38 | 1.61 | 0.75% |
| STAG | STAG Industrial | | Financials | 34.93 | 10 | 1.60 | -11.03% |
| EVRG | Evergy | | Utilities | 51.77 | 73 | 1.59 | -0.82% |
| CBOE | Cboe Global | | Financials | 180.40 | 42 | 1.58 | 1.03% |
| JEF | Jefferies Financial | | Financials | 42.17 | 58 | 1.57 | 4.36% |
| TKR | Timken | | Industrials | 85.50 | 54 | 1.56 | 6.67% |
| CTVA | Corteva | | Materials | 54.80 | 68 | 1.56 | 14.36% |
| FMC | FMC | | Materials | 57.82 | 68 | 1.55 | -8.30% |
| LNC | Loln National | | Financials | 27.65 | 55 | 1.54 | 2.52% |
| THO | Thor Industries | | Consumer Staples | 99.38 | 17 | 1.51 | -15.96% |
| PPL | PPL | | Utilities | 27.02 | 68 | 1.50 | -0.30% |
| KSS | Kohl s | | Services & Goods | 23.19 | 32 | 1.49 | -19.14% |
| SLM | SLM | | Financials | 21.09 | 68 | 1.49 | 10.30% |
| K | Kellogg | | Consumer Staples | 57.38 | 86 | 1.49 | 2.63% |
| AR | Antero Resources | | Energy | 29.29 | 61 | 1.49 | 29.14% |
| RUN | Sunrun | | Technology | 10.26 | 18 | 1.48 | -47.73% |
| For chart view version of above stock list: Chart View ➞ 0 - 25 , 25 - 50 , 50 - 75 , 75 - 100 , 100 - 125 , 125 - 150 , 150 - 175 , 175 - 200 , 200 - 225 , 225 - 250 , 250 - 275 , 275 - 300 , 300 - 325 , 325 - 350 , 350 - 375 , 375 - 400 , 400 - 425 , 425 - 450 , 450 - 475 , 475 - 500 , 500 - 525 , 525 - 550 , 550 - 575 , 575 - 600 , 600 - 625 , 625 - 650 , 650 - 675 , 675 - 700 , 700 - 725 , 725 - 750 , 750 - 775 | ||
 | Click To Change The Sort Order: By Market Cap or Company Size Performance: Year-to-date, Week and Day |  |
|
Get the most comprehensive stock market coverage daily at 12Stocks.com ➞ Best Stocks Today ➞ Best Stocks Weekly ➞ Best Stocks Year-to-Date ➞ Best Stocks Trends ➞  Best Stocks Today 12Stocks.com Best Nasdaq Stocks ➞ Best S&P 500 Stocks ➞ Best Tech Stocks ➞ Best Biotech Stocks ➞ |
| Detailed Overview of Midcap Stocks |
| Midcap Technical Overview, Leaders & Laggards, Top Midcap ETF Funds & Detailed Midcap Stocks List, Charts, Trends & More |
| Midcap: Technical Analysis, Trends & YTD Performance | |
| MidCap segment as represented by
MDY, an exchange-traded fund [ETF], holds basket of about four hundred midcap stocks from across all major sectors of the US stock market. The midcap index (contains stocks like Green Mountain Coffee Roasters and Tractor Supply Company) is up by 2.15% and is currently underperforming the overall market by -1.23% year-to-date. Below is a quick view of technical charts and trends: | |
 MDY Weekly Chart |
|
| Long Term Trend: Good | |
| Medium Term Trend: Not Good | |
 MDY Daily Chart |
|
| Short Term Trend: Deteriorating | |
| Overall Trend Score: 36 | |
| YTD Performance: 2.15% | |
| **Trend Scores & Views Are Only For Educational Purposes And Not For Investing | |
| 12Stocks.com: Investing in Midcap Index using Exchange Traded Funds | |
|
The following table shows list of key exchange traded funds (ETF) that
help investors track Midcap index. The following list also includes leveraged ETF funds that track twice or thrice the daily returns of Midcap indices. Short or inverse ETF funds move in the opposite direction to the index they track and are useful during market pullbacks or during bear markets. Quick View: Move mouse or cursor over ETF symbol (ticker) to view short-term technical chart and over ETF name to view long term chart. Click on ticker or stock name for detailed view. Click on to add stock symbol to your watchlist and to view watchlist. |
12Stocks.com List of ETFs that track Midcap Index
| Ticker | ETF Name | Watchlist | Recent Price | Smart Investing & Trading Score | Change % | Week % | Year-to-date % |
| IJH | iShares Core S&P Mid-Cap | | 56.58 | 36 | 0.27 | -2.26 | 2.07% |
| IWR | iShares Russell Mid-Cap | | 78.66 | 36 | -0.06 | -2.43 | 1.2% |
| IWP | iShares Russell Mid-Cap Growth | | 105.70 | 36 | -0.75 | -3.77 | 1.19% |
| MDY | SPDR S&P MidCap 400 ETF | | 518.28 | 36 | 0.33 | -2.2 | 2.15% |
| IWS | iShares Russell Mid-Cap Value | | 117.65 | 41 | 0.29 | -1.87 | 1.17% |
| IJK | iShares S&P Mid-Cap 400 Growth | | 84.85 | 36 | -0.21 | -3.01 | 7.11% |
| IJJ | iShares S&P Mid-Cap 400 Value | | 110.55 | 17 | 1.00 | -1.29 | -3.06% |
| XMLV | PowerShares S&P MidCap Low Volatil ETF | | 54.16 | 53 | 1.06 | -0.17 | 1.84% |
| MVV | ProShares Ultra MidCap400 | | 58.69 | 36 | 0.46 | -4.92 | 1.38% |
| SMDD | ProShares UltraPro Short MidCap400 | | 12.68 | 59 | -0.08 | 7.91 | -5.82% |
| MZZ | ProShares UltraShort MidCap400 | | 12.24 | 34 | 0.08 | 5.52 | -2.63% |
| UMDD | ProShares UltraPro MidCap400 | | 22.57 | 36 | 1.20 | -6.61 | 1.14% |
| MYY | ProShares Short MidCap400 | | 21.23 | 69 | -0.14 | 2.55 | -1.05% |
| 12Stocks.com: Charts, Trends, Fundamental Data and Performances of MidCap Stocks | |
|
We now take in-depth look at all MidCap stocks including charts, multi-period performances and overall trends (as measured by Smart Investing & Trading Score). One can sort MidCap stocks (click link to choose) by Daily, Weekly and by Year-to-Date performances. Also, one can sort by size of the company or by market capitalization. |
| Select Your Default Chart Type: | |||||
| |||||
| Click on stock symbol or name for detailed view. Click on to add stock symbol to your watchlist and to view watchlist. Quick View: Move mouse or cursor over "Daily" to quickly view daily technical stock chart and over "Weekly" to view weekly technical stock chart. | |||||

 | HES Hess Corporation |
| Sector: Energy | |
| SubSector: Independent Oil & Gas | |
| MarketCap: 10465.3 Millions | |
| Recent Price: 154.35 Smart Investing & Trading Score: 76 | |
| Day Percent Change: 1.69% Day Change: 2.57 | |
| Week Change: 0.74% Year-to-date Change: 7.1% | |
| HES Links: Profile News Message Board | |
| Charts:- Daily , Weekly | |
| Add HES to Watchlist: View: Get Complete HES Trend Analysis ➞ | |
 | MKC McCormick & Company, Incorporated |
| Sector: Consumer Staples | |
| SubSector: Processed & Packaged Goods | |
| MarketCap: 18522.8 Millions | |
| Recent Price: 73.92 Smart Investing & Trading Score: 73 | |
| Day Percent Change: 1.68% Day Change: 1.22 | |
| Week Change: 3.01% Year-to-date Change: 8.0% | |
| MKC Links: Profile News Message Board | |
| Charts:- Daily , Weekly | |
| Add MKC to Watchlist: View: Get Complete MKC Trend Analysis ➞ | |
 | OMF OneMain Holdings, Inc. |
| Sector: Financials | |
| SubSector: Credit Services | |
| MarketCap: 2753.38 Millions | |
| Recent Price: 48.70 Smart Investing & Trading Score: 63 | |
| Day Percent Change: 1.67% Day Change: 0.80 | |
| Week Change: 4.24% Year-to-date Change: -1.0% | |
| OMF Links: Profile News Message Board | |
| Charts:- Daily , Weekly | |
| Add OMF to Watchlist: View: Get Complete OMF Trend Analysis ➞ | |
 | VMI Valmont Industries, Inc. |
| Sector: Industrials | |
| SubSector: Metal Fabrication | |
| MarketCap: 2251.6 Millions | |
| Recent Price: 213.20 Smart Investing & Trading Score: 27 | |
| Day Percent Change: 1.66% Day Change: 3.48 | |
| Week Change: -1.93% Year-to-date Change: -8.7% | |
| VMI Links: Profile News Message Board | |
| Charts:- Daily , Weekly | |
| Add VMI to Watchlist: View: Get Complete VMI Trend Analysis ➞ | |
 | AGO Assured Guaranty Ltd. |
| Sector: Financials | |
| SubSector: Surety & Title Insurance | |
| MarketCap: 2133.18 Millions | |
| Recent Price: 77.52 Smart Investing & Trading Score: 10 | |
| Day Percent Change: 1.65% Day Change: 1.26 | |
| Week Change: -2.42% Year-to-date Change: 3.6% | |
| AGO Links: Profile News Message Board | |
| Charts:- Daily , Weekly | |
| Add AGO to Watchlist: View: Get Complete AGO Trend Analysis ➞ | |
 | AXS AXIS Capital Holdings Limited |
| Sector: Financials | |
| SubSector: Property & Casualty Insurance | |
| MarketCap: 3709.12 Millions | |
| Recent Price: 62.47 Smart Investing & Trading Score: 68 | |
| Day Percent Change: 1.63% Day Change: 1.00 | |
| Week Change: 0.9% Year-to-date Change: 12.8% | |
| AXS Links: Profile News Message Board | |
| Charts:- Daily , Weekly | |
| Add AXS to Watchlist: View: Get Complete AXS Trend Analysis ➞ | |
 | UI Ubiquiti Inc. |
| Sector: Technology | |
| SubSector: Communication Equipment | |
| MarketCap: 9526.89 Millions | |
| Recent Price: 106.67 Smart Investing & Trading Score: 27 | |
| Day Percent Change: 1.62% Day Change: 1.70 | |
| Week Change: -1.49% Year-to-date Change: -23.6% | |
| UI Links: Profile News Message Board | |
| Charts:- Daily , Weekly | |
| Add UI to Watchlist: View: Get Complete UI Trend Analysis ➞ | |
 | BJ BJ s Wholesale Club Holdings, Inc. |
| Sector: Services & Goods | |
| SubSector: Discount, Variety Stores | |
| MarketCap: 3346.02 Millions | |
| Recent Price: 73.74 Smart Investing & Trading Score: 36 | |
| Day Percent Change: 1.61% Day Change: 1.17 | |
| Week Change: -4.26% Year-to-date Change: 10.6% | |
| BJ Links: Profile News Message Board | |
| Charts:- Daily , Weekly | |
| Add BJ to Watchlist: View: Get Complete BJ Trend Analysis ➞ | |
 | BPOP Popular, Inc. |
| Sector: Financials | |
| SubSector: Foreign Regional Banks | |
| MarketCap: 2671.99 Millions | |
| Recent Price: 83.15 Smart Investing & Trading Score: 32 | |
| Day Percent Change: 1.61% Day Change: 1.32 | |
| Week Change: 0.48% Year-to-date Change: 1.3% | |
| BPOP Links: Profile News Message Board | |
| Charts:- Daily , Weekly | |
| Add BPOP to Watchlist: View: Get Complete BPOP Trend Analysis ➞ | |
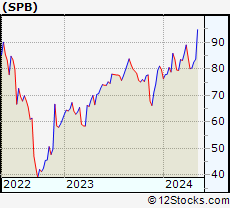 | SPB Spectrum Brands Holdings, Inc. |
| Sector: Consumer Staples | |
| SubSector: Personal Products | |
| MarketCap: 1460.85 Millions | |
| Recent Price: 80.37 Smart Investing & Trading Score: 38 | |
| Day Percent Change: 1.61% Day Change: 1.27 | |
| Week Change: 0.37% Year-to-date Change: 0.8% | |
| SPB Links: Profile News Message Board | |
| Charts:- Daily , Weekly | |
| Add SPB to Watchlist: View: Get Complete SPB Trend Analysis ➞ | |
 | STAG STAG Industrial, Inc. |
| Sector: Financials | |
| SubSector: REIT - Industrial | |
| MarketCap: 3767.49 Millions | |
| Recent Price: 34.93 Smart Investing & Trading Score: 10 | |
| Day Percent Change: 1.60% Day Change: 0.55 | |
| Week Change: -5.82% Year-to-date Change: -11.0% | |
| STAG Links: Profile News Message Board | |
| Charts:- Daily , Weekly | |
| Add STAG to Watchlist: View: Get Complete STAG Trend Analysis ➞ | |
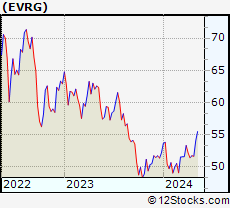 | EVRG Evergy, Inc. |
| Sector: Utilities | |
| SubSector: Electric Utilities | |
| MarketCap: 11914.8 Millions | |
| Recent Price: 51.77 Smart Investing & Trading Score: 73 | |
| Day Percent Change: 1.59% Day Change: 0.81 | |
| Week Change: 0.6% Year-to-date Change: -0.8% | |
| EVRG Links: Profile News Message Board | |
| Charts:- Daily , Weekly | |
| Add EVRG to Watchlist: View: Get Complete EVRG Trend Analysis ➞ | |
 | CBOE Cboe Global Markets, Inc. |
| Sector: Financials | |
| SubSector: Diversified Investments | |
| MarketCap: 8834.5 Millions | |
| Recent Price: 180.40 Smart Investing & Trading Score: 42 | |
| Day Percent Change: 1.58% Day Change: 2.80 | |
| Week Change: 1.06% Year-to-date Change: 1.0% | |
| CBOE Links: Profile News Message Board | |
| Charts:- Daily , Weekly | |
| Add CBOE to Watchlist: View: Get Complete CBOE Trend Analysis ➞ | |
 | JEF Jefferies Financial Group Inc. |
| Sector: Financials | |
| SubSector: Investment Brokerage - Regional | |
| MarketCap: 3987.15 Millions | |
| Recent Price: 42.17 Smart Investing & Trading Score: 58 | |
| Day Percent Change: 1.57% Day Change: 0.65 | |
| Week Change: 0.89% Year-to-date Change: 4.4% | |
| JEF Links: Profile News Message Board | |
| Charts:- Daily , Weekly | |
| Add JEF to Watchlist: View: Get Complete JEF Trend Analysis ➞ | |
 | TKR The Timken Company |
| Sector: Industrials | |
| SubSector: Machine Tools & Accessories | |
| MarketCap: 2277.48 Millions | |
| Recent Price: 85.50 Smart Investing & Trading Score: 54 | |
| Day Percent Change: 1.56% Day Change: 1.31 | |
| Week Change: 0.83% Year-to-date Change: 6.7% | |
| TKR Links: Profile News Message Board | |
| Charts:- Daily , Weekly | |
| Add TKR to Watchlist: View: Get Complete TKR Trend Analysis ➞ | |
 | CTVA Corteva, Inc. |
| Sector: Materials | |
| SubSector: Agricultural Chemicals | |
| MarketCap: 18894.3 Millions | |
| Recent Price: 54.80 Smart Investing & Trading Score: 68 | |
| Day Percent Change: 1.56% Day Change: 0.84 | |
| Week Change: 1.93% Year-to-date Change: 14.4% | |
| CTVA Links: Profile News Message Board | |
| Charts:- Daily , Weekly | |
| Add CTVA to Watchlist: View: Get Complete CTVA Trend Analysis ➞ | |
 | FMC FMC Corporation |
| Sector: Materials | |
| SubSector: Chemicals - Major Diversified | |
| MarketCap: 9068.36 Millions | |
| Recent Price: 57.82 Smart Investing & Trading Score: 68 | |
| Day Percent Change: 1.55% Day Change: 0.88 | |
| Week Change: 1.89% Year-to-date Change: -8.3% | |
| FMC Links: Profile News Message Board | |
| Charts:- Daily , Weekly | |
| Add FMC to Watchlist: View: Get Complete FMC Trend Analysis ➞ | |
 | LNC Lincoln National Corporation |
| Sector: Financials | |
| SubSector: Life Insurance | |
| MarketCap: 4545.26 Millions | |
| Recent Price: 27.65 Smart Investing & Trading Score: 55 | |
| Day Percent Change: 1.54% Day Change: 0.42 | |
| Week Change: -2.23% Year-to-date Change: 2.5% | |
| LNC Links: Profile News Message Board | |
| Charts:- Daily , Weekly | |
| Add LNC to Watchlist: View: Get Complete LNC Trend Analysis ➞ | |
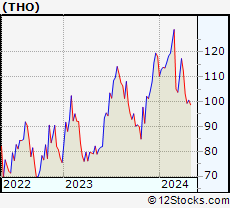 | THO Thor Industries, Inc. |
| Sector: Consumer Staples | |
| SubSector: Recreational Vehicles | |
| MarketCap: 2279.29 Millions | |
| Recent Price: 99.38 Smart Investing & Trading Score: 17 | |
| Day Percent Change: 1.51% Day Change: 1.48 | |
| Week Change: -3.65% Year-to-date Change: -16.0% | |
| THO Links: Profile News Message Board | |
| Charts:- Daily , Weekly | |
| Add THO to Watchlist: View: Get Complete THO Trend Analysis ➞ | |
 | PPL PPL Corporation |
| Sector: Utilities | |
| SubSector: Electric Utilities | |
| MarketCap: 16588.8 Millions | |
| Recent Price: 27.02 Smart Investing & Trading Score: 68 | |
| Day Percent Change: 1.50% Day Change: 0.40 | |
| Week Change: 1.46% Year-to-date Change: -0.3% | |
| PPL Links: Profile News Message Board | |
| Charts:- Daily , Weekly | |
| Add PPL to Watchlist: View: Get Complete PPL Trend Analysis ➞ | |
 | KSS Kohl s Corporation |
| Sector: Services & Goods | |
| SubSector: Department Stores | |
| MarketCap: 3068 Millions | |
| Recent Price: 23.19 Smart Investing & Trading Score: 32 | |
| Day Percent Change: 1.49% Day Change: 0.34 | |
| Week Change: 2.02% Year-to-date Change: -19.1% | |
| KSS Links: Profile News Message Board | |
| Charts:- Daily , Weekly | |
| Add KSS to Watchlist: View: Get Complete KSS Trend Analysis ➞ | |
 | SLM SLM Corporation |
| Sector: Financials | |
| SubSector: Credit Services | |
| MarketCap: 3099.78 Millions | |
| Recent Price: 21.09 Smart Investing & Trading Score: 68 | |
| Day Percent Change: 1.49% Day Change: 0.31 | |
| Week Change: 2.03% Year-to-date Change: 10.3% | |
| SLM Links: Profile News Message Board | |
| Charts:- Daily , Weekly | |
| Add SLM to Watchlist: View: Get Complete SLM Trend Analysis ➞ | |
 | K Kellogg Company |
| Sector: Consumer Staples | |
| SubSector: Processed & Packaged Goods | |
| MarketCap: 20264.6 Millions | |
| Recent Price: 57.38 Smart Investing & Trading Score: 86 | |
| Day Percent Change: 1.49% Day Change: 0.84 | |
| Week Change: 3.54% Year-to-date Change: 2.6% | |
| K Links: Profile News Message Board | |
| Charts:- Daily , Weekly | |
| Add K to Watchlist: View: Get Complete K Trend Analysis ➞ | |
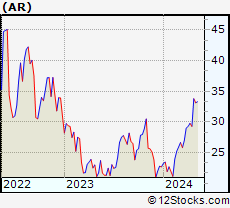 | AR Antero Resources Corporation |
| Sector: Energy | |
| SubSector: Oil & Gas Drilling & Exploration | |
| MarketCap: 256.939 Millions | |
| Recent Price: 29.29 Smart Investing & Trading Score: 61 | |
| Day Percent Change: 1.49% Day Change: 0.43 | |
| Week Change: -1.68% Year-to-date Change: 29.1% | |
| AR Links: Profile News Message Board | |
| Charts:- Daily , Weekly | |
| Add AR to Watchlist: View: Get Complete AR Trend Analysis ➞ | |
 | RUN Sunrun Inc. |
| Sector: Technology | |
| SubSector: Semiconductor - Specialized | |
| MarketCap: 1286.2 Millions | |
| Recent Price: 10.26 Smart Investing & Trading Score: 18 | |
| Day Percent Change: 1.48% Day Change: 0.15 | |
| Week Change: -11.86% Year-to-date Change: -47.7% | |
| RUN Links: Profile News Message Board | |
| Charts:- Daily , Weekly | |
| Add RUN to Watchlist: View: Get Complete RUN Trend Analysis ➞ | |
| For tabular summary view of above stock list: Summary View ➞ 0 - 25 , 25 - 50 , 50 - 75 , 75 - 100 , 100 - 125 , 125 - 150 , 150 - 175 , 175 - 200 , 200 - 225 , 225 - 250 , 250 - 275 , 275 - 300 , 300 - 325 , 325 - 350 , 350 - 375 , 375 - 400 , 400 - 425 , 425 - 450 , 450 - 475 , 475 - 500 , 500 - 525 , 525 - 550 , 550 - 575 , 575 - 600 , 600 - 625 , 625 - 650 , 650 - 675 , 675 - 700 , 700 - 725 , 725 - 750 , 750 - 775 | ||
| Click To Change The Sort Order: By Market Cap or Company Size Performance: Year-to-date, Week and Day | |
| Select Chart Type: | ||
|
Best Stocks Today 12Stocks.com |
© 2024 12Stocks.com Terms & Conditions Privacy Contact Us
All Information Provided Only For Education And Not To Be Used For Investing or Trading. See Terms & Conditions


One More Thing ... Get Best Stocks Delivered Daily!
Never Ever Miss A Move With Our Top Ten Stocks Lists
Find Best Stocks In Any Market - Bull or Bear Market
Take A Peek At Our Top Ten Stocks Lists: Daily, Weekly, Year-to-Date & Top Trends
Find Best Stocks In Any Market - Bull or Bear Market
Take A Peek At Our Top Ten Stocks Lists: Daily, Weekly, Year-to-Date & Top Trends
Midcap Stocks With Best Up Trends [0-bearish to 100-bullish]: UGI [100], Entergy [100], Bunge [100], Flowers Foods[100], Genuine Parts[100], Alaska Air[100], Consolidated Edison[100], Conagra [100], United Airlines[100], Virtu Financial[95], Tyson Foods[95]
Best Midcap Stocks Year-to-Date:
ShockWave Medical[72.66%], Vistra Energy[70.46%], AppLovin [67.63%], EMCOR [52.55%], Constellation Energy[52.26%], Spotify [46.79%], Pure Storage[38.7%], Williams-Sonoma [38.37%], CAVA [36.59%], Coupang [36.39%], Natera [36.14%] Best Midcap Stocks This Week:
United Airlines[22.94%], AMC Entertainment[19.25%], agilon health[15.56%], Globe Life[12.95%], Genuine Parts[11.7%], Advance Auto[11.62%], Iridium [11.07%], Medical Properties[10.78%], UGI [9.72%], Alaska Air[8.98%], Flowers Foods[8.66%] Best Midcap Stocks Daily:
agilon health[9.06%], AMC Entertainment[8.22%], UGI [8.20%], Hawaiian Electric[6.86%], Fifth Third[5.86%], Iridium [5.14%], SSR Mining[3.99%], Walgreens Boots[3.75%], Darling Ingredients[3.47%], Citizens Financial[3.31%], J. M.[3.29%]