
 Login Sign Up


| |||||
 |  | ||||

| 12Stocks.com Market Intelligence |
Best MidCap Stocks
|
| In a hurry? Mid Cap Stocks Lists: Performance Trends Table, Stock Charts
Sort midcap stocks: Daily, Weekly, Year-to-Date, Market Cap & Trends. Filter midcap stocks list by sector: Show all, Tech, Finance, Energy, Staples, Retail, Industrial, Materials, Utilities and HealthCare Filter midcap stocks list by size:All MidCap Large Mid-Range Small |
| 12Stocks.com Mid Cap Stocks Performances & Trends Daily | |||||||||
|
|  The overall Smart Investing & Trading Score is 26 (0-bearish to 100-bullish) which puts Mid Cap index in short term bearish to neutral trend. The Smart Investing & Trading Score from previous trading session is 31 and a deterioration of trend continues.
| ||||||||
Here are the Smart Investing & Trading Scores of the most requested mid cap stocks at 12Stocks.com (click stock name for detailed review):
|


| 12Stocks.com: Top Performing Mid Cap Index Stocks | ||||||||||||||||||||||||||||||||||||||||||||||||
 The top performing Mid Cap Index stocks year to date are
Now, more recently, over last week, the top performing Mid Cap Index stocks on the move are


|
||||||||||||||||||||||||||||||||||||||||||||||||
| 12Stocks.com: Investing in Midcap Index with Stocks | |
|
The following table helps investors and traders sort through current performance and trends (as measured by Smart Investing & Trading Score) of various
stocks in the Midcap Index. Quick View: Move mouse or cursor over stock symbol (ticker) to view short-term technical chart and over stock name to view long term chart. Click on  to add stock symbol to your watchlist and to add stock symbol to your watchlist and  to view watchlist. Click on any ticker or stock name for detailed market intelligence report for that stock. to view watchlist. Click on any ticker or stock name for detailed market intelligence report for that stock. |
12Stocks.com Performance of Stocks in Midcap Index
| Ticker | Stock Name | Watchlist | Category | Recent Price | Smart Investing & Trading Score | Change % | YTD Change% |
| VAC | Marriott Vacations |   | Services & Goods | 97.67 | 61 | -0.14 | 15.05% |
| CC | Chemours | | Materials | 26.37 | 60 | -0.15 | -16.39% |
| EXPE | Expedia | | Services & Goods | 128.73 | 7 | -0.16 | -15.19% |
| SJM | J. M. | | Consumer Staples | 109.80 | 18 | -0.16 | -13.12% |
| SMG | Scotts Miracle-Gro | | Materials | 67.70 | 43 | -0.16 | 6.20% |
| RBA | Ritchie Bros. | | Services & Goods | 73.21 | 56 | -0.16 | 9.45% |
| UA | Under Armour | | Services & Goods | 6.30 | 25 | -0.16 | -24.55% |
| AXON | Axovant Sciences | | Health Care | 299.82 | 26 | -0.16 | 16.06% |
| AFRM | Affirm | | Technology | 30.87 | 7 | -0.16 | -36.95% |
| GLPI | Gaming and | | Financials | 42.03 | 10 | -0.17 | -14.83% |
| TDY | Teledyne Technologies | | Technology | 400.27 | 18 | -0.18 | -10.31% |
| FNF | Fidelity National | | Financials | 47.02 | 10 | -0.19 | -7.84% |
| EA | Electronic Arts | | Technology | 126.31 | 0 | -0.19 | -7.67% |
| KNSL | Kinsale Capital | | Financials | 451.41 | 58 | -0.19 | 34.79% |
| DT | Dynatrace | | Technology | 44.43 | 17 | -0.20 | -18.76% |
| TRU | TransUnion | | Services & Goods | 69.63 | 13 | -0.20 | 1.34% |
| AFL | Aflac | | Financials | 80.26 | 25 | -0.21 | -2.72% |
| DHI | D.R. Horton | | Industrials | 145.74 | 43 | -0.21 | -4.11% |
| MDU | MDU Resources | | Industrials | 23.56 | 43 | -0.21 | 18.99% |
| INGR | Ingredion | | Consumer Staples | 111.29 | 58 | -0.21 | 2.54% |
| FAF | First American | | Financials | 54.99 | 0 | -0.22 | -14.66% |
| PRU | Prudential Financial | | Financials | 107.35 | 36 | -0.22 | 3.51% |
| LDOS | Leidos | | Technology | 124.36 | 41 | -0.22 | 14.89% |
| OWL | Blue Owl | | Financials | 18.31 | 38 | -0.22 | 22.97% |
| RGA | Reinsurance | | Financials | 180.15 | 36 | -0.23 | 11.35% |
| For chart view version of above stock list: Chart View ➞ 0 - 25 , 25 - 50 , 50 - 75 , 75 - 100 , 100 - 125 , 125 - 150 , 150 - 175 , 175 - 200 , 200 - 225 , 225 - 250 , 250 - 275 , 275 - 300 , 300 - 325 , 325 - 350 , 350 - 375 , 375 - 400 , 400 - 425 , 425 - 450 , 450 - 475 , 475 - 500 , 500 - 525 , 525 - 550 , 550 - 575 , 575 - 600 , 600 - 625 , 625 - 650 , 650 - 675 , 675 - 700 , 700 - 725 , 725 - 750 , 750 - 775 | ||
 | Click To Change The Sort Order: By Market Cap or Company Size Performance: Year-to-date, Week and Day |  |
|
Get the most comprehensive stock market coverage daily at 12Stocks.com ➞ Best Stocks Today ➞ Best Stocks Weekly ➞ Best Stocks Year-to-Date ➞ Best Stocks Trends ➞  Best Stocks Today 12Stocks.com Best Nasdaq Stocks ➞ Best S&P 500 Stocks ➞ Best Tech Stocks ➞ Best Biotech Stocks ➞ |
| Detailed Overview of Midcap Stocks |
| Midcap Technical Overview, Leaders & Laggards, Top Midcap ETF Funds & Detailed Midcap Stocks List, Charts, Trends & More |
| Midcap: Technical Analysis, Trends & YTD Performance | |
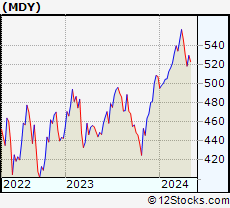
| MidCap segment as represented by
MDY, an exchange-traded fund [ETF], holds basket of about four hundred midcap stocks from across all major sectors of the US stock market. The midcap index (contains stocks like Green Mountain Coffee Roasters and Tractor Supply Company) is up by 1.95% and is currently underperforming the overall market by -2.46% year-to-date. Below is a quick view of technical charts and trends: | |
 MDY Weekly Chart |
|
| Long Term Trend: Good | |
| Medium Term Trend: Not Good | |
 MDY Daily Chart |
|
| Short Term Trend: Not Good | |
| Overall Trend Score: 26 | |
| YTD Performance: 1.95% | |
| **Trend Scores & Views Are Only For Educational Purposes And Not For Investing | |
| 12Stocks.com: Investing in Midcap Index using Exchange Traded Funds | |
|
The following table shows list of key exchange traded funds (ETF) that
help investors track Midcap index. The following list also includes leveraged ETF funds that track twice or thrice the daily returns of Midcap indices. Short or inverse ETF funds move in the opposite direction to the index they track and are useful during market pullbacks or during bear markets. Quick View: Move mouse or cursor over ETF symbol (ticker) to view short-term technical chart and over ETF name to view long term chart. Click on ticker or stock name for detailed view. Click on to add stock symbol to your watchlist and to view watchlist. |
12Stocks.com List of ETFs that track Midcap Index
| Ticker | ETF Name | Watchlist | Recent Price | Smart Investing & Trading Score | Change % | Week % | Year-to-date % |
| IJH | iShares Core S&P Mid-Cap | | 56.51 | 41 | -0.65 | -2.38 | 1.95% |
| IWR | iShares Russell Mid-Cap | | 78.82 | 43 | -0.35 | -2.23 | 1.4% |
| IWP | iShares Russell Mid-Cap Growth | | 107.02 | 36 | -0.67 | -2.57 | 2.45% |
| MDY | SPDR S&P MidCap 400 ETF | | 517.25 | 26 | -0.84 | -2.39 | 1.95% |
| IJK | iShares S&P Mid-Cap 400 Growth | | 85.34 | 41 | -0.88 | -2.45 | 7.73% |
| IWS | iShares Russell Mid-Cap Value | | 117.41 | 48 | -0.10 | -2.07 | 0.96% |
| IJJ | iShares S&P Mid-Cap 400 Value | | 109.44 | 23 | -0.69 | -2.28 | -4.03% |
| XMLV | PowerShares S&P MidCap Low Volatil ETF | | 53.37 | 46 | -0.58 | -1.62 | 0.36% |
| MVV | ProShares Ultra MidCap400 | | 58.83 | 31 | -1.97 | -4.7 | 1.62% |
| UMDD | ProShares UltraPro MidCap400 | | 22.45 | 26 | -2.52 | -7.12 | 0.58% |
| SMDD | ProShares UltraPro Short MidCap400 | | 12.54 | 57 | 2.20 | 6.72 | -6.86% |
| MZZ | ProShares UltraShort MidCap400 | | 12.07 | 34 | 0.72 | 4.01 | -4.02% |
| MYY | ProShares Short MidCap400 | | 21.21 | 74 | 0.90 | 2.46 | -1.14% |
| 12Stocks.com: Charts, Trends, Fundamental Data and Performances of MidCap Stocks | |
|
We now take in-depth look at all MidCap stocks including charts, multi-period performances and overall trends (as measured by Smart Investing & Trading Score). One can sort MidCap stocks (click link to choose) by Daily, Weekly and by Year-to-Date performances. Also, one can sort by size of the company or by market capitalization. |
| Select Your Default Chart Type: | |||||
| |||||
| Click on stock symbol or name for detailed view. Click on to add stock symbol to your watchlist and to view watchlist. Quick View: Move mouse or cursor over "Daily" to quickly view daily technical stock chart and over "Weekly" to view weekly technical stock chart. | |||||

 | VAC Marriott Vacations Worldwide Corporation |
| Sector: Services & Goods | |
| SubSector: Resorts & Casinos | |
| MarketCap: 2173.54 Millions | |
| Recent Price: 97.67 Smart Investing & Trading Score: 61 | |
| Day Percent Change: -0.14% Day Change: -0.14 | |
| Week Change: 0.69% Year-to-date Change: 15.1% | |
| VAC Links: Profile News Message Board | |
| Charts:- Daily , Weekly | |
| Add VAC to Watchlist: View: Get Complete VAC Trend Analysis ➞ | |
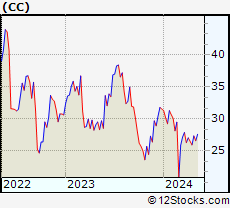 | CC The Chemours Company |
| Sector: Materials | |
| SubSector: Specialty Chemicals | |
| MarketCap: 1718.17 Millions | |
| Recent Price: 26.37 Smart Investing & Trading Score: 60 | |
| Day Percent Change: -0.15% Day Change: -0.04 | |
| Week Change: -0.42% Year-to-date Change: -16.4% | |
| CC Links: Profile News Message Board | |
| Charts:- Daily , Weekly | |
| Add CC to Watchlist: View: Get Complete CC Trend Analysis ➞ | |
 | EXPE Expedia Group, Inc. |
| Sector: Services & Goods | |
| SubSector: Lodging | |
| MarketCap: 8052.96 Millions | |
| Recent Price: 128.73 Smart Investing & Trading Score: 7 | |
| Day Percent Change: -0.16% Day Change: -0.21 | |
| Week Change: -3.37% Year-to-date Change: -15.2% | |
| EXPE Links: Profile News Message Board | |
| Charts:- Daily , Weekly | |
| Add EXPE to Watchlist: View: Get Complete EXPE Trend Analysis ➞ | |
 | SJM The J. M. Smucker Company |
| Sector: Consumer Staples | |
| SubSector: Processed & Packaged Goods | |
| MarketCap: 12635.8 Millions | |
| Recent Price: 109.80 Smart Investing & Trading Score: 18 | |
| Day Percent Change: -0.16% Day Change: -0.18 | |
| Week Change: 0.17% Year-to-date Change: -13.1% | |
| SJM Links: Profile News Message Board | |
| Charts:- Daily , Weekly | |
| Add SJM to Watchlist: View: Get Complete SJM Trend Analysis ➞ | |
 | SMG The Scotts Miracle-Gro Company |
| Sector: Materials | |
| SubSector: Agricultural Chemicals | |
| MarketCap: 5210.89 Millions | |
| Recent Price: 67.70 Smart Investing & Trading Score: 43 | |
| Day Percent Change: -0.16% Day Change: -0.11 | |
| Week Change: -2.51% Year-to-date Change: 6.2% | |
| SMG Links: Profile News Message Board | |
| Charts:- Daily , Weekly | |
| Add SMG to Watchlist: View: Get Complete SMG Trend Analysis ➞ | |
 | RBA Ritchie Bros. Auctioneers Incorporated |
| Sector: Services & Goods | |
| SubSector: Business Services | |
| MarketCap: 3491.02 Millions | |
| Recent Price: 73.21 Smart Investing & Trading Score: 56 | |
| Day Percent Change: -0.16% Day Change: -0.12 | |
| Week Change: -0.15% Year-to-date Change: 9.5% | |
| RBA Links: Profile News Message Board | |
| Charts:- Daily , Weekly | |
| Add RBA to Watchlist: View: Get Complete RBA Trend Analysis ➞ | |
 | UA Under Armour, Inc. |
| Sector: Services & Goods | |
| SubSector: Textile - Apparel Clothing | |
| MarketCap: 3926.93 Millions | |
| Recent Price: 6.30 Smart Investing & Trading Score: 25 | |
| Day Percent Change: -0.16% Day Change: -0.01 | |
| Week Change: 0.16% Year-to-date Change: -24.6% | |
| UA Links: Profile News Message Board | |
| Charts:- Daily , Weekly | |
| Add UA to Watchlist: View: Get Complete UA Trend Analysis ➞ | |
 | AXON Axovant Sciences Ltd. |
| Sector: Health Care | |
| SubSector: Biotechnology | |
| MarketCap: 1492.04 Millions | |
| Recent Price: 299.82 Smart Investing & Trading Score: 26 | |
| Day Percent Change: -0.16% Day Change: -0.49 | |
| Week Change: -3.54% Year-to-date Change: 16.1% | |
| AXON Links: Profile News Message Board | |
| Charts:- Daily , Weekly | |
| Add AXON to Watchlist: View: Get Complete AXON Trend Analysis ➞ | |
 | AFRM Affirm Holdings, Inc. |
| Sector: Technology | |
| SubSector: Software - Infrastructure | |
| MarketCap: 4560 Millions | |
| Recent Price: 30.87 Smart Investing & Trading Score: 7 | |
| Day Percent Change: -0.16% Day Change: -0.05 | |
| Week Change: -5.36% Year-to-date Change: -37.0% | |
| AFRM Links: Profile News Message Board | |
| Charts:- Daily , Weekly | |
| Add AFRM to Watchlist: View: Get Complete AFRM Trend Analysis ➞ | |
 | GLPI Gaming and Leisure Properties, Inc. |
| Sector: Financials | |
| SubSector: REIT - Diversified | |
| MarketCap: 4922.33 Millions | |
| Recent Price: 42.03 Smart Investing & Trading Score: 10 | |
| Day Percent Change: -0.17% Day Change: -0.07 | |
| Week Change: -2.21% Year-to-date Change: -14.8% | |
| GLPI Links: Profile News Message Board | |
| Charts:- Daily , Weekly | |
| Add GLPI to Watchlist: View: Get Complete GLPI Trend Analysis ➞ | |
 | TDY Teledyne Technologies Incorporated |
| Sector: Technology | |
| SubSector: Scientific & Technical Instruments | |
| MarketCap: 9360.43 Millions | |
| Recent Price: 400.27 Smart Investing & Trading Score: 18 | |
| Day Percent Change: -0.18% Day Change: -0.73 | |
| Week Change: 0.45% Year-to-date Change: -10.3% | |
| TDY Links: Profile News Message Board | |
| Charts:- Daily , Weekly | |
| Add TDY to Watchlist: View: Get Complete TDY Trend Analysis ➞ | |
 | FNF Fidelity National Financial, Inc. |
| Sector: Financials | |
| SubSector: Surety & Title Insurance | |
| MarketCap: 6532.18 Millions | |
| Recent Price: 47.02 Smart Investing & Trading Score: 10 | |
| Day Percent Change: -0.19% Day Change: -0.09 | |
| Week Change: -3.27% Year-to-date Change: -7.8% | |
| FNF Links: Profile News Message Board | |
| Charts:- Daily , Weekly | |
| Add FNF to Watchlist: View: Get Complete FNF Trend Analysis ➞ | |
 | EA Electronic Arts Inc. |
| Sector: Technology | |
| SubSector: Multimedia & Graphics Software | |
| MarketCap: 27296.5 Millions | |
| Recent Price: 126.31 Smart Investing & Trading Score: 0 | |
| Day Percent Change: -0.19% Day Change: -0.24 | |
| Week Change: -1.24% Year-to-date Change: -7.7% | |
| EA Links: Profile News Message Board | |
| Charts:- Daily , Weekly | |
| Add EA to Watchlist: View: Get Complete EA Trend Analysis ➞ | |
 | KNSL Kinsale Capital Group, Inc. |
| Sector: Financials | |
| SubSector: Property & Casualty Insurance | |
| MarketCap: 2198.12 Millions | |
| Recent Price: 451.41 Smart Investing & Trading Score: 58 | |
| Day Percent Change: -0.19% Day Change: -0.87 | |
| Week Change: 0.1% Year-to-date Change: 34.8% | |
| KNSL Links: Profile News Message Board | |
| Charts:- Daily , Weekly | |
| Add KNSL to Watchlist: View: Get Complete KNSL Trend Analysis ➞ | |
 | DT Dynatrace, Inc. |
| Sector: Technology | |
| SubSector: Application Software | |
| MarketCap: 7007.12 Millions | |
| Recent Price: 44.43 Smart Investing & Trading Score: 17 | |
| Day Percent Change: -0.20% Day Change: -0.09 | |
| Week Change: -3.1% Year-to-date Change: -18.8% | |
| DT Links: Profile News Message Board | |
| Charts:- Daily , Weekly | |
| Add DT to Watchlist: View: Get Complete DT Trend Analysis ➞ | |
 | TRU TransUnion |
| Sector: Services & Goods | |
| SubSector: Business Services | |
| MarketCap: 11457.2 Millions | |
| Recent Price: 69.63 Smart Investing & Trading Score: 13 | |
| Day Percent Change: -0.20% Day Change: -0.14 | |
| Week Change: -5.36% Year-to-date Change: 1.3% | |
| TRU Links: Profile News Message Board | |
| Charts:- Daily , Weekly | |
| Add TRU to Watchlist: View: Get Complete TRU Trend Analysis ➞ | |
 | AFL Aflac Incorporated |
| Sector: Financials | |
| SubSector: Accident & Health Insurance | |
| MarketCap: 22706 Millions | |
| Recent Price: 80.26 Smart Investing & Trading Score: 25 | |
| Day Percent Change: -0.21% Day Change: -0.17 | |
| Week Change: -0.02% Year-to-date Change: -2.7% | |
| AFL Links: Profile News Message Board | |
| Charts:- Daily , Weekly | |
| Add AFL to Watchlist: View: Get Complete AFL Trend Analysis ➞ | |
 | DHI D.R. Horton, Inc. |
| Sector: Industrials | |
| SubSector: Residential Construction | |
| MarketCap: 13372.6 Millions | |
| Recent Price: 145.74 Smart Investing & Trading Score: 43 | |
| Day Percent Change: -0.21% Day Change: -0.31 | |
| Week Change: -3.94% Year-to-date Change: -4.1% | |
| DHI Links: Profile News Message Board | |
| Charts:- Daily , Weekly | |
| Add DHI to Watchlist: View: Get Complete DHI Trend Analysis ➞ | |
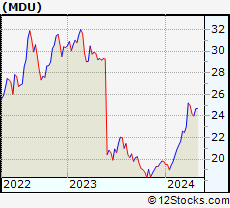 | MDU MDU Resources Group, Inc. |
| Sector: Industrials | |
| SubSector: General Building Materials | |
| MarketCap: 4262.53 Millions | |
| Recent Price: 23.56 Smart Investing & Trading Score: 43 | |
| Day Percent Change: -0.21% Day Change: -0.05 | |
| Week Change: -2.6% Year-to-date Change: 19.0% | |
| MDU Links: Profile News Message Board | |
| Charts:- Daily , Weekly | |
| Add MDU to Watchlist: View: Get Complete MDU Trend Analysis ➞ | |
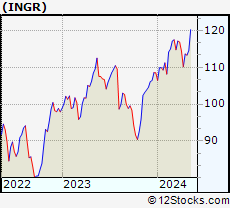 | INGR Ingredion Incorporated |
| Sector: Consumer Staples | |
| SubSector: Processed & Packaged Goods | |
| MarketCap: 5064.18 Millions | |
| Recent Price: 111.29 Smart Investing & Trading Score: 58 | |
| Day Percent Change: -0.21% Day Change: -0.23 | |
| Week Change: 1.03% Year-to-date Change: 2.5% | |
| INGR Links: Profile News Message Board | |
| Charts:- Daily , Weekly | |
| Add INGR to Watchlist: View: Get Complete INGR Trend Analysis ➞ | |
 | FAF First American Financial Corporation |
| Sector: Financials | |
| SubSector: Property & Casualty Insurance | |
| MarketCap: 4163.82 Millions | |
| Recent Price: 54.99 Smart Investing & Trading Score: 0 | |
| Day Percent Change: -0.22% Day Change: -0.12 | |
| Week Change: -3.61% Year-to-date Change: -14.7% | |
| FAF Links: Profile News Message Board | |
| Charts:- Daily , Weekly | |
| Add FAF to Watchlist: View: Get Complete FAF Trend Analysis ➞ | |
 | PRU Prudential Financial, Inc. |
| Sector: Financials | |
| SubSector: Life Insurance | |
| MarketCap: 21001.6 Millions | |
| Recent Price: 107.35 Smart Investing & Trading Score: 36 | |
| Day Percent Change: -0.22% Day Change: -0.24 | |
| Week Change: -2.13% Year-to-date Change: 3.5% | |
| PRU Links: Profile News Message Board | |
| Charts:- Daily , Weekly | |
| Add PRU to Watchlist: View: Get Complete PRU Trend Analysis ➞ | |
 | LDOS Leidos Holdings, Inc. |
| Sector: Technology | |
| SubSector: Information Technology Services | |
| MarketCap: 11707.5 Millions | |
| Recent Price: 124.36 Smart Investing & Trading Score: 41 | |
| Day Percent Change: -0.22% Day Change: -0.28 | |
| Week Change: -1.09% Year-to-date Change: 14.9% | |
| LDOS Links: Profile News Message Board | |
| Charts:- Daily , Weekly | |
| Add LDOS to Watchlist: View: Get Complete LDOS Trend Analysis ➞ | |
 | OWL Blue Owl Capital Inc. |
| Sector: Financials | |
| SubSector: Asset Management | |
| MarketCap: 16240 Millions | |
| Recent Price: 18.31 Smart Investing & Trading Score: 38 | |
| Day Percent Change: -0.22% Day Change: -0.04 | |
| Week Change: -1.24% Year-to-date Change: 23.0% | |
| OWL Links: Profile News Message Board | |
| Charts:- Daily , Weekly | |
| Add OWL to Watchlist: View: Get Complete OWL Trend Analysis ➞ | |
 | RGA Reinsurance Group of America, Incorporated |
| Sector: Financials | |
| SubSector: Life Insurance | |
| MarketCap: 4423.36 Millions | |
| Recent Price: 180.15 Smart Investing & Trading Score: 36 | |
| Day Percent Change: -0.23% Day Change: -0.42 | |
| Week Change: -2.29% Year-to-date Change: 11.4% | |
| RGA Links: Profile News Message Board | |
| Charts:- Daily , Weekly | |
| Add RGA to Watchlist: View: Get Complete RGA Trend Analysis ➞ | |
| For tabular summary view of above stock list: Summary View ➞ 0 - 25 , 25 - 50 , 50 - 75 , 75 - 100 , 100 - 125 , 125 - 150 , 150 - 175 , 175 - 200 , 200 - 225 , 225 - 250 , 250 - 275 , 275 - 300 , 300 - 325 , 325 - 350 , 350 - 375 , 375 - 400 , 400 - 425 , 425 - 450 , 450 - 475 , 475 - 500 , 500 - 525 , 525 - 550 , 550 - 575 , 575 - 600 , 600 - 625 , 625 - 650 , 650 - 675 , 675 - 700 , 700 - 725 , 725 - 750 , 750 - 775 | ||
| Click To Change The Sort Order: By Market Cap or Company Size Performance: Year-to-date, Week and Day | |
| Select Chart Type: | ||
|
Best Stocks Today 12Stocks.com |
© 2024 12Stocks.com Terms & Conditions Privacy Contact Us
All Information Provided Only For Education And Not To Be Used For Investing or Trading. See Terms & Conditions


One More Thing ... Get Best Stocks Delivered Daily!
Never Ever Miss A Move With Our Top Ten Stocks Lists
Find Best Stocks In Any Market - Bull or Bear Market
Take A Peek At Our Top Ten Stocks Lists: Daily, Weekly, Year-to-Date & Top Trends
Find Best Stocks In Any Market - Bull or Bear Market
Take A Peek At Our Top Ten Stocks Lists: Daily, Weekly, Year-to-Date & Top Trends
Midcap Stocks With Best Up Trends [0-bearish to 100-bullish]: United Airlines[100], Medical Properties[100], Coupang [100], HEICO [100], Conagra [95], Inspire Medical[93], Royal Gold[93], Bunge [93], Allegro Micro[93], SYNNEX [88], United [88]
Best Midcap Stocks Year-to-Date:
Vistra Energy[78.22%], AppLovin [78.06%], ShockWave Medical[71.86%], Constellation Energy[58.3%], EMCOR [57.45%], Spotify [56.23%], Pure Storage[46.72%], Natera [44.2%], NRG Energy[42.01%], CAVA [41.58%], Wingstop [40.14%] Best Midcap Stocks This Week:
Medical Properties[19.55%], United Airlines[16.6%], AMC Entertainment[12.45%], Globe Life[7.01%], Coupang [6.49%], American Airlines[5.63%], Inspire Medical[5.08%], Advance Auto[5.04%], New York[4.58%], Southwest Airlines[4.5%], Bentley [4.03%] Best Midcap Stocks Daily:
United Airlines[17.45%], agilon health[11.83%], Inspire Medical[9.87%], AMC Entertainment[9.56%], American Airlines[6.60%], Globe Life[5.44%], Sunrun [4.99%], Alaska Air[4.71%], Ultragenyx Pharmaceutical[4.25%], Advance Auto[3.41%], Consolidated Edison[3.33%]