
 Login Sign Up


| |||||
 |  | ||||

| 12Stocks.com Market Intelligence |
Best MidCap Stocks
|
| In a hurry? Mid Cap Stocks Lists: Performance Trends Table, Stock Charts
Sort midcap stocks: Daily, Weekly, Year-to-Date, Market Cap & Trends. Filter midcap stocks list by sector: Show all, Tech, Finance, Energy, Staples, Retail, Industrial, Materials, Utilities and HealthCare Filter midcap stocks list by size:All MidCap Large Mid-Range Small |
| 12Stocks.com Mid Cap Stocks Performances & Trends Daily | |||||||||
|
|  The overall Smart Investing & Trading Score is 44 (0-bearish to 100-bullish) which puts Mid Cap index in short term neutral trend. The Smart Investing & Trading Score from previous trading session is 36 and hence an improvement of trend.
| ||||||||
Here are the Smart Investing & Trading Scores of the most requested mid cap stocks at 12Stocks.com (click stock name for detailed review):
|


| 12Stocks.com: Top Performing Mid Cap Index Stocks | ||||||||||||||||||||||||||||||||||||||||||||||||
 The top performing Mid Cap Index stocks year to date are
Now, more recently, over last week, the top performing Mid Cap Index stocks on the move are


|
||||||||||||||||||||||||||||||||||||||||||||||||
| 12Stocks.com: Investing in Midcap Index with Stocks | |
|
The following table helps investors and traders sort through current performance and trends (as measured by Smart Investing & Trading Score) of various
stocks in the Midcap Index. Quick View: Move mouse or cursor over stock symbol (ticker) to view short-term technical chart and over stock name to view long term chart. Click on  to add stock symbol to your watchlist and to add stock symbol to your watchlist and  to view watchlist. Click on any ticker or stock name for detailed market intelligence report for that stock. to view watchlist. Click on any ticker or stock name for detailed market intelligence report for that stock. |
12Stocks.com Performance of Stocks in Midcap Index
| Ticker | Stock Name | Watchlist | Category | Recent Price | Smart Investing & Trading Score | Change % | YTD Change% |
| LSXMK | Liberty SiriusXM |   | Services & Goods | 24.34 | 25 | 0.54 | -15.43% |
| XYL | Xylem | | Industrials | 127.84 | 68 | 0.53 | 11.79% |
| BEN | Franklin Resources | | Financials | 25.15 | 32 | 0.52 | -15.58% |
| ASH | Ashland Global | | Materials | 95.99 | 68 | 0.52 | 13.85% |
| ESS | Essex Property | | Financials | 235.17 | 68 | 0.51 | -5.15% |
| NEU | NewMarket | | Materials | 586.34 | 44 | 0.51 | 7.42% |
| GPK | Graphic Packaging | | Consumer Staples | 27.35 | 54 | 0.51 | 10.95% |
| INVH | Invitation Homes | | Financials | 33.57 | 68 | 0.51 | -1.58% |
| HXL | Hexcel | | Industrials | 61.71 | 25 | 0.50 | -16.33% |
| CHE | Chemed | | Health Care | 600.41 | 36 | 0.50 | 2.68% |
| JKHY | Jack Henry | | Technology | 165.60 | 55 | 0.50 | 1.34% |
| DD | DuPont de | | Materials | 73.89 | 68 | 0.49 | -3.95% |
| CRI | Carter s | | Consumer Staples | 71.75 | 25 | 0.48 | -4.19% |
| COLD | Americold Realty | | Financials | 22.84 | 0 | 0.48 | -24.55% |
| NDAQ | Nasdaq | | Financials | 60.35 | 61 | 0.47 | 3.80% |
| YUM | Yum! | | Services & Goods | 138.50 | 75 | 0.46 | 6.00% |
| INFA | Informatica | | Technology | 35.19 | 63 | 0.46 | 23.82% |
| CTSH | Cognizant | | Technology | 67.44 | 18 | 0.46 | -10.71% |
| WWD | Woodward | | Industrials | 147.49 | 36 | 0.46 | 8.34% |
| SWAV | ShockWave Medical | | Health Care | 329.02 | 66 | 0.46 | 72.66% |
| STT | State Street | | Financials | 73.37 | 38 | 0.45 | -5.28% |
| CUBE | CubeSmart | | Financials | 42.05 | 28 | 0.45 | -9.28% |
| APTV | Aptiv | | Consumer Staples | 69.63 | 10 | 0.45 | -22.39% |
| PVH | PVH | | Consumer Staples | 106.78 | 10 | 0.44 | -12.56% |
| IFF | Flavors | | Materials | 83.97 | 68 | 0.44 | 3.71% |
| For chart view version of above stock list: Chart View ➞ 0 - 25 , 25 - 50 , 50 - 75 , 75 - 100 , 100 - 125 , 125 - 150 , 150 - 175 , 175 - 200 , 200 - 225 , 225 - 250 , 250 - 275 , 275 - 300 , 300 - 325 , 325 - 350 , 350 - 375 , 375 - 400 , 400 - 425 , 425 - 450 , 450 - 475 , 475 - 500 , 500 - 525 , 525 - 550 , 550 - 575 , 575 - 600 , 600 - 625 , 625 - 650 , 650 - 675 , 675 - 700 , 700 - 725 , 725 - 750 , 750 - 775 | ||
 | Click To Change The Sort Order: By Market Cap or Company Size Performance: Year-to-date, Week and Day |  |
|
Get the most comprehensive stock market coverage daily at 12Stocks.com ➞ Best Stocks Today ➞ Best Stocks Weekly ➞ Best Stocks Year-to-Date ➞ Best Stocks Trends ➞  Best Stocks Today 12Stocks.com Best Nasdaq Stocks ➞ Best S&P 500 Stocks ➞ Best Tech Stocks ➞ Best Biotech Stocks ➞ |
| Detailed Overview of Midcap Stocks |
| Midcap Technical Overview, Leaders & Laggards, Top Midcap ETF Funds & Detailed Midcap Stocks List, Charts, Trends & More |
| Midcap: Technical Analysis, Trends & YTD Performance | |
| MidCap segment as represented by
MDY, an exchange-traded fund [ETF], holds basket of about four hundred midcap stocks from across all major sectors of the US stock market. The midcap index (contains stocks like Green Mountain Coffee Roasters and Tractor Supply Company) is up by 2.15% and is currently underperforming the overall market by -1.23% year-to-date. Below is a quick view of technical charts and trends: | |
 MDY Weekly Chart |
|
| Long Term Trend: Good | |
| Medium Term Trend: Not Good | |
 MDY Daily Chart |
|
| Short Term Trend: Deteriorating | |
| Overall Trend Score: 44 | |
| YTD Performance: 2.15% | |
| **Trend Scores & Views Are Only For Educational Purposes And Not For Investing | |
| 12Stocks.com: Investing in Midcap Index using Exchange Traded Funds | |
|
The following table shows list of key exchange traded funds (ETF) that
help investors track Midcap index. The following list also includes leveraged ETF funds that track twice or thrice the daily returns of Midcap indices. Short or inverse ETF funds move in the opposite direction to the index they track and are useful during market pullbacks or during bear markets. Quick View: Move mouse or cursor over ETF symbol (ticker) to view short-term technical chart and over ETF name to view long term chart. Click on ticker or stock name for detailed view. Click on to add stock symbol to your watchlist and to view watchlist. |
12Stocks.com List of ETFs that track Midcap Index
| Ticker | ETF Name | Watchlist | Recent Price | Smart Investing & Trading Score | Change % | Week % | Year-to-date % |
| IJH | iShares Core S&P Mid-Cap | | 56.58 | 36 | 0.27 | -2.26 | 2.07% |
| IWR | iShares Russell Mid-Cap | | 78.66 | 36 | -0.06 | -2.43 | 1.2% |
| IWP | iShares Russell Mid-Cap Growth | | 105.70 | 36 | -0.75 | -3.77 | 1.19% |
| MDY | SPDR S&P MidCap 400 ETF | | 518.28 | 44 | 0.33 | -2.2 | 2.15% |
| IWS | iShares Russell Mid-Cap Value | | 117.65 | 41 | 0.29 | -1.87 | 1.17% |
| IJK | iShares S&P Mid-Cap 400 Growth | | 84.85 | 36 | -0.21 | -3.01 | 7.11% |
| IJJ | iShares S&P Mid-Cap 400 Value | | 110.55 | 17 | 1.00 | -1.29 | -3.06% |
| XMLV | PowerShares S&P MidCap Low Volatil ETF | | 54.16 | 53 | 1.06 | -0.17 | 1.84% |
| MVV | ProShares Ultra MidCap400 | | 59.00 | 36 | 0.99 | -4.42 | 1.92% |
| SMDD | ProShares UltraPro Short MidCap400 | | 12.56 | 59 | -1.00 | 6.92 | -6.69% |
| MZZ | ProShares UltraShort MidCap400 | | 12.17 | 34 | -0.49 | 4.92 | -3.18% |
| UMDD | ProShares UltraPro MidCap400 | | 22.56 | 36 | 1.14 | -6.66 | 1.09% |
| MYY | ProShares Short MidCap400 | | 21.19 | 69 | -0.33 | 2.35 | -1.24% |
| 12Stocks.com: Charts, Trends, Fundamental Data and Performances of MidCap Stocks | |
|
We now take in-depth look at all MidCap stocks including charts, multi-period performances and overall trends (as measured by Smart Investing & Trading Score). One can sort MidCap stocks (click link to choose) by Daily, Weekly and by Year-to-Date performances. Also, one can sort by size of the company or by market capitalization. |
| Select Your Default Chart Type: | |||||
| |||||
| Click on stock symbol or name for detailed view. Click on to add stock symbol to your watchlist and to view watchlist. Quick View: Move mouse or cursor over "Daily" to quickly view daily technical stock chart and over "Weekly" to view weekly technical stock chart. | |||||

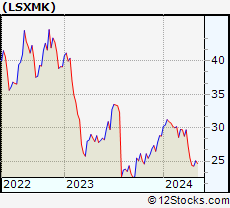 | LSXMK The Liberty SiriusXM Group |
| Sector: Services & Goods | |
| SubSector: Broadcasting - Radio | |
| MarketCap: 5183.95 Millions | |
| Recent Price: 24.34 Smart Investing & Trading Score: 25 | |
| Day Percent Change: 0.54% Day Change: 0.13 | |
| Week Change: -4.25% Year-to-date Change: -15.4% | |
| LSXMK Links: Profile News Message Board | |
| Charts:- Daily , Weekly | |
| Add LSXMK to Watchlist: View: Get Complete LSXMK Trend Analysis ➞ | |
 | XYL Xylem Inc. |
| Sector: Industrials | |
| SubSector: Diversified Machinery | |
| MarketCap: 12195.1 Millions | |
| Recent Price: 127.84 Smart Investing & Trading Score: 68 | |
| Day Percent Change: 0.53% Day Change: 0.68 | |
| Week Change: -0.21% Year-to-date Change: 11.8% | |
| XYL Links: Profile News Message Board | |
| Charts:- Daily , Weekly | |
| Add XYL to Watchlist: View: Get Complete XYL Trend Analysis ➞ | |
 | BEN Franklin Resources, Inc. |
| Sector: Financials | |
| SubSector: Asset Management | |
| MarketCap: 9419.73 Millions | |
| Recent Price: 25.15 Smart Investing & Trading Score: 32 | |
| Day Percent Change: 0.52% Day Change: 0.13 | |
| Week Change: -1.02% Year-to-date Change: -15.6% | |
| BEN Links: Profile News Message Board | |
| Charts:- Daily , Weekly | |
| Add BEN to Watchlist: View: Get Complete BEN Trend Analysis ➞ | |
 | ASH Ashland Global Holdings Inc. |
| Sector: Materials | |
| SubSector: Chemicals - Major Diversified | |
| MarketCap: 2764.16 Millions | |
| Recent Price: 95.99 Smart Investing & Trading Score: 68 | |
| Day Percent Change: 0.52% Day Change: 0.50 | |
| Week Change: 0.8% Year-to-date Change: 13.9% | |
| ASH Links: Profile News Message Board | |
| Charts:- Daily , Weekly | |
| Add ASH to Watchlist: View: Get Complete ASH Trend Analysis ➞ | |
 | ESS Essex Property Trust, Inc. |
| Sector: Financials | |
| SubSector: REIT - Residential | |
| MarketCap: 13725.5 Millions | |
| Recent Price: 235.17 Smart Investing & Trading Score: 68 | |
| Day Percent Change: 0.51% Day Change: 1.20 | |
| Week Change: -1.72% Year-to-date Change: -5.2% | |
| ESS Links: Profile News Message Board | |
| Charts:- Daily , Weekly | |
| Add ESS to Watchlist: View: Get Complete ESS Trend Analysis ➞ | |
 | NEU NewMarket Corporation |
| Sector: Materials | |
| SubSector: Specialty Chemicals | |
| MarketCap: 4543.77 Millions | |
| Recent Price: 586.34 Smart Investing & Trading Score: 44 | |
| Day Percent Change: 0.51% Day Change: 2.96 | |
| Week Change: -1.08% Year-to-date Change: 7.4% | |
| NEU Links: Profile News Message Board | |
| Charts:- Daily , Weekly | |
| Add NEU to Watchlist: View: Get Complete NEU Trend Analysis ➞ | |
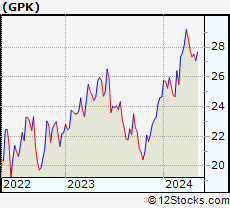 | GPK Graphic Packaging Holding Company |
| Sector: Consumer Staples | |
| SubSector: Packaging & Containers | |
| MarketCap: 3350.23 Millions | |
| Recent Price: 27.35 Smart Investing & Trading Score: 54 | |
| Day Percent Change: 0.51% Day Change: 0.14 | |
| Week Change: -1.55% Year-to-date Change: 11.0% | |
| GPK Links: Profile News Message Board | |
| Charts:- Daily , Weekly | |
| Add GPK to Watchlist: View: Get Complete GPK Trend Analysis ➞ | |
 | INVH Invitation Homes Inc. |
| Sector: Financials | |
| SubSector: Real Estate Development | |
| MarketCap: 9782.89 Millions | |
| Recent Price: 33.57 Smart Investing & Trading Score: 68 | |
| Day Percent Change: 0.51% Day Change: 0.17 | |
| Week Change: -1.03% Year-to-date Change: -1.6% | |
| INVH Links: Profile News Message Board | |
| Charts:- Daily , Weekly | |
| Add INVH to Watchlist: View: Get Complete INVH Trend Analysis ➞ | |
 | HXL Hexcel Corporation |
| Sector: Industrials | |
| SubSector: Aerospace/Defense Products & Services | |
| MarketCap: 2905.51 Millions | |
| Recent Price: 61.71 Smart Investing & Trading Score: 25 | |
| Day Percent Change: 0.50% Day Change: 0.31 | |
| Week Change: -1.36% Year-to-date Change: -16.3% | |
| HXL Links: Profile News Message Board | |
| Charts:- Daily , Weekly | |
| Add HXL to Watchlist: View: Get Complete HXL Trend Analysis ➞ | |
 | CHE Chemed Corporation |
| Sector: Health Care | |
| SubSector: Home Health Care | |
| MarketCap: 6148.95 Millions | |
| Recent Price: 600.41 Smart Investing & Trading Score: 36 | |
| Day Percent Change: 0.50% Day Change: 2.99 | |
| Week Change: -2.93% Year-to-date Change: 2.7% | |
| CHE Links: Profile News Message Board | |
| Charts:- Daily , Weekly | |
| Add CHE to Watchlist: View: Get Complete CHE Trend Analysis ➞ | |
 | JKHY Jack Henry & Associates, Inc. |
| Sector: Technology | |
| SubSector: Information Technology Services | |
| MarketCap: 10695.4 Millions | |
| Recent Price: 165.60 Smart Investing & Trading Score: 55 | |
| Day Percent Change: 0.50% Day Change: 0.83 | |
| Week Change: -1.18% Year-to-date Change: 1.3% | |
| JKHY Links: Profile News Message Board | |
| Charts:- Daily , Weekly | |
| Add JKHY to Watchlist: View: Get Complete JKHY Trend Analysis ➞ | |
 | DD DuPont de Nemours, Inc. |
| Sector: Materials | |
| SubSector: Agricultural Chemicals | |
| MarketCap: 25631.6 Millions | |
| Recent Price: 73.89 Smart Investing & Trading Score: 68 | |
| Day Percent Change: 0.49% Day Change: 0.36 | |
| Week Change: 0.12% Year-to-date Change: -4.0% | |
| DD Links: Profile News Message Board | |
| Charts:- Daily , Weekly | |
| Add DD to Watchlist: View: Get Complete DD Trend Analysis ➞ | |
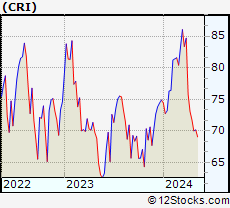 | CRI Carter s, Inc. |
| Sector: Consumer Staples | |
| SubSector: Textile - Apparel Clothing | |
| MarketCap: 3173.55 Millions | |
| Recent Price: 71.75 Smart Investing & Trading Score: 25 | |
| Day Percent Change: 0.48% Day Change: 0.34 | |
| Week Change: -1.83% Year-to-date Change: -4.2% | |
| CRI Links: Profile News Message Board | |
| Charts:- Daily , Weekly | |
| Add CRI to Watchlist: View: Get Complete CRI Trend Analysis ➞ | |
 | COLD Americold Realty Trust |
| Sector: Financials | |
| SubSector: REIT - Industrial | |
| MarketCap: 6569.69 Millions | |
| Recent Price: 22.84 Smart Investing & Trading Score: 0 | |
| Day Percent Change: 0.48% Day Change: 0.11 | |
| Week Change: -4.59% Year-to-date Change: -24.6% | |
| COLD Links: Profile News Message Board | |
| Charts:- Daily , Weekly | |
| Add COLD to Watchlist: View: Get Complete COLD Trend Analysis ➞ | |
 | NDAQ Nasdaq, Inc. |
| Sector: Financials | |
| SubSector: Diversified Investments | |
| MarketCap: 14885.2 Millions | |
| Recent Price: 60.35 Smart Investing & Trading Score: 61 | |
| Day Percent Change: 0.47% Day Change: 0.28 | |
| Week Change: -1.9% Year-to-date Change: 3.8% | |
| NDAQ Links: Profile News Message Board | |
| Charts:- Daily , Weekly | |
| Add NDAQ to Watchlist: View: Get Complete NDAQ Trend Analysis ➞ | |
 | YUM Yum! Brands, Inc. |
| Sector: Services & Goods | |
| SubSector: Restaurants | |
| MarketCap: 18033.3 Millions | |
| Recent Price: 138.50 Smart Investing & Trading Score: 75 | |
| Day Percent Change: 0.46% Day Change: 0.63 | |
| Week Change: 0.51% Year-to-date Change: 6.0% | |
| YUM Links: Profile News Message Board | |
| Charts:- Daily , Weekly | |
| Add YUM to Watchlist: View: Get Complete YUM Trend Analysis ➞ | |
 | INFA Informatica Inc. |
| Sector: Technology | |
| SubSector: Software - Infrastructure | |
| MarketCap: 5340 Millions | |
| Recent Price: 35.19 Smart Investing & Trading Score: 63 | |
| Day Percent Change: 0.46% Day Change: 0.16 | |
| Week Change: -8.55% Year-to-date Change: 23.8% | |
| INFA Links: Profile News Message Board | |
| Charts:- Daily , Weekly | |
| Add INFA to Watchlist: View: Get Complete INFA Trend Analysis ➞ | |
 | CTSH Cognizant Technology Solutions Corporation |
| Sector: Technology | |
| SubSector: Information Technology Services | |
| MarketCap: 26249.7 Millions | |
| Recent Price: 67.44 Smart Investing & Trading Score: 18 | |
| Day Percent Change: 0.46% Day Change: 0.31 | |
| Week Change: -2.63% Year-to-date Change: -10.7% | |
| CTSH Links: Profile News Message Board | |
| Charts:- Daily , Weekly | |
| Add CTSH to Watchlist: View: Get Complete CTSH Trend Analysis ➞ | |
 | WWD Woodward, Inc. |
| Sector: Industrials | |
| SubSector: Aerospace/Defense Products & Services | |
| MarketCap: 3764.01 Millions | |
| Recent Price: 147.49 Smart Investing & Trading Score: 36 | |
| Day Percent Change: 0.46% Day Change: 0.68 | |
| Week Change: 0.66% Year-to-date Change: 8.3% | |
| WWD Links: Profile News Message Board | |
| Charts:- Daily , Weekly | |
| Add WWD to Watchlist: View: Get Complete WWD Trend Analysis ➞ | |
 | SWAV ShockWave Medical, Inc. |
| Sector: Health Care | |
| SubSector: Medical Appliances & Equipment | |
| MarketCap: 855.58 Millions | |
| Recent Price: 329.02 Smart Investing & Trading Score: 66 | |
| Day Percent Change: 0.46% Day Change: 1.50 | |
| Week Change: 0.4% Year-to-date Change: 72.7% | |
| SWAV Links: Profile News Message Board | |
| Charts:- Daily , Weekly | |
| Add SWAV to Watchlist: View: Get Complete SWAV Trend Analysis ➞ | |
 | STT State Street Corporation |
| Sector: Financials | |
| SubSector: Asset Management | |
| MarketCap: 18623 Millions | |
| Recent Price: 73.37 Smart Investing & Trading Score: 38 | |
| Day Percent Change: 0.45% Day Change: 0.33 | |
| Week Change: -3.18% Year-to-date Change: -5.3% | |
| STT Links: Profile News Message Board | |
| Charts:- Daily , Weekly | |
| Add STT to Watchlist: View: Get Complete STT Trend Analysis ➞ | |
 | CUBE CubeSmart |
| Sector: Financials | |
| SubSector: REIT - Industrial | |
| MarketCap: 4562.99 Millions | |
| Recent Price: 42.05 Smart Investing & Trading Score: 28 | |
| Day Percent Change: 0.45% Day Change: 0.19 | |
| Week Change: -4.04% Year-to-date Change: -9.3% | |
| CUBE Links: Profile News Message Board | |
| Charts:- Daily , Weekly | |
| Add CUBE to Watchlist: View: Get Complete CUBE Trend Analysis ➞ | |
 | APTV Aptiv PLC |
| Sector: Consumer Staples | |
| SubSector: Auto Parts | |
| MarketCap: 13047.9 Millions | |
| Recent Price: 69.63 Smart Investing & Trading Score: 10 | |
| Day Percent Change: 0.45% Day Change: 0.31 | |
| Week Change: -6.15% Year-to-date Change: -22.4% | |
| APTV Links: Profile News Message Board | |
| Charts:- Daily , Weekly | |
| Add APTV to Watchlist: View: Get Complete APTV Trend Analysis ➞ | |
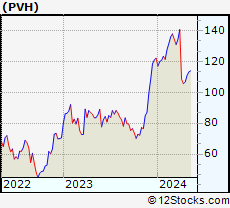 | PVH PVH Corp. |
| Sector: Consumer Staples | |
| SubSector: Textile - Apparel Clothing | |
| MarketCap: 2947.65 Millions | |
| Recent Price: 106.78 Smart Investing & Trading Score: 10 | |
| Day Percent Change: 0.44% Day Change: 0.47 | |
| Week Change: 1.13% Year-to-date Change: -12.6% | |
| PVH Links: Profile News Message Board | |
| Charts:- Daily , Weekly | |
| Add PVH to Watchlist: View: Get Complete PVH Trend Analysis ➞ | |
 | IFF International Flavors & Fragrances Inc. |
| Sector: Materials | |
| SubSector: Specialty Chemicals | |
| MarketCap: 12178.7 Millions | |
| Recent Price: 83.97 Smart Investing & Trading Score: 68 | |
| Day Percent Change: 0.44% Day Change: 0.37 | |
| Week Change: 0.43% Year-to-date Change: 3.7% | |
| IFF Links: Profile News Message Board | |
| Charts:- Daily , Weekly | |
| Add IFF to Watchlist: View: Get Complete IFF Trend Analysis ➞ | |
| For tabular summary view of above stock list: Summary View ➞ 0 - 25 , 25 - 50 , 50 - 75 , 75 - 100 , 100 - 125 , 125 - 150 , 150 - 175 , 175 - 200 , 200 - 225 , 225 - 250 , 250 - 275 , 275 - 300 , 300 - 325 , 325 - 350 , 350 - 375 , 375 - 400 , 400 - 425 , 425 - 450 , 450 - 475 , 475 - 500 , 500 - 525 , 525 - 550 , 550 - 575 , 575 - 600 , 600 - 625 , 625 - 650 , 650 - 675 , 675 - 700 , 700 - 725 , 725 - 750 , 750 - 775 | ||
| Click To Change The Sort Order: By Market Cap or Company Size Performance: Year-to-date, Week and Day | |
| Select Chart Type: | ||
|
Best Stocks Today 12Stocks.com |
© 2024 12Stocks.com Terms & Conditions Privacy Contact Us
All Information Provided Only For Education And Not To Be Used For Investing or Trading. See Terms & Conditions


One More Thing ... Get Best Stocks Delivered Daily!
Never Ever Miss A Move With Our Top Ten Stocks Lists
Find Best Stocks In Any Market - Bull or Bear Market
Take A Peek At Our Top Ten Stocks Lists: Daily, Weekly, Year-to-Date & Top Trends
Find Best Stocks In Any Market - Bull or Bear Market
Take A Peek At Our Top Ten Stocks Lists: Daily, Weekly, Year-to-Date & Top Trends
Midcap Stocks With Best Up Trends [0-bearish to 100-bullish]: UGI [100], Entergy [100], Bunge [100], Flowers Foods[100], Tyson Foods[100], Genuine Parts[100], Wendy s[100], Alaska Air[100], Consolidated Edison[100], Conagra [100], United Airlines[100]
Best Midcap Stocks Year-to-Date:
ShockWave Medical[72.66%], Vistra Energy[70.46%], AppLovin [67.86%], Constellation Energy[54.47%], EMCOR [52.55%], Spotify [46.79%], Pure Storage[38.7%], Williams-Sonoma [38.37%], CAVA [37.24%], Natera [36.14%], Coupang [35.86%] Best Midcap Stocks This Week:
United Airlines[22.92%], AMC Entertainment[19.25%], Globe Life[12.95%], Genuine Parts[11.7%], Advance Auto[11.62%], Iridium [11.07%], Medical Properties[10.78%], agilon health[10.3%], UGI [9.72%], Alaska Air[8.98%], Flowers Foods[8.66%] Best Midcap Stocks Daily:
AMC Entertainment[8.22%], UGI [8.20%], Hawaiian Electric[6.86%], Fifth Third[5.93%], Iridium [5.14%], agilon health[4.10%], SSR Mining[3.99%], Walgreens Boots[3.70%], Darling Ingredients[3.47%], Citizens Financial[3.31%], J. M.[3.29%]