
 Login Sign Up


| |||||
 |  | ||||

| 12Stocks.com Market Intelligence |
Best MidCap Stocks
|
| In a hurry? Mid Cap Stocks Lists: Performance Trends Table, Stock Charts
Sort midcap stocks: Daily, Weekly, Year-to-Date, Market Cap & Trends. Filter midcap stocks list by sector: Show all, Tech, Finance, Energy, Staples, Retail, Industrial, Materials, Utilities and HealthCare Filter midcap stocks list by size:All MidCap Large Mid-Range Small |
| 12Stocks.com Mid Cap Stocks Performances & Trends Daily | |||||||||
|
|  The overall Smart Investing & Trading Score is 36 (0-bearish to 100-bullish) which puts Mid Cap index in short term bearish to neutral trend. The Smart Investing & Trading Score from previous trading session is 26 and hence an improvement of trend.
| ||||||||
Here are the Smart Investing & Trading Scores of the most requested mid cap stocks at 12Stocks.com (click stock name for detailed review):
|


| 12Stocks.com: Top Performing Mid Cap Index Stocks | ||||||||||||||||||||||||||||||||||||||||||||||||
 The top performing Mid Cap Index stocks year to date are
Now, more recently, over last week, the top performing Mid Cap Index stocks on the move are


|
||||||||||||||||||||||||||||||||||||||||||||||||
| 12Stocks.com: Investing in Midcap Index with Stocks | |
|
The following table helps investors and traders sort through current performance and trends (as measured by Smart Investing & Trading Score) of various
stocks in the Midcap Index. Quick View: Move mouse or cursor over stock symbol (ticker) to view short-term technical chart and over stock name to view long term chart. Click on  to add stock symbol to your watchlist and to add stock symbol to your watchlist and  to view watchlist. Click on any ticker or stock name for detailed market intelligence report for that stock. to view watchlist. Click on any ticker or stock name for detailed market intelligence report for that stock. |
12Stocks.com Performance of Stocks in Midcap Index
| Ticker | Stock Name | Watchlist | Category | Recent Price | Smart Investing & Trading Score | Change % | YTD Change% |
| HUBB | Hubbell |   | Technology | 392.28 | 48 | 0.34 | 19.26% |
| SNDR | Schneider National | | Transports | 20.72 | 0 | 0.34 | -18.59% |
| TPG | TPG | | Financials | 42.95 | 58 | 0.34 | -0.72% |
| BAX | Baxter | | Health Care | 39.65 | 46 | 0.33 | 2.56% |
| DXCM | DexCom | | Health Care | 134.30 | 61 | 0.33 | 8.23% |
| WRB | W. R. | | Financials | 80.98 | 10 | 0.33 | 14.51% |
| RBLX | Roblox | | Services & Goods | 36.49 | 8 | 0.33 | -20.92% |
| STT | State Street | | Financials | 73.04 | 17 | 0.32 | -5.71% |
| CNHI | CNH Industrial | | Industrials | 12.40 | 36 | 0.32 | 1.81% |
| MOH | Molina | | Health Care | 360.94 | 51 | 0.30 | -0.10% |
| TDOC | Teladoc Health | | Technology | 13.18 | 5 | 0.30 | -38.84% |
| HAYW | Hayward | | Industrials | 13.29 | 36 | 0.30 | -2.35% |
| STE | STERIS | | Health Care | 200.81 | 25 | 0.28 | -8.66% |
| BLD | TopBuild | | Industrials | 389.81 | 26 | 0.28 | 4.15% |
| TTC | Toro | | Industrials | 84.51 | 10 | 0.27 | -11.96% |
| AOS | A. O. | | Industrials | 86.69 | 70 | 0.27 | 5.16% |
| BFAM | Bright Horizons | | Services & Goods | 103.72 | 36 | 0.27 | 10.06% |
| NCNO | nCino | | Technology | 29.76 | 10 | 0.27 | -11.51% |
| OKE | ONEOK | | Utilities | 77.88 | 61 | 0.26 | 10.91% |
| XRAY | DENTSPLY SIRONA | | Health Care | 30.44 | 10 | 0.26 | -14.47% |
| IPGP | IPG Photonics | | Technology | 84.59 | 28 | 0.26 | -22.07% |
| WHR | Whirlpool | | Consumer Staples | 104.11 | 20 | 0.25 | -14.50% |
| NNN | National Retail | | Financials | 39.77 | 25 | 0.25 | -7.73% |
| LPLA | LPL Financial | | Financials | 259.77 | 53 | 0.25 | 14.12% |
| HOLX | Hologic | | Health Care | 75.10 | 36 | 0.24 | 5.11% |
| For chart view version of above stock list: Chart View ➞ 0 - 25 , 25 - 50 , 50 - 75 , 75 - 100 , 100 - 125 , 125 - 150 , 150 - 175 , 175 - 200 , 200 - 225 , 225 - 250 , 250 - 275 , 275 - 300 , 300 - 325 , 325 - 350 , 350 - 375 , 375 - 400 , 400 - 425 , 425 - 450 , 450 - 475 , 475 - 500 , 500 - 525 , 525 - 550 , 550 - 575 , 575 - 600 , 600 - 625 , 625 - 650 , 650 - 675 , 675 - 700 , 700 - 725 , 725 - 750 , 750 - 775 | ||
 | Click To Change The Sort Order: By Market Cap or Company Size Performance: Year-to-date, Week and Day |  |
|
Get the most comprehensive stock market coverage daily at 12Stocks.com ➞ Best Stocks Today ➞ Best Stocks Weekly ➞ Best Stocks Year-to-Date ➞ Best Stocks Trends ➞  Best Stocks Today 12Stocks.com Best Nasdaq Stocks ➞ Best S&P 500 Stocks ➞ Best Tech Stocks ➞ Best Biotech Stocks ➞ |
| Detailed Overview of Midcap Stocks |
| Midcap Technical Overview, Leaders & Laggards, Top Midcap ETF Funds & Detailed Midcap Stocks List, Charts, Trends & More |
| Midcap: Technical Analysis, Trends & YTD Performance | |
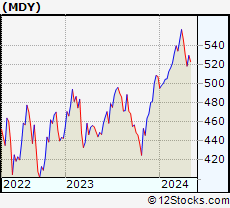
| MidCap segment as represented by
MDY, an exchange-traded fund [ETF], holds basket of about four hundred midcap stocks from across all major sectors of the US stock market. The midcap index (contains stocks like Green Mountain Coffee Roasters and Tractor Supply Company) is up by 1.81% and is currently underperforming the overall market by -2.38% year-to-date. Below is a quick view of technical charts and trends: | |
 MDY Weekly Chart |
|
| Long Term Trend: Good | |
| Medium Term Trend: Not Good | |
 MDY Daily Chart |
|
| Short Term Trend: Not Good | |
| Overall Trend Score: 36 | |
| YTD Performance: 1.81% | |
| **Trend Scores & Views Are Only For Educational Purposes And Not For Investing | |
| 12Stocks.com: Investing in Midcap Index using Exchange Traded Funds | |
|
The following table shows list of key exchange traded funds (ETF) that
help investors track Midcap index. The following list also includes leveraged ETF funds that track twice or thrice the daily returns of Midcap indices. Short or inverse ETF funds move in the opposite direction to the index they track and are useful during market pullbacks or during bear markets. Quick View: Move mouse or cursor over ETF symbol (ticker) to view short-term technical chart and over ETF name to view long term chart. Click on ticker or stock name for detailed view. Click on to add stock symbol to your watchlist and to view watchlist. |
12Stocks.com List of ETFs that track Midcap Index
| Ticker | ETF Name | Watchlist | Recent Price | Smart Investing & Trading Score | Change % | Week % | Year-to-date % |
| IJH | iShares Core S&P Mid-Cap | | 56.43 | 41 | -0.14 | -2.52 | 1.8% |
| IWR | iShares Russell Mid-Cap | | 78.71 | 36 | -0.14 | -2.37 | 1.26% |
| MDY | SPDR S&P MidCap 400 ETF | | 516.55 | 36 | -0.14 | -2.53 | 1.81% |
| IWP | iShares Russell Mid-Cap Growth | | 106.50 | 36 | -0.49 | -3.04 | 1.95% |
| IWS | iShares Russell Mid-Cap Value | | 117.31 | 41 | -0.09 | -2.15 | 0.88% |
| IJK | iShares S&P Mid-Cap 400 Growth | | 85.03 | 41 | -0.36 | -2.8 | 7.33% |
| IJJ | iShares S&P Mid-Cap 400 Value | | 109.46 | 23 | 0.02 | -2.26 | -4.02% |
| XMLV | PowerShares S&P MidCap Low Volatil ETF | | 53.59 | 54 | 0.41 | -1.22 | 0.77% |
| UMDD | ProShares UltraPro MidCap400 | | 22.31 | 36 | -0.63 | -7.71 | -0.05% |
| MVV | ProShares Ultra MidCap400 | | 58.42 | 36 | -0.70 | -5.36 | 0.92% |
| SMDD | ProShares UltraPro Short MidCap400 | | 12.69 | 59 | 1.20 | 8 | -5.75% |
| MYY | ProShares Short MidCap400 | | 21.26 | 69 | 0.24 | 2.7 | -0.91% |
| MZZ | ProShares UltraShort MidCap400 | | 12.23 | 34 | 1.37 | 5.43 | -2.71% |
| 12Stocks.com: Charts, Trends, Fundamental Data and Performances of MidCap Stocks | |
|
We now take in-depth look at all MidCap stocks including charts, multi-period performances and overall trends (as measured by Smart Investing & Trading Score). One can sort MidCap stocks (click link to choose) by Daily, Weekly and by Year-to-Date performances. Also, one can sort by size of the company or by market capitalization. |
| Select Your Default Chart Type: | |||||
| |||||
| Click on stock symbol or name for detailed view. Click on to add stock symbol to your watchlist and to view watchlist. Quick View: Move mouse or cursor over "Daily" to quickly view daily technical stock chart and over "Weekly" to view weekly technical stock chart. | |||||

 | HUBB Hubbell Incorporated |
| Sector: Technology | |
| SubSector: Diversified Electronics | |
| MarketCap: 6002.46 Millions | |
| Recent Price: 392.28 Smart Investing & Trading Score: 48 | |
| Day Percent Change: 0.34% Day Change: 1.31 | |
| Week Change: -2.35% Year-to-date Change: 19.3% | |
| HUBB Links: Profile News Message Board | |
| Charts:- Daily , Weekly | |
| Add HUBB to Watchlist: View: Get Complete HUBB Trend Analysis ➞ | |
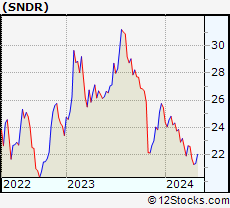 | SNDR Schneider National, Inc. |
| Sector: Transports | |
| SubSector: Trucking | |
| MarketCap: 3299.95 Millions | |
| Recent Price: 20.72 Smart Investing & Trading Score: 0 | |
| Day Percent Change: 0.34% Day Change: 0.07 | |
| Week Change: -4.43% Year-to-date Change: -18.6% | |
| SNDR Links: Profile News Message Board | |
| Charts:- Daily , Weekly | |
| Add SNDR to Watchlist: View: Get Complete SNDR Trend Analysis ➞ | |
 | TPG TPG Inc. |
| Sector: Financials | |
| SubSector: Asset Management | |
| MarketCap: 8700 Millions | |
| Recent Price: 42.95 Smart Investing & Trading Score: 58 | |
| Day Percent Change: 0.34% Day Change: 0.14 | |
| Week Change: -0.82% Year-to-date Change: -0.7% | |
| TPG Links: Profile News Message Board | |
| Charts:- Daily , Weekly | |
| Add TPG to Watchlist: View: Get Complete TPG Trend Analysis ➞ | |
 | BAX Baxter International Inc. |
| Sector: Health Care | |
| SubSector: Medical Instruments & Supplies | |
| MarketCap: 39955.8 Millions | |
| Recent Price: 39.65 Smart Investing & Trading Score: 46 | |
| Day Percent Change: 0.33% Day Change: 0.13 | |
| Week Change: -1.69% Year-to-date Change: 2.6% | |
| BAX Links: Profile News Message Board | |
| Charts:- Daily , Weekly | |
| Add BAX to Watchlist: View: Get Complete BAX Trend Analysis ➞ | |
 | DXCM DexCom, Inc. |
| Sector: Health Care | |
| SubSector: Medical Laboratories & Research | |
| MarketCap: 19559 Millions | |
| Recent Price: 134.30 Smart Investing & Trading Score: 61 | |
| Day Percent Change: 0.33% Day Change: 0.44 | |
| Week Change: -1.35% Year-to-date Change: 8.2% | |
| DXCM Links: Profile News Message Board | |
| Charts:- Daily , Weekly | |
| Add DXCM to Watchlist: View: Get Complete DXCM Trend Analysis ➞ | |
 | WRB W. R. Berkley Corporation |
| Sector: Financials | |
| SubSector: Property & Casualty Insurance | |
| MarketCap: 9863.82 Millions | |
| Recent Price: 80.98 Smart Investing & Trading Score: 10 | |
| Day Percent Change: 0.33% Day Change: 0.27 | |
| Week Change: -1.42% Year-to-date Change: 14.5% | |
| WRB Links: Profile News Message Board | |
| Charts:- Daily , Weekly | |
| Add WRB to Watchlist: View: Get Complete WRB Trend Analysis ➞ | |
 | RBLX Roblox Corporation |
| Sector: Services & Goods | |
| SubSector: Electronic Gaming & Multimedia | |
| MarketCap: 25420 Millions | |
| Recent Price: 36.49 Smart Investing & Trading Score: 8 | |
| Day Percent Change: 0.33% Day Change: 0.12 | |
| Week Change: -4.9% Year-to-date Change: -20.9% | |
| RBLX Links: Profile News Message Board | |
| Charts:- Daily , Weekly | |
| Add RBLX to Watchlist: View: Get Complete RBLX Trend Analysis ➞ | |
 | STT State Street Corporation |
| Sector: Financials | |
| SubSector: Asset Management | |
| MarketCap: 18623 Millions | |
| Recent Price: 73.04 Smart Investing & Trading Score: 17 | |
| Day Percent Change: 0.32% Day Change: 0.23 | |
| Week Change: -3.62% Year-to-date Change: -5.7% | |
| STT Links: Profile News Message Board | |
| Charts:- Daily , Weekly | |
| Add STT to Watchlist: View: Get Complete STT Trend Analysis ➞ | |
 | CNHI CNH Industrial N.V. |
| Sector: Industrials | |
| SubSector: Farm & Construction Machinery | |
| MarketCap: 9366.57 Millions | |
| Recent Price: 12.40 Smart Investing & Trading Score: 36 | |
| Day Percent Change: 0.32% Day Change: 0.04 | |
| Week Change: -1.82% Year-to-date Change: 1.8% | |
| CNHI Links: Profile News Message Board | |
| Charts:- Daily , Weekly | |
| Add CNHI to Watchlist: View: Get Complete CNHI Trend Analysis ➞ | |
 | MOH Molina Healthcare, Inc. |
| Sector: Health Care | |
| SubSector: Health Care Plans | |
| MarketCap: 7235.6 Millions | |
| Recent Price: 360.94 Smart Investing & Trading Score: 51 | |
| Day Percent Change: 0.30% Day Change: 1.09 | |
| Week Change: -4.15% Year-to-date Change: -0.1% | |
| MOH Links: Profile News Message Board | |
| Charts:- Daily , Weekly | |
| Add MOH to Watchlist: View: Get Complete MOH Trend Analysis ➞ | |
 | TDOC Teladoc Health, Inc. |
| Sector: Technology | |
| SubSector: Healthcare Information Services | |
| MarketCap: 11968.5 Millions | |
| Recent Price: 13.18 Smart Investing & Trading Score: 5 | |
| Day Percent Change: 0.30% Day Change: 0.04 | |
| Week Change: -7.25% Year-to-date Change: -38.8% | |
| TDOC Links: Profile News Message Board | |
| Charts:- Daily , Weekly | |
| Add TDOC to Watchlist: View: Get Complete TDOC Trend Analysis ➞ | |
 | HAYW Hayward Holdings, Inc. |
| Sector: Industrials | |
| SubSector: Electrical Equipment & Parts | |
| MarketCap: 2670 Millions | |
| Recent Price: 13.29 Smart Investing & Trading Score: 36 | |
| Day Percent Change: 0.30% Day Change: 0.04 | |
| Week Change: -4.04% Year-to-date Change: -2.4% | |
| HAYW Links: Profile News Message Board | |
| Charts:- Daily , Weekly | |
| Add HAYW to Watchlist: View: Get Complete HAYW Trend Analysis ➞ | |
 | STE STERIS plc |
| Sector: Health Care | |
| SubSector: Medical Instruments & Supplies | |
| MarketCap: 10875 Millions | |
| Recent Price: 200.81 Smart Investing & Trading Score: 25 | |
| Day Percent Change: 0.28% Day Change: 0.57 | |
| Week Change: -1.56% Year-to-date Change: -8.7% | |
| STE Links: Profile News Message Board | |
| Charts:- Daily , Weekly | |
| Add STE to Watchlist: View: Get Complete STE Trend Analysis ➞ | |
 | BLD TopBuild Corp. |
| Sector: Industrials | |
| SubSector: General Building Materials | |
| MarketCap: 2534.53 Millions | |
| Recent Price: 389.81 Smart Investing & Trading Score: 26 | |
| Day Percent Change: 0.28% Day Change: 1.07 | |
| Week Change: -6.74% Year-to-date Change: 4.2% | |
| BLD Links: Profile News Message Board | |
| Charts:- Daily , Weekly | |
| Add BLD to Watchlist: View: Get Complete BLD Trend Analysis ➞ | |
 | TTC The Toro Company |
| Sector: Industrials | |
| SubSector: Small Tools & Accessories | |
| MarketCap: 6426.96 Millions | |
| Recent Price: 84.51 Smart Investing & Trading Score: 10 | |
| Day Percent Change: 0.27% Day Change: 0.23 | |
| Week Change: -1.47% Year-to-date Change: -12.0% | |
| TTC Links: Profile News Message Board | |
| Charts:- Daily , Weekly | |
| Add TTC to Watchlist: View: Get Complete TTC Trend Analysis ➞ | |
 | AOS A. O. Smith Corporation |
| Sector: Industrials | |
| SubSector: Industrial Electrical Equipment | |
| MarketCap: 5809.89 Millions | |
| Recent Price: 86.69 Smart Investing & Trading Score: 70 | |
| Day Percent Change: 0.27% Day Change: 0.23 | |
| Week Change: 0.22% Year-to-date Change: 5.2% | |
| AOS Links: Profile News Message Board | |
| Charts:- Daily , Weekly | |
| Add AOS to Watchlist: View: Get Complete AOS Trend Analysis ➞ | |
 | BFAM Bright Horizons Family Solutions Inc. |
| Sector: Services & Goods | |
| SubSector: Personal Services | |
| MarketCap: 5487.65 Millions | |
| Recent Price: 103.72 Smart Investing & Trading Score: 36 | |
| Day Percent Change: 0.27% Day Change: 0.28 | |
| Week Change: -4.99% Year-to-date Change: 10.1% | |
| BFAM Links: Profile News Message Board | |
| Charts:- Daily , Weekly | |
| Add BFAM to Watchlist: View: Get Complete BFAM Trend Analysis ➞ | |
 | NCNO nCino, Inc. |
| Sector: Technology | |
| SubSector: Software Application | |
| MarketCap: 74187 Millions | |
| Recent Price: 29.76 Smart Investing & Trading Score: 10 | |
| Day Percent Change: 0.27% Day Change: 0.08 | |
| Week Change: -7.49% Year-to-date Change: -11.5% | |
| NCNO Links: Profile News Message Board | |
| Charts:- Daily , Weekly | |
| Add NCNO to Watchlist: View: Get Complete NCNO Trend Analysis ➞ | |
 | OKE ONEOK, Inc. |
| Sector: Utilities | |
| SubSector: Gas Utilities | |
| MarketCap: 10788.7 Millions | |
| Recent Price: 77.88 Smart Investing & Trading Score: 61 | |
| Day Percent Change: 0.26% Day Change: 0.20 | |
| Week Change: -1.04% Year-to-date Change: 10.9% | |
| OKE Links: Profile News Message Board | |
| Charts:- Daily , Weekly | |
| Add OKE to Watchlist: View: Get Complete OKE Trend Analysis ➞ | |
 | XRAY DENTSPLY SIRONA Inc. |
| Sector: Health Care | |
| SubSector: Medical Instruments & Supplies | |
| MarketCap: 7746.1 Millions | |
| Recent Price: 30.44 Smart Investing & Trading Score: 10 | |
| Day Percent Change: 0.26% Day Change: 0.08 | |
| Week Change: -2.75% Year-to-date Change: -14.5% | |
| XRAY Links: Profile News Message Board | |
| Charts:- Daily , Weekly | |
| Add XRAY to Watchlist: View: Get Complete XRAY Trend Analysis ➞ | |
 | IPGP IPG Photonics Corporation |
| Sector: Technology | |
| SubSector: Semiconductor Equipment & Materials | |
| MarketCap: 6059.38 Millions | |
| Recent Price: 84.59 Smart Investing & Trading Score: 28 | |
| Day Percent Change: 0.26% Day Change: 0.22 | |
| Week Change: -1.35% Year-to-date Change: -22.1% | |
| IPGP Links: Profile News Message Board | |
| Charts:- Daily , Weekly | |
| Add IPGP to Watchlist: View: Get Complete IPGP Trend Analysis ➞ | |
 | WHR Whirlpool Corporation |
| Sector: Consumer Staples | |
| SubSector: Appliances | |
| MarketCap: 5015.08 Millions | |
| Recent Price: 104.11 Smart Investing & Trading Score: 20 | |
| Day Percent Change: 0.25% Day Change: 0.26 | |
| Week Change: -3.66% Year-to-date Change: -14.5% | |
| WHR Links: Profile News Message Board | |
| Charts:- Daily , Weekly | |
| Add WHR to Watchlist: View: Get Complete WHR Trend Analysis ➞ | |
 | NNN National Retail Properties, Inc. |
| Sector: Financials | |
| SubSector: REIT - Diversified | |
| MarketCap: 5459.93 Millions | |
| Recent Price: 39.77 Smart Investing & Trading Score: 25 | |
| Day Percent Change: 0.25% Day Change: 0.10 | |
| Week Change: -2.55% Year-to-date Change: -7.7% | |
| NNN Links: Profile News Message Board | |
| Charts:- Daily , Weekly | |
| Add NNN to Watchlist: View: Get Complete NNN Trend Analysis ➞ | |
 | LPLA LPL Financial Holdings Inc. |
| Sector: Financials | |
| SubSector: Investment Brokerage - National | |
| MarketCap: 4104.65 Millions | |
| Recent Price: 259.77 Smart Investing & Trading Score: 53 | |
| Day Percent Change: 0.25% Day Change: 0.66 | |
| Week Change: -0.52% Year-to-date Change: 14.1% | |
| LPLA Links: Profile News Message Board | |
| Charts:- Daily , Weekly | |
| Add LPLA to Watchlist: View: Get Complete LPLA Trend Analysis ➞ | |
 | HOLX Hologic, Inc. |
| Sector: Health Care | |
| SubSector: Medical Instruments & Supplies | |
| MarketCap: 9075.2 Millions | |
| Recent Price: 75.10 Smart Investing & Trading Score: 36 | |
| Day Percent Change: 0.24% Day Change: 0.18 | |
| Week Change: -2.88% Year-to-date Change: 5.1% | |
| HOLX Links: Profile News Message Board | |
| Charts:- Daily , Weekly | |
| Add HOLX to Watchlist: View: Get Complete HOLX Trend Analysis ➞ | |
| For tabular summary view of above stock list: Summary View ➞ 0 - 25 , 25 - 50 , 50 - 75 , 75 - 100 , 100 - 125 , 125 - 150 , 150 - 175 , 175 - 200 , 200 - 225 , 225 - 250 , 250 - 275 , 275 - 300 , 300 - 325 , 325 - 350 , 350 - 375 , 375 - 400 , 400 - 425 , 425 - 450 , 450 - 475 , 475 - 500 , 500 - 525 , 525 - 550 , 550 - 575 , 575 - 600 , 600 - 625 , 625 - 650 , 650 - 675 , 675 - 700 , 700 - 725 , 725 - 750 , 750 - 775 | ||
| Click To Change The Sort Order: By Market Cap or Company Size Performance: Year-to-date, Week and Day | |
| Select Chart Type: | ||
|
Best Stocks Today 12Stocks.com |
© 2024 12Stocks.com Terms & Conditions Privacy Contact Us
All Information Provided Only For Education And Not To Be Used For Investing or Trading. See Terms & Conditions


One More Thing ... Get Best Stocks Delivered Daily!
Never Ever Miss A Move With Our Top Ten Stocks Lists
Find Best Stocks In Any Market - Bull or Bear Market
Take A Peek At Our Top Ten Stocks Lists: Daily, Weekly, Year-to-Date & Top Trends
Find Best Stocks In Any Market - Bull or Bear Market
Take A Peek At Our Top Ten Stocks Lists: Daily, Weekly, Year-to-Date & Top Trends
Midcap Stocks With Best Up Trends [0-bearish to 100-bullish]: Genuine Parts[100], United Airlines[100], Medical Properties[100], Alaska Air[100], Flowers Foods[100], HEICO [95], Generac [93], Bunge [93], Conagra [93], Inspire Medical[93], Coupang [90]
Best Midcap Stocks Year-to-Date:
AppLovin [77.99%], ShockWave Medical[71.87%], Vistra Energy[71.03%], Constellation Energy[59.78%], EMCOR [55.99%], Spotify [53.9%], Pure Storage[45.32%], CAVA [44.09%], Natera [39.34%], Wingstop [38.9%], Williams-Sonoma [38.53%] Best Midcap Stocks This Week:
Medical Properties[25.06%], United Airlines[23.01%], Genuine Parts[10.21%], AMC Entertainment[10.19%], Globe Life[10%], Advance Auto[9.5%], Bentley [8.14%], Alaska Air[7.6%], American Airlines[6.62%], Flowers Foods[6.28%], agilon health[5.96%] Best Midcap Stocks Daily:
Genuine Parts[11.22%], Ally Financial[6.73%], Coinbase Global[5.90%], Manpower [5.65%], United Airlines[5.50%], Iridium [5.46%], Ginkgo Bioworks[5.13%], Bank OZK[4.73%], agilon health[4.69%], Medical Properties[4.61%], Kohl s[4.53%]