
 Login Sign Up


| |||||
 |  | ||||

| 12Stocks.com Market Intelligence |
Best Consumer Services Stocks
| In a hurry? Services & Goods Stocks: Performance Trends Table, Stock Charts
Sort Consumer Services: Daily, Weekly, Year-to-Date, Market Cap & Trends. Filter Services & Goods stocks list by size: All Large Mid-Range Small |
| 12Stocks.com Consumer Services Stocks Performances & Trends Daily | |||||||||
|
|  The overall Smart Investing & Trading Score is 100 (0-bearish to 100-bullish) which puts Consumer Services sector in short term bullish trend. The Smart Investing & Trading Score from previous trading session is 100 and an improvement of trend continues.
| ||||||||
Here are the Smart Investing & Trading Scores of the most requested Consumer Services stocks at 12Stocks.com (click stock name for detailed review):
|


| Consider signing up for our daily 12Stocks.com "Best Stocks Newsletter". You will never ever miss a big stock move again! |
| 12Stocks.com: Investing in Consumer Services sector with Stocks | |
|
The following table helps investors and traders sort through current performance and trends (as measured by Smart Investing & Trading Score) of various
stocks in the Consumer Services sector. Quick View: Move mouse or cursor over stock symbol (ticker) to view short-term Technical chart and over stock name to view long term chart. Click on  to add stock symbol to your watchlist and to add stock symbol to your watchlist and  to view watchlist. Click on any ticker or stock name for detailed market intelligence report for that stock. to view watchlist. Click on any ticker or stock name for detailed market intelligence report for that stock. |
12Stocks.com Performance of Stocks in Consumer Services Sector
| Ticker | Stock Name | Watchlist | Category | Recent Price | Smart Investing & Trading Score | Change % | Weekly Change% |
| XPOF | Xponential Fitness |   | Leisure | 8.63 | 40 | 2.47% | -17.44% |
| DHX | DHI | | Staffing | 2.19 | 40 | -59.10% | -17.71% |
| GENK | GEN Restaurant | | Restaurants | 3.38 | 58 | 6.71% | -18.07% |
| CAVA | CAVA | | Restaurants | 69.90 | 64 | 18.12% | -18.23% |
| GDHG | Golden Heaven | | Leisure | 0.43 | 51 | -2.44% | -18.53% |
| WW | WW | | Services | 31.74 | 20 | 6.87% | -19.09% |
| ACVA | ACV Auctions | | Auto & Truck Dealerships | 11.71 | 30 | 2.38% | -19.26% |
| COOK | Traeger | | Furnishings, Fixtures & Appliances | 1.32 | 10 | 9.06% | -20.00% |
| LESL | Leslies | | Home Improvement Retail | 0.35 | 60 | 5.28% | -21.04% |
| SG | Sweetgreen | | Restaurants | 9.19 | 0 | 7.66% | -22.00% |
| UTI | Universal Technical | | Education | 26.03 | 0 | -0.17% | -22.89% |
| UA | Under Armour | | Apparel | 5.01 | 30 | 2.92% | -23.08% |
| SEAT | Vivid Seats | | Internet Content & Information | 17.33 | 20 | 6.09% | -29.21% |
| BIRD | Allbirds | | Apparel Retail | 7.03 | 63 | 4.92% | -30.77% |
| VMAR | Vision Marine | | Leisure | 1.94 | 20 | -12.56% | -34.06% |
| For chart view version of above stock list: Chart View ➞ 0 - 25 , 25 - 50 , 50 - 75 , 75 - 100 , 100 - 125 , 125 - 150 , 150 - 175 , 175 - 200 , 200 - 225 , 225 - 250 , 250 - 275 , 275 - 300 , 300 - 325 , 325 - 350 , 350 - 375 , 375 - 400 , 400 - 425 | ||
 | Click To Change The Sort Order: By Market Cap or Company Size Performance: Year-to-date, Week and Day |  |
|
Get the most comprehensive stock market coverage daily at 12Stocks.com ➞ Best Stocks Today ➞ Best Stocks Weekly ➞ Best Stocks Year-to-Date ➞ Best Stocks Trends ➞  Best Stocks Today 12Stocks.com Best Nasdaq Stocks ➞ Best S&P 500 Stocks ➞ Best Tech Stocks ➞ Best Biotech Stocks ➞ |
| Detailed Overview of Consumer Services Stocks |
| Consumer Services Technical Overview, Leaders & Laggards, Top Consumer Services ETF Funds & Detailed Consumer Services Stocks List, Charts, Trends & More |
| Consumer Services Sector: Technical Analysis, Trends & YTD Performance | |
| Consumer Services sector is composed of stocks
from retail, entertainment, media/publishing, consumer goods
and services subsectors. Consumer Services sector, as represented by XLY, an exchange-traded fund [ETF] that holds basket of Consumer Services stocks (e.g, Walmart, Alibaba) is up by 2.95% and is currently underperforming the overall market by -7.38% year-to-date. Below is a quick view of Technical charts and trends: |
|
 XLY Weekly Chart |
|
| Long Term Trend: Very Good | |
| Medium Term Trend: Very Good | |
 XLY Daily Chart |
|
| Short Term Trend: Very Good | |
| Overall Trend Score: 100 | |
| YTD Performance: 2.95% | |
| **Trend Scores & Views Are Only For Educational Purposes And Not For Investing | |
| 12Stocks.com: Top Performing Consumer Services Sector Stocks | ||||||||||||||||||||||||||||||||||||||||||||||
 The top performing Consumer Services sector stocks year to date are
Now, more recently, over last week, the top performing Consumer Services sector stocks on the move are


|
||||||||||||||||||||||||||||||||||||||||||||||
| 12Stocks.com: Investing in Consumer Services Sector using Exchange Traded Funds | |
|
The following table shows list of key exchange traded funds (ETF) that
help investors track Consumer Services Index. For detailed view, check out our ETF Funds section of our website. Quick View: Move mouse or cursor over ETF symbol (ticker) to view short-term Technical chart and over ETF name to view long term chart. Click on ticker or stock name for detailed view. Click on to add stock symbol to your watchlist and to view watchlist. |
12Stocks.com List of ETFs that track Consumer Services Index
| Ticker | ETF Name | Watchlist | Recent Price | Smart Investing & Trading Score | Change % | Week % | Year-to-date % |
| XLY | Consumer Discret Sel | | 229.04 | 100 | 2.01 | 2.86 | 2.95% |
| RTH | Retail | | 247.72 | 100 | 0.63 | 0.8 | 10.46% |
| IYC | Consumer Services | | 102.72 | 100 | 1.68 | 2.04 | 7.35% |
| XRT | Retail | | 83.59 | 100 | 2.54 | 4.47 | 7.4% |
| IYK | Consumer Goods | | 70.21 | 40 | 0.37 | 1.49 | 8.38% |
| UCC | Consumer Services | | 49.53 | 100 | 2.96 | 5.78 | -2.73% |
| RETL | Retail Bull 3X | | 9.42 | 100 | 26.94 | 13.16 | 0.86% |
| RXI | Globl Consumer Discretionary | | 196.05 | 100 | 0.53 | 3.13 | 7.68% |
| SCC | Short Consumer Services | | 16.04 | 0 | -19.86 | -5.49 | -12.44% |
| UGE | Consumer Goods | | 18.79 | 20 | 1.05 | 2.4 | 7.27% |
| 12Stocks.com: Charts, Trends, Fundamental Data and Performances of Consumer Services Stocks | |
|
We now take in-depth look at all Consumer Services stocks including charts, multi-period performances and overall trends (as measured by Smart Investing & Trading Score). One can sort Consumer Services stocks (click link to choose) by Daily, Weekly and by Year-to-Date performances. Also, one can sort by size of the company or by market capitalization. |
| Select Your Default Chart Type: | |||||
| |||||
| Click on stock symbol or name for detailed view. Click on to add stock symbol to your watchlist and to view watchlist. Quick View: Move mouse or cursor over "Daily" to quickly view daily Technical stock chart and over "Weekly" to view weekly Technical stock chart. | |||||

 | XPOF Xponential Fitness, Inc. |
| Sector: Services & Goods | |
| SubSector: Leisure | |
| MarketCap: 811 Millions | |
| Recent Price: 8.63 Smart Investing & Trading Score: 40 | |
| Day Percent Change: 2.47% Day Change: 0.35 | |
| Week Change: -17.44% Year-to-date Change: -36.7% | |
| XPOF Links: Profile News Message Board | |
| Charts:- Daily , Weekly | |
| Add XPOF to Watchlist: View: Get Complete XPOF Trend Analysis ➞ | |
 | DHX DHI Group, Inc. |
| Sector: Services & Goods | |
| SubSector: Staffing & Outsourcing Services | |
| MarketCap: 144.728 Millions | |
| Recent Price: 2.19 Smart Investing & Trading Score: 40 | |
| Day Percent Change: -59.1% Day Change: -2.37 | |
| Week Change: -17.71% Year-to-date Change: 26.0% | |
| DHX Links: Profile News Message Board | |
| Charts:- Daily , Weekly | |
| Add DHX to Watchlist: View: Get Complete DHX Trend Analysis ➞ | |
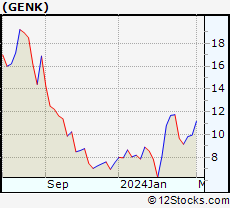 | GENK GEN Restaurant Group, Inc. Class A Common Stock |
| Sector: Services & Goods | |
| SubSector: Restaurants | |
| MarketCap: 544 Millions | |
| Recent Price: 3.38 Smart Investing & Trading Score: 58 | |
| Day Percent Change: 6.71% Day Change: 0.58 | |
| Week Change: -18.07% Year-to-date Change: -54.2% | |
| GENK Links: Profile News Message Board | |
| Charts:- Daily , Weekly | |
| Add GENK to Watchlist: View: Get Complete GENK Trend Analysis ➞ | |
 | CAVA CAVA Group, Inc. |
| Sector: Services & Goods | |
| SubSector: Restaurants | |
| MarketCap: 4510 Millions | |
| Recent Price: 69.90 Smart Investing & Trading Score: 64 | |
| Day Percent Change: 18.12% Day Change: 18.72 | |
| Week Change: -18.23% Year-to-date Change: -37.5% | |
| CAVA Links: Profile News Message Board | |
| Charts:- Daily , Weekly | |
| Add CAVA to Watchlist: View: Get Complete CAVA Trend Analysis ➞ | |
 | GDHG Golden Heaven Group Holdings Ltd. |
| Sector: Services & Goods | |
| SubSector: Leisure | |
| MarketCap: 230 Millions | |
| Recent Price: 0.43 Smart Investing & Trading Score: 51 | |
| Day Percent Change: -2.44% Day Change: 0 | |
| Week Change: -18.53% Year-to-date Change: -99.2% | |
| GDHG Links: Profile News Message Board | |
| Charts:- Daily , Weekly | |
| Add GDHG to Watchlist: View: Get Complete GDHG Trend Analysis ➞ | |
 | WW WW International, Inc. |
| Sector: Services & Goods | |
| SubSector: Personal Services | |
| MarketCap: 1186.25 Millions | |
| Recent Price: 31.74 Smart Investing & Trading Score: 20 | |
| Day Percent Change: 6.87% Day Change: 0.07 | |
| Week Change: -19.09% Year-to-date Change: 2,516.5% | |
| WW Links: Profile News Message Board | |
| Charts:- Daily , Weekly | |
| Add WW to Watchlist: View: Get Complete WW Trend Analysis ➞ | |
 | ACVA ACV Auctions Inc. |
| Sector: Services & Goods | |
| SubSector: Auto & Truck Dealerships | |
| MarketCap: 2680 Millions | |
| Recent Price: 11.71 Smart Investing & Trading Score: 30 | |
| Day Percent Change: 2.38% Day Change: 0.44 | |
| Week Change: -19.26% Year-to-date Change: -46.4% | |
| ACVA Links: Profile News Message Board | |
| Charts:- Daily , Weekly | |
| Add ACVA to Watchlist: View: Get Complete ACVA Trend Analysis ➞ | |
 | COOK Traeger, Inc. |
| Sector: Services & Goods | |
| SubSector: Furnishings, Fixtures & Appliances | |
| MarketCap: 524 Millions | |
| Recent Price: 1.32 Smart Investing & Trading Score: 10 | |
| Day Percent Change: 9.06% Day Change: 0.3 | |
| Week Change: -20% Year-to-date Change: -43.1% | |
| COOK Links: Profile News Message Board | |
| Charts:- Daily , Weekly | |
| Add COOK to Watchlist: View: Get Complete COOK Trend Analysis ➞ | |
 | LESL Leslies, Inc. |
| Sector: Services & Goods | |
| SubSector: Home Improvement Retail | |
| MarketCap: 37927 Millions | |
| Recent Price: 0.35 Smart Investing & Trading Score: 60 | |
| Day Percent Change: 5.28% Day Change: 0.15 | |
| Week Change: -21.04% Year-to-date Change: -87.1% | |
| LESL Links: Profile News Message Board | |
| Charts:- Daily , Weekly | |
| Add LESL to Watchlist: View: Get Complete LESL Trend Analysis ➞ | |
 | SG Sweetgreen, Inc. |
| Sector: Services & Goods | |
| SubSector: Restaurants | |
| MarketCap: 1420 Millions | |
| Recent Price: 9.19 Smart Investing & Trading Score: 0 | |
| Day Percent Change: 7.66% Day Change: 2.68 | |
| Week Change: -22% Year-to-date Change: -70.0% | |
| SG Links: Profile News Message Board | |
| Charts:- Daily , Weekly | |
| Add SG to Watchlist: View: Get Complete SG Trend Analysis ➞ | |
 | UTI Universal Technical Institute, Inc. |
| Sector: Services & Goods | |
| SubSector: Education & Training Services | |
| MarketCap: 163.506 Millions | |
| Recent Price: 26.03 Smart Investing & Trading Score: 0 | |
| Day Percent Change: -0.17% Day Change: -0.03 | |
| Week Change: -22.89% Year-to-date Change: 0.2% | |
| UTI Links: Profile News Message Board | |
| Charts:- Daily , Weekly | |
| Add UTI to Watchlist: View: Get Complete UTI Trend Analysis ➞ | |
 | UA Under Armour, Inc. |
| Sector: Services & Goods | |
| SubSector: Textile - Apparel Clothing | |
| MarketCap: 3926.93 Millions | |
| Recent Price: 5.01 Smart Investing & Trading Score: 30 | |
| Day Percent Change: 2.92% Day Change: 0.23 | |
| Week Change: -23.08% Year-to-date Change: -34.3% | |
| UA Links: Profile News Message Board | |
| Charts:- Daily , Weekly | |
| Add UA to Watchlist: View: Get Complete UA Trend Analysis ➞ | |
 | SEAT Vivid Seats Inc. |
| Sector: Services & Goods | |
| SubSector: Internet Content & Information | |
| MarketCap: 1560 Millions | |
| Recent Price: 17.33 Smart Investing & Trading Score: 20 | |
| Day Percent Change: 6.09% Day Change: 0.27 | |
| Week Change: -29.21% Year-to-date Change: -80.4% | |
| SEAT Links: Profile News Message Board | |
| Charts:- Daily , Weekly | |
| Add SEAT to Watchlist: View: Get Complete SEAT Trend Analysis ➞ | |
 | BIRD Allbirds, Inc. |
| Sector: Services & Goods | |
| SubSector: Apparel Retail | |
| MarketCap: 184 Millions | |
| Recent Price: 7.03 Smart Investing & Trading Score: 63 | |
| Day Percent Change: 4.92% Day Change: 0.04 | |
| Week Change: -30.77% Year-to-date Change: 1.5% | |
| BIRD Links: Profile News Message Board | |
| Charts:- Daily , Weekly | |
| Add BIRD to Watchlist: View: Get Complete BIRD Trend Analysis ➞ | |
 | VMAR Vision Marine Technologies Inc. |
| Sector: Services & Goods | |
| SubSector: Leisure | |
| MarketCap: 99027 Millions | |
| Recent Price: 1.94 Smart Investing & Trading Score: 20 | |
| Day Percent Change: -12.56% Day Change: -0.51 | |
| Week Change: -34.06% Year-to-date Change: -79.1% | |
| VMAR Links: Profile News Message Board | |
| Charts:- Daily , Weekly | |
| Add VMAR to Watchlist: View: Get Complete VMAR Trend Analysis ➞ | |
| For tabular summary view of above stock list: Summary View ➞ 0 - 25 , 25 - 50 , 50 - 75 , 75 - 100 , 100 - 125 , 125 - 150 , 150 - 175 , 175 - 200 , 200 - 225 , 225 - 250 , 250 - 275 , 275 - 300 , 300 - 325 , 325 - 350 , 350 - 375 , 375 - 400 , 400 - 425 | ||
| Click To Change The Sort Order: By Market Cap or Company Size Performance: Year-to-date, Week and Day | |
| Select Chart Type: | ||
|
Best Stocks Today 12Stocks.com |
© 2025 12Stocks.com Terms & Conditions Privacy Contact Us
All Information Provided Only For Education And Not To Be Used For Investing or Trading. See Terms & Conditions


One More Thing ... Get Best Stocks Delivered Daily!
Never Ever Miss A Move With Our Top Ten Stocks Lists
Find Best Stocks In Any Market - Bull or Bear Market
Take A Peek At Our Top Ten Stocks Lists: Daily, Weekly, Year-to-Date & Top Trends
Find Best Stocks In Any Market - Bull or Bear Market
Take A Peek At Our Top Ten Stocks Lists: Daily, Weekly, Year-to-Date & Top Trends
Consumer Services Stocks With Best Up Trends [0-bearish to 100-bullish]: Louisiana-Pacific [100], eBay [100], Graham [100], Fastenal [100], Wayfair [100], Gaia [100], Gray Television[100], Haverty Furniture[100], RealReal [100], Resideo Technologies[100], Holley [100]
Best Consumer Services Stocks Year-to-Date:
MedEquities Realty[294856%], WW [2516.54%], ThredUp [656.12%], Willdan [210.66%], Kratos Defense[160.61%], IHS Holding[134.93%], Yatsen Holding[133.67%], National Vision[122.84%], Roblox [119.12%], Altisource Portfolio[97.94%], Jumia Technologies[95.29%] Best Consumer Services Stocks This Week:
MedEquities Realty[411381%], Jumia Technologies[62.88%], Money[56.67%], Brilliant Earth[44.93%], Holley [35.82%], RealReal [35.65%], Willdan [34.44%], ATRenew [33.14%], Gray Television[33.03%], Arhaus [28.98%], Park-Ohio [27.27%] Best Consumer Services Stocks Daily:
CareDx [185.69%], Wingstop [150.46%], Spotify Technology[147.52%], National CineMedia[112.46%], VSE [69.41%], Burlington Stores[66.03%], Myriad Genetics[64.88%], Costco Wholesale[58.1%], Daily Journal[57.5%], Texas Roadhouse[55.27%], Royal Caribbean[53.63%]