
 Login Sign Up


| |||||
 |  | ||||

| 12Stocks.com Market Intelligence |
Best Consumer Services Stocks
| In a hurry? Services & Goods Stocks: Performance Trends Table, Stock Charts
Sort Consumer Services: Daily, Weekly, Year-to-Date, Market Cap & Trends. Filter Services & Goods stocks list by size: All Large Mid-Range Small |
| 12Stocks.com Consumer Services Stocks Performances & Trends Daily | |||||||||
|
|  The overall Smart Investing & Trading Score is 100 (0-bearish to 100-bullish) which puts Consumer Services sector in short term bullish trend. The Smart Investing & Trading Score from previous trading session is 90 and an improvement of trend continues.
| ||||||||
Here are the Smart Investing & Trading Scores of the most requested Consumer Services stocks at 12Stocks.com (click stock name for detailed review):
|


| Consider signing up for our daily 12Stocks.com "Best Stocks Newsletter". You will never ever miss a big stock move again! |
| 12Stocks.com: Investing in Consumer Services sector with Stocks | |
|
The following table helps investors and traders sort through current performance and trends (as measured by Smart Investing & Trading Score) of various
stocks in the Consumer Services sector. Quick View: Move mouse or cursor over stock symbol (ticker) to view short-term Technical chart and over stock name to view long term chart. Click on  to add stock symbol to your watchlist and to add stock symbol to your watchlist and  to view watchlist. Click on any ticker or stock name for detailed market intelligence report for that stock. to view watchlist. Click on any ticker or stock name for detailed market intelligence report for that stock. |
12Stocks.com Performance of Stocks in Consumer Services Sector
| Ticker | Stock Name | Watchlist | Category | Recent Price | Smart Investing & Trading Score | Change % | Weekly Change% |
| VSEC | VSE |   | Services | 164.62 | 80 | 69.41% | 5.40% |
| CAKE | Cheesecake Factory | | Restaurants | 64.78 | 80 | 5.78% | 5.37% |
| GCI | Gannett Co | | Publishing | 4.34 | 100 | 2.09% | 5.34% |
| HD | Home Depot | | Retail | 407.18 | 100 | 2.94% | 5.27% |
| LQDT | Liquidity Services | | Retail | 26.15 | 80 | 22.37% | 5.23% |
| FAST | Fastenal | | Equipment | 49.21 | 100 | 20.11% | 5.19% |
| IPG | Interpublic | | Advertising | 26.20 | 90 | 1.80% | 5.14% |
| IMAX | IMAX | | Entertainment | 25.77 | 50 | 0.83% | 5.14% |
| CBZ | CBIZ | | Services | 65.03 | 50 | 1.55% | 4.97% |
| BABA | Alibaba | | Retail | 126.86 | 100 | 3.13% | 4.96% |
| EVI | EVI Industries | | Consumer Services | 24.45 | 90 | -33.56% | 4.89% |
| OMC | Omnicom | | Advertising | 76.47 | 70 | 1.33% | 4.83% |
| CCL | Carnival | | Casinos | 30.64 | 90 | 8.14% | 4.79% |
| MCS | Marcus | | Entertainment | 15.43 | 30 | 1.81% | 4.75% |
| WSM | Williams-Sonoma | | Retail | 210.20 | 100 | 6.79% | 4.71% |
| HLT | Hilton Worldwide | | Lodging | 272.85 | 80 | 0.71% | 4.56% |
| PENN | Penn National | | Casinos | 17.80 | 70 | 1.06% | 4.55% |
| ABM | ABM Industries | | Services | 49.53 | 70 | 1.75% | 4.52% |
| TAL | TAL Education | | Education | 11.68 | 100 | 0.35% | 4.47% |
| WCC | WESCO | | Equipment | 215.42 | 90 | 3.10% | 4.44% |
| CUK | Carnival | | Entertainment | 27.97 | 90 | 7.93% | 4.44% |
| PLAY | Dave & Buster s Entertainment | | Restaurants | 26.27 | 60 | 0.12% | 4.41% |
| IHG | InterContinental Hotels | | Lodging | 121.61 | 70 | 1.61% | 4.41% |
| SBGI | Slair Broadcast | | Broadcasting | 14.75 | 60 | 1.30% | 4.39% |
| LOCO | El Pollo | | Restaurants | 10.69 | 70 | 26.70% | 4.39% |
| For chart view version of above stock list: Chart View ➞ 0 - 25 , 25 - 50 , 50 - 75 , 75 - 100 , 100 - 125 , 125 - 150 , 150 - 175 , 175 - 200 , 200 - 225 , 225 - 250 , 250 - 275 , 275 - 300 | ||
 | Click To Change The Sort Order: By Market Cap or Company Size Performance: Year-to-date, Week and Day |  |
|
Get the most comprehensive stock market coverage daily at 12Stocks.com ➞ Best Stocks Today ➞ Best Stocks Weekly ➞ Best Stocks Year-to-Date ➞ Best Stocks Trends ➞  Best Stocks Today 12Stocks.com Best Nasdaq Stocks ➞ Best S&P 500 Stocks ➞ Best Tech Stocks ➞ Best Biotech Stocks ➞ |
| Detailed Overview of Consumer Services Stocks |
| Consumer Services Technical Overview, Leaders & Laggards, Top Consumer Services ETF Funds & Detailed Consumer Services Stocks List, Charts, Trends & More |
| Consumer Services Sector: Technical Analysis, Trends & YTD Performance | |
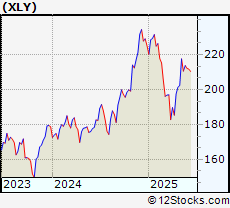
| Consumer Services sector is composed of stocks
from retail, entertainment, media/publishing, consumer goods
and services subsectors. Consumer Services sector, as represented by XLY, an exchange-traded fund [ETF] that holds basket of Consumer Services stocks (e.g, Walmart, Alibaba) is up by 2.95% and is currently underperforming the overall market by -7.38% year-to-date. Below is a quick view of Technical charts and trends: |
|
 XLY Weekly Chart |
|
| Long Term Trend: Very Good | |
| Medium Term Trend: Very Good | |
 XLY Daily Chart |
|
| Short Term Trend: Very Good | |
| Overall Trend Score: 100 | |
| YTD Performance: 2.95% | |
| **Trend Scores & Views Are Only For Educational Purposes And Not For Investing | |
| 12Stocks.com: Top Performing Consumer Services Sector Stocks | ||||||||||||||||||||||||||||||||||||||||||||||||
 The top performing Consumer Services sector stocks year to date are
Now, more recently, over last week, the top performing Consumer Services sector stocks on the move are


|
||||||||||||||||||||||||||||||||||||||||||||||||
| 12Stocks.com: Investing in Consumer Services Sector using Exchange Traded Funds | |
|
The following table shows list of key exchange traded funds (ETF) that
help investors track Consumer Services Index. For detailed view, check out our ETF Funds section of our website. Quick View: Move mouse or cursor over ETF symbol (ticker) to view short-term Technical chart and over ETF name to view long term chart. Click on ticker or stock name for detailed view. Click on to add stock symbol to your watchlist and to view watchlist. |
12Stocks.com List of ETFs that track Consumer Services Index
| Ticker | ETF Name | Watchlist | Recent Price | Smart Investing & Trading Score | Change % | Week % | Year-to-date % |
| XLY | Consumer Discret Sel | | 229.85 | 100 | 2.01 | 2.86 | 2.95% |
| RTH | Retail | | 247.67 | 100 | 0.63 | 0.8 | 10.46% |
| XRT | Retail | | 85.03 | 100 | 2.54 | 4.47 | 7.4% |
| IYK | Consumer Goods | | 70.39 | 70 | 0.37 | 1.49 | 8.38% |
| UCC | Consumer Services | | 49.99 | 100 | 2.96 | 5.78 | -2.73% |
| SCC | Short Consumer Services | | 15.90 | 0 | -19.86 | -5.49 | -12.44% |
| UGE | Consumer Goods | | 19.18 | 70 | 1.05 | 2.4 | 7.27% |
| 12Stocks.com: Charts, Trends, Fundamental Data and Performances of Consumer Services Stocks | |
|
We now take in-depth look at all Consumer Services stocks including charts, multi-period performances and overall trends (as measured by Smart Investing & Trading Score). One can sort Consumer Services stocks (click link to choose) by Daily, Weekly and by Year-to-Date performances. Also, one can sort by size of the company or by market capitalization. |
| Select Your Default Chart Type: | |||||
| |||||
| Click on stock symbol or name for detailed view. Click on to add stock symbol to your watchlist and to view watchlist. Quick View: Move mouse or cursor over "Daily" to quickly view daily Technical stock chart and over "Weekly" to view weekly Technical stock chart. | |||||

 | VSEC VSE Corporation |
| Sector: Services & Goods | |
| SubSector: Technical Services | |
| MarketCap: 183.61 Millions | |
| Recent Price: 164.62 Smart Investing & Trading Score: 80 | |
| Day Percent Change: 69.41% Day Change: 37.26 | |
| Week Change: 5.4% Year-to-date Change: 73.6% | |
| VSEC Links: Profile News Message Board | |
| Charts:- Daily , Weekly | |
| Add VSEC to Watchlist: View: Get Complete VSEC Trend Analysis ➞ | |
 | CAKE The Cheesecake Factory Incorporated |
| Sector: Services & Goods | |
| SubSector: Restaurants | |
| MarketCap: 829 Millions | |
| Recent Price: 64.78 Smart Investing & Trading Score: 80 | |
| Day Percent Change: 5.78% Day Change: 2.22 | |
| Week Change: 5.37% Year-to-date Change: 38.6% | |
| CAKE Links: Profile News Message Board | |
| Charts:- Daily , Weekly | |
| Add CAKE to Watchlist: View: Get Complete CAKE Trend Analysis ➞ | |
 | GCI Gannett Co., Inc. |
| Sector: Services & Goods | |
| SubSector: Publishing - Newspapers | |
| MarketCap: 222.322 Millions | |
| Recent Price: 4.34 Smart Investing & Trading Score: 100 | |
| Day Percent Change: 2.09% Day Change: 0.1 | |
| Week Change: 5.34% Year-to-date Change: -14.2% | |
| GCI Links: Profile News Message Board | |
| Charts:- Daily , Weekly | |
| Add GCI to Watchlist: View: Get Complete GCI Trend Analysis ➞ | |
 | HD The Home Depot, Inc. |
| Sector: Services & Goods | |
| SubSector: Home Improvement Stores | |
| MarketCap: 185389 Millions | |
| Recent Price: 407.18 Smart Investing & Trading Score: 100 | |
| Day Percent Change: 2.94% Day Change: 10.71 | |
| Week Change: 5.27% Year-to-date Change: 6.0% | |
| HD Links: Profile News Message Board | |
| Charts:- Daily , Weekly | |
| Add HD to Watchlist: View: Get Complete HD Trend Analysis ➞ | |
 | LQDT Liquidity Services, Inc. |
| Sector: Services & Goods | |
| SubSector: Catalog & Mail Order Houses | |
| MarketCap: 144.492 Millions | |
| Recent Price: 26.15 Smart Investing & Trading Score: 80 | |
| Day Percent Change: 22.37% Day Change: 4.1 | |
| Week Change: 5.23% Year-to-date Change: -19.0% | |
| LQDT Links: Profile News Message Board | |
| Charts:- Daily , Weekly | |
| Add LQDT to Watchlist: View: Get Complete LQDT Trend Analysis ➞ | |
 | FAST Fastenal Company |
| Sector: Services & Goods | |
| SubSector: Industrial Equipment Wholesale | |
| MarketCap: 17609.9 Millions | |
| Recent Price: 49.21 Smart Investing & Trading Score: 100 | |
| Day Percent Change: 20.11% Day Change: 11.4 | |
| Week Change: 5.19% Year-to-date Change: 39.1% | |
| FAST Links: Profile News Message Board | |
| Charts:- Daily , Weekly | |
| Add FAST to Watchlist: View: Get Complete FAST Trend Analysis ➞ | |
 | IPG The Interpublic Group of Companies, Inc. |
| Sector: Services & Goods | |
| SubSector: Advertising Agencies | |
| MarketCap: 5730.55 Millions | |
| Recent Price: 26.20 Smart Investing & Trading Score: 90 | |
| Day Percent Change: 1.8% Day Change: 0.57 | |
| Week Change: 5.14% Year-to-date Change: -4.0% | |
| IPG Links: Profile News Message Board | |
| Charts:- Daily , Weekly | |
| Add IPG to Watchlist: View: Get Complete IPG Trend Analysis ➞ | |
 | IMAX IMAX Corporation |
| Sector: Services & Goods | |
| SubSector: Entertainment - Diversified | |
| MarketCap: 874.237 Millions | |
| Recent Price: 25.77 Smart Investing & Trading Score: 50 | |
| Day Percent Change: 0.83% Day Change: 0.18 | |
| Week Change: 5.14% Year-to-date Change: 0.7% | |
| IMAX Links: Profile News Message Board | |
| Charts:- Daily , Weekly | |
| Add IMAX to Watchlist: View: Get Complete IMAX Trend Analysis ➞ | |
 | CBZ CBIZ, Inc. |
| Sector: Services & Goods | |
| SubSector: Business Services | |
| MarketCap: 1121.32 Millions | |
| Recent Price: 65.03 Smart Investing & Trading Score: 50 | |
| Day Percent Change: 1.55% Day Change: 1.1 | |
| Week Change: 4.97% Year-to-date Change: -20.5% | |
| CBZ Links: Profile News Message Board | |
| Charts:- Daily , Weekly | |
| Add CBZ to Watchlist: View: Get Complete CBZ Trend Analysis ➞ | |
 | BABA Alibaba Group Holding Limited |
| Sector: Services & Goods | |
| SubSector: Specialty Retail, Other | |
| MarketCap: 522666 Millions | |
| Recent Price: 126.86 Smart Investing & Trading Score: 100 | |
| Day Percent Change: 3.13% Day Change: 2.59 | |
| Week Change: 4.96% Year-to-date Change: 50.8% | |
| BABA Links: Profile News Message Board | |
| Charts:- Daily , Weekly | |
| Add BABA to Watchlist: View: Get Complete BABA Trend Analysis ➞ | |
 | EVI EVI Industries, Inc. |
| Sector: Services & Goods | |
| SubSector: Consumer Services | |
| MarketCap: 207.448 Millions | |
| Recent Price: 24.45 Smart Investing & Trading Score: 90 | |
| Day Percent Change: -33.56% Day Change: -8.56 | |
| Week Change: 4.89% Year-to-date Change: 49.5% | |
| EVI Links: Profile News Message Board | |
| Charts:- Daily , Weekly | |
| Add EVI to Watchlist: View: Get Complete EVI Trend Analysis ➞ | |
 | OMC Omnicom Group Inc. |
| Sector: Services & Goods | |
| SubSector: Advertising Agencies | |
| MarketCap: 11813.5 Millions | |
| Recent Price: 76.47 Smart Investing & Trading Score: 70 | |
| Day Percent Change: 1.33% Day Change: 1.29 | |
| Week Change: 4.83% Year-to-date Change: -9.5% | |
| OMC Links: Profile News Message Board | |
| Charts:- Daily , Weekly | |
| Add OMC to Watchlist: View: Get Complete OMC Trend Analysis ➞ | |
 | CCL Carnival Corporation & Plc |
| Sector: Services & Goods | |
| SubSector: Resorts & Casinos | |
| MarketCap: 11725.4 Millions | |
| Recent Price: 30.64 Smart Investing & Trading Score: 90 | |
| Day Percent Change: 8.14% Day Change: 1.25 | |
| Week Change: 4.79% Year-to-date Change: 23.0% | |
| CCL Links: Profile News Message Board | |
| Charts:- Daily , Weekly | |
| Add CCL to Watchlist: View: Get Complete CCL Trend Analysis ➞ | |
 | MCS The Marcus Corporation |
| Sector: Services & Goods | |
| SubSector: Entertainment - Diversified | |
| MarketCap: 441.437 Millions | |
| Recent Price: 15.43 Smart Investing & Trading Score: 30 | |
| Day Percent Change: 1.81% Day Change: 0.25 | |
| Week Change: 4.75% Year-to-date Change: -27.7% | |
| MCS Links: Profile News Message Board | |
| Charts:- Daily , Weekly | |
| Add MCS to Watchlist: View: Get Complete MCS Trend Analysis ➞ | |
 | WSM Williams-Sonoma, Inc. |
| Sector: Services & Goods | |
| SubSector: Home Furnishing Stores | |
| MarketCap: 3370.05 Millions | |
| Recent Price: 210.20 Smart Investing & Trading Score: 100 | |
| Day Percent Change: 6.79% Day Change: 8.88 | |
| Week Change: 4.71% Year-to-date Change: 14.8% | |
| WSM Links: Profile News Message Board | |
| Charts:- Daily , Weekly | |
| Add WSM to Watchlist: View: Get Complete WSM Trend Analysis ➞ | |
 | HLT Hilton Worldwide Holdings Inc. |
| Sector: Services & Goods | |
| SubSector: Lodging | |
| MarketCap: 18064.6 Millions | |
| Recent Price: 272.85 Smart Investing & Trading Score: 80 | |
| Day Percent Change: 0.71% Day Change: 1.53 | |
| Week Change: 4.56% Year-to-date Change: 10.5% | |
| HLT Links: Profile News Message Board | |
| Charts:- Daily , Weekly | |
| Add HLT to Watchlist: View: Get Complete HLT Trend Analysis ➞ | |
 | PENN Penn National Gaming, Inc. |
| Sector: Services & Goods | |
| SubSector: Resorts & Casinos | |
| MarketCap: 1183.84 Millions | |
| Recent Price: 17.80 Smart Investing & Trading Score: 70 | |
| Day Percent Change: 1.06% Day Change: 0.21 | |
| Week Change: 4.55% Year-to-date Change: -10.2% | |
| PENN Links: Profile News Message Board | |
| Charts:- Daily , Weekly | |
| Add PENN to Watchlist: View: Get Complete PENN Trend Analysis ➞ | |
 | ABM ABM Industries Incorporated |
| Sector: Services & Goods | |
| SubSector: Business Services | |
| MarketCap: 1706.72 Millions | |
| Recent Price: 49.53 Smart Investing & Trading Score: 70 | |
| Day Percent Change: 1.75% Day Change: 0.95 | |
| Week Change: 4.52% Year-to-date Change: -1.7% | |
| ABM Links: Profile News Message Board | |
| Charts:- Daily , Weekly | |
| Add ABM to Watchlist: View: Get Complete ABM Trend Analysis ➞ | |
 | TAL TAL Education Group |
| Sector: Services & Goods | |
| SubSector: Education & Training Services | |
| MarketCap: 30103.1 Millions | |
| Recent Price: 11.68 Smart Investing & Trading Score: 100 | |
| Day Percent Change: 0.35% Day Change: 0.03 | |
| Week Change: 4.47% Year-to-date Change: 16.6% | |
| TAL Links: Profile News Message Board | |
| Charts:- Daily , Weekly | |
| Add TAL to Watchlist: View: Get Complete TAL Trend Analysis ➞ | |
 | WCC WESCO International, Inc. |
| Sector: Services & Goods | |
| SubSector: Industrial Equipment Wholesale | |
| MarketCap: 824.358 Millions | |
| Recent Price: 215.42 Smart Investing & Trading Score: 90 | |
| Day Percent Change: 3.1% Day Change: 4.96 | |
| Week Change: 4.44% Year-to-date Change: 19.7% | |
| WCC Links: Profile News Message Board | |
| Charts:- Daily , Weekly | |
| Add WCC to Watchlist: View: Get Complete WCC Trend Analysis ➞ | |
 | CUK Carnival Corporation & Plc |
| Sector: Services & Goods | |
| SubSector: General Entertainment | |
| MarketCap: 10703.9 Millions | |
| Recent Price: 27.97 Smart Investing & Trading Score: 90 | |
| Day Percent Change: 7.93% Day Change: 1.11 | |
| Week Change: 4.44% Year-to-date Change: 24.3% | |
| CUK Links: Profile News Message Board | |
| Charts:- Daily , Weekly | |
| Add CUK to Watchlist: View: Get Complete CUK Trend Analysis ➞ | |
 | PLAY Dave & Buster s Entertainment, Inc. |
| Sector: Services & Goods | |
| SubSector: Restaurants | |
| MarketCap: 283.07 Millions | |
| Recent Price: 26.27 Smart Investing & Trading Score: 60 | |
| Day Percent Change: 0.12% Day Change: 0.04 | |
| Week Change: 4.41% Year-to-date Change: -10.0% | |
| PLAY Links: Profile News Message Board | |
| Charts:- Daily , Weekly | |
| Add PLAY to Watchlist: View: Get Complete PLAY Trend Analysis ➞ | |
 | IHG InterContinental Hotels Group PLC |
| Sector: Services & Goods | |
| SubSector: Lodging | |
| MarketCap: 6387.46 Millions | |
| Recent Price: 121.61 Smart Investing & Trading Score: 70 | |
| Day Percent Change: 1.61% Day Change: 1.58 | |
| Week Change: 4.41% Year-to-date Change: -1.6% | |
| IHG Links: Profile News Message Board | |
| Charts:- Daily , Weekly | |
| Add IHG to Watchlist: View: Get Complete IHG Trend Analysis ➞ | |
 | SBGI Sinclair Broadcast Group, Inc. |
| Sector: Services & Goods | |
| SubSector: Broadcasting - TV | |
| MarketCap: 1461.73 Millions | |
| Recent Price: 14.75 Smart Investing & Trading Score: 60 | |
| Day Percent Change: 1.3% Day Change: 0.18 | |
| Week Change: 4.39% Year-to-date Change: -5.4% | |
| SBGI Links: Profile News Message Board | |
| Charts:- Daily , Weekly | |
| Add SBGI to Watchlist: View: Get Complete SBGI Trend Analysis ➞ | |
 | LOCO El Pollo Loco Holdings, Inc. |
| Sector: Services & Goods | |
| SubSector: Restaurants | |
| MarketCap: 296.97 Millions | |
| Recent Price: 10.69 Smart Investing & Trading Score: 70 | |
| Day Percent Change: 26.7% Day Change: 2.87 | |
| Week Change: 4.39% Year-to-date Change: -7.4% | |
| LOCO Links: Profile News Message Board | |
| Charts:- Daily , Weekly | |
| Add LOCO to Watchlist: View: Get Complete LOCO Trend Analysis ➞ | |
| For tabular summary view of above stock list: Summary View ➞ 0 - 25 , 25 - 50 , 50 - 75 , 75 - 100 , 100 - 125 , 125 - 150 , 150 - 175 , 175 - 200 , 200 - 225 , 225 - 250 , 250 - 275 , 275 - 300 | ||
| Click To Change The Sort Order: By Market Cap or Company Size Performance: Year-to-date, Week and Day | |
| Select Chart Type: | ||
|
Best Stocks Today 12Stocks.com |
© 2025 12Stocks.com Terms & Conditions Privacy Contact Us
All Information Provided Only For Education And Not To Be Used For Investing or Trading. See Terms & Conditions


One More Thing ... Get Best Stocks Delivered Daily!
Never Ever Miss A Move With Our Top Ten Stocks Lists
Find Best Stocks In Any Market - Bull or Bear Market
Take A Peek At Our Top Ten Stocks Lists: Daily, Weekly, Year-to-Date & Top Trends
Find Best Stocks In Any Market - Bull or Bear Market
Take A Peek At Our Top Ten Stocks Lists: Daily, Weekly, Year-to-Date & Top Trends
Consumer Services Stocks With Best Up Trends [0-bearish to 100-bullish]: Daily Journal[100], Napco Security[100], Louisiana-Pacific [100], Ritchie Bros.[100], eBay [100], Graham [100], Fastenal [100], AECOM [100], Kelly Services[100], Wayfair [100], Gray Television[100]
Best Consumer Services Stocks Year-to-Date:
Willdan [210.66%], Kratos Defense[160.61%], Altisource Portfolio[97.94%], Gray Television[94.26%], Wayfair [77.55%], Noodles & [76.23%], VSE [73.56%], Sears [67.56%], eBay [64.06%], WNS ()[58.64%], Dollar General[55.7%] Best Consumer Services Stocks This Week:
Willdan [34.44%], Gray Television[33.03%], Park-Ohio [27.27%], TEGNA [27.26%], Etsy [24.72%], AMC Networks[22.47%], Deluxe [21.77%], Kohl s[19.15%], Petco Health[19%], Kelly Services[18.78%], CompX [18.12%] Best Consumer Services Stocks Daily:
CareDx [185.69%], Wingstop [150.46%], National CineMedia[112.46%], VSE [69.41%], Burlington Stores[66.03%], Myriad Genetics[64.88%], Costco Wholesale[58.1%], Daily Journal[57.5%], Texas Roadhouse[55.27%], Royal Caribbean[53.63%], CRA [53.26%]