
 Login Sign Up


| |||||
 |  | ||||

| 12Stocks.com Market Intelligence |
Best SmallCap Stocks
|
| In a hurry? Small Cap Stock Lists: Performance Trends Table, Stock Charts
Sort Small Cap stocks: Daily, Weekly, Year-to-Date, Market Cap & Trends. Filter Small Cap stocks list by sector: Show all, Tech, Finance, Energy, Staples, Retail, Industrial, Materials, Utilities and HealthCare Filter Small Cap stocks list by size: All Large Medium Small and MicroCap |
| 12Stocks.com Small Cap Stocks Performances & Trends Daily | |||||||||
|
|  The overall Smart Investing & Trading Score is 69 (0-bearish to 100-bullish) which puts Small Cap index in short term neutral to bullish trend. The Smart Investing & Trading Score from previous trading session is 49 and hence an improvement of trend.
| ||||||||
Here are the Smart Investing & Trading Scores of the most requested small cap stocks at 12Stocks.com (click stock name for detailed review):
|


| 12Stocks.com: Investing in Smallcap Index with Stocks | |
|
The following table helps investors and traders sort through current performance and trends (as measured by Smart Investing & Trading Score) of various
stocks in the Smallcap Index. Quick View: Move mouse or cursor over stock symbol (ticker) to view short-term technical chart and over stock name to view long term chart. Click on  to add stock symbol to your watchlist and to add stock symbol to your watchlist and  to view watchlist. Click on any ticker or stock name for detailed market intelligence report for that stock. to view watchlist. Click on any ticker or stock name for detailed market intelligence report for that stock. |
12Stocks.com Performance of Stocks in Smallcap Index
| Ticker | Stock Name | Watchlist | Category | Recent Price | Smart Investing & Trading Score | Change % | YTD Change% |
| HSTM | HealthStream |   | Technology | 27.03 | 69 | 0.07% | 0.00% |
| CASH | Meta Financial | | Financials | 52.93 | 93 | 1.52% | 0.00% |
| ERAS | Erasca | | Health Care | 2.13 | 59 | 2.90% | 0.00% |
| ASGN | ASGN | | Services & Goods | 96.15 | 22 | 0.09% | -0.02% |
| VPG | Vishay Precision | | Technology | 34.06 | 69 | 0.77% | -0.03% |
| ABM | ABM Industries | | Services & Goods | 44.77 | 88 | -0.16% | -0.13% |
| TCMD | Tactile Systems | | Health Care | 14.28 | 32 | -1.14% | -0.17% |
| MCRI | Monarch Casino | | Services & Goods | 69.01 | 42 | 1.26% | -0.20% |
| OFG | OFG Bancorp | | Financials | 37.34 | 90 | 0.89% | -0.37% |
| NBN | Northeast Bank | | Financials | 54.98 | 90 | 0.16% | -0.38% |
| AKR | Acadia Realty | | Financials | 16.92 | 26 | -2.20% | -0.41% |
| HBI | Hanesbrands | | Consumer Staples | 4.44 | 5 | -4.93% | -0.45% |
| VAL | Valaris | | Energy | 68.25 | 58 | 4.92% | -0.47% |
| MYRG | MYR Group | | Industrials | 143.92 | 0 | -5.31% | -0.49% |
| EEX | Emerald Holding | | Services & Goods | 5.95 | 58 | 0.51% | -0.50% |
| SONO | Sonos | | Technology | 17.05 | 37 | 0.65% | -0.53% |
| CTBI | Community Trust | | Financials | 43.62 | 100 | 1.00% | -0.55% |
| XPOF | Xponential Fitness | | Services & Goods | 12.97 | 75 | -2.08% | -0.58% |
| BRT | BRT Apartments | | Financials | 18.48 | 95 | -0.22% | -0.59% |
| MDGL | Madrigal | | Health Care | 229.84 | 49 | 6.38% | -0.67% |
| FLR | Fluor | | Industrials | 38.90 | 26 | -5.67% | -0.69% |
| CNSL | Consolidated | | Technology | 4.32 | 37 | -0.23% | -0.69% |
| NWN | Northwest Natural | | Utilities | 38.63 | 90 | -0.41% | -0.80% |
| GABC | German American | | Financials | 32.15 | 76 | 0.59% | -0.80% |
| VRCA | Verrica | | Health Care | 7.26 | 100 | 7.40% | -0.82% |


| Too many stocks? View smallcap stocks filtered by marketcap & sector |
| Marketcap: All SmallCap Stocks (default-no microcap), Large, Mid-Range, Small |
| Smallcap Sector: Tech, Finance, Energy, Staples, Retail, Industrial, Materials, & Medical |
|
Get the most comprehensive stock market coverage daily at 12Stocks.com ➞ Best Stocks Today ➞ Best Stocks Weekly ➞ Best Stocks Year-to-Date ➞ Best Stocks Trends ➞  Best Stocks Today 12Stocks.com Best Nasdaq Stocks ➞ Best S&P 500 Stocks ➞ Best Tech Stocks ➞ Best Biotech Stocks ➞ |
| Detailed Overview of SmallCap Stocks |
| SmallCap Technical Overview, Leaders & Laggards, Top SmallCap ETF Funds & Detailed SmallCap Stocks List, Charts, Trends & More |
| Smallcap: Technical Analysis, Trends & YTD Performance | |
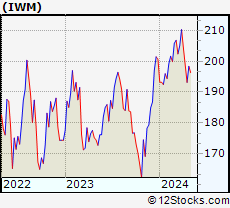
| SmallCap segment as represented by
IWM, an exchange-traded fund [ETF], holds basket of thousands of smallcap stocks from across all major sectors of the US stock market. The smallcap index (contains stocks like Riverbed & Sotheby's) is up by 0.59% and is currently underperforming the overall market by -6.29% year-to-date. Below is a quick view of technical charts and trends: | |
 IWM Weekly Chart |
|
| Long Term Trend: Not Good | |
| Medium Term Trend: Very Good | |
 IWM Daily Chart |
|
| Short Term Trend: Very Good | |
| Overall Trend Score: 69 | |
| YTD Performance: 0.59% | |
| **Trend Scores & Views Are Only For Educational Purposes And Not For Investing | |
| 12Stocks.com: Top Performing Small Cap Index Stocks | ||||||||||||||||||||||||||||||||||||||||||||||||
 The top performing Small Cap Index stocks year to date are
Now, more recently, over last week, the top performing Small Cap Index stocks on the move are


|
||||||||||||||||||||||||||||||||||||||||||||||||
| 12Stocks.com: Investing in Smallcap Index using Exchange Traded Funds | |
|
The following table shows list of key exchange traded funds (ETF) that
help investors track Smallcap index. The following list also includes leveraged ETF funds that track twice or thrice the daily returns of Smallcap indices. Short or inverse ETF funds move in the opposite direction to the index they track and are useful during market pullbacks or during bear markets. Quick View: Move mouse or cursor over ETF symbol (ticker) to view short-term technical chart and over ETF name to view long term chart. Click on ticker or stock name for detailed view. Click on to add stock symbol to your watchlist and to view watchlist. |
12Stocks.com List of ETFs that track Smallcap Index
| Ticker | ETF Name | Watchlist | Recent Price | Smart Investing & Trading Score | Change % | Week % | Year-to-date % |
| IWM | iShares Russell 2000 | | 201.90 | 69 | 0.99 | 1.77 | 0.59% |
| IJR | iShares Core S&P Small-Cap | | 107.13 | 82 | 0.75 | 1.4 | -1.03% |
| VTWO | Vanguard Russell 2000 ETF | | 81.61 | 69 | 0.94 | 1.73 | 0.63% |
| IWN | iShares Russell 2000 Value | | 154.21 | 100 | 0.87 | 2.03 | -0.72% |
| IJS | iShares S&P Small-Cap 600 Value | | 98.72 | 64 | 0.71 | 1.57 | -4.22% |
| IWO | iShares Russell 2000 Growth | | 256.87 | 57 | 0.99 | 1.49 | 1.84% |
| IJT | iShares S&P Small-Cap 600 Growth | | 127.76 | 95 | 0.82 | 1.32 | 2.09% |
| XSLV | PowerShares S&P SmallCap Low Volatil ETF | | 43.22 | 87 | 0.19 | 1.17 | -2.11% |
| SBB | ProShares Short SmallCap600 | | 16.16 | 13 | -1.28 | -1.37 | 1.44% |
| SDD | ProShares UltraShort SmallCap600 | | 18.84 | 23 | -2.41 | -2.61 | 2.27% |
| SAA | ProShares Ultra SmallCap600 | | 23.59 | 69 | 2.86 | 2.39 | -5.45% |
| SMLV | SPDR SSGA US Small Cap Low Volatil ETF | | 109.69 | 87 | 0.78 | 2.01 | -2.52% |
| 12Stocks.com: Charts, Trends, Fundamental Data and Performances of SmallCap Stocks | |
|
We now take in-depth look at all SmallCap stocks including charts, multi-period performances and overall trends (as measured by Smart Investing & Trading Score). One can sort SmallCap stocks (click link to choose) by Daily, Weekly and by Year-to-Date performances. Also, one can sort by size of the company or by market capitalization. |
| Select Your Default Chart Type: | |||||
| |||||
| Click on stock symbol or name for detailed view. Click on to add stock symbol to your watchlist and to view watchlist. Quick View: Move mouse or cursor over "Daily" to quickly view daily technical stock chart and over "Weekly" to view weekly technical stock chart. | |||||

 | HSTM HealthStream, Inc. |
| Sector: Technology | |
| SubSector: Healthcare Information Services | |
| MarketCap: 770.255 Millions | |
| Recent Price: 27.03 Smart Investing & Trading Score: 69 | |
| Day Percent Change: 0.07% Day Change: 0.02 | |
| Week Change: 5.54% Year-to-date Change: 0.0% | |
| HSTM Links: Profile News Message Board | |
| Charts:- Daily , Weekly | |
| Add HSTM to Watchlist: View: Get Complete HSTM Trend Analysis ➞ | |
 | CASH Meta Financial Group, Inc. |
| Sector: Financials | |
| SubSector: Savings & Loans | |
| MarketCap: 849.33 Millions | |
| Recent Price: 52.93 Smart Investing & Trading Score: 93 | |
| Day Percent Change: 1.52% Day Change: 0.79 | |
| Week Change: 1.52% Year-to-date Change: 0.0% | |
| CASH Links: Profile News Message Board | |
| Charts:- Daily , Weekly | |
| Add CASH to Watchlist: View: Get Complete CASH Trend Analysis ➞ | |
 | ERAS Erasca, Inc. |
| Sector: Health Care | |
| SubSector: Biotechnology | |
| MarketCap: 419 Millions | |
| Recent Price: 2.13 Smart Investing & Trading Score: 59 | |
| Day Percent Change: 2.90% Day Change: 0.06 | |
| Week Change: 12.7% Year-to-date Change: 0.0% | |
| ERAS Links: Profile News Message Board | |
| Charts:- Daily , Weekly | |
| Add ERAS to Watchlist: View: Get Complete ERAS Trend Analysis ➞ | |
 | ASGN ASGN Incorporated |
| Sector: Services & Goods | |
| SubSector: Staffing & Outsourcing Services | |
| MarketCap: 2035.88 Millions | |
| Recent Price: 96.15 Smart Investing & Trading Score: 22 | |
| Day Percent Change: 0.09% Day Change: 0.09 | |
| Week Change: -1.39% Year-to-date Change: 0.0% | |
| ASGN Links: Profile News Message Board | |
| Charts:- Daily , Weekly | |
| Add ASGN to Watchlist: View: Get Complete ASGN Trend Analysis ➞ | |
 | VPG Vishay Precision Group, Inc. |
| Sector: Technology | |
| SubSector: Scientific & Technical Instruments | |
| MarketCap: 261.553 Millions | |
| Recent Price: 34.06 Smart Investing & Trading Score: 69 | |
| Day Percent Change: 0.77% Day Change: 0.26 | |
| Week Change: 1.95% Year-to-date Change: 0.0% | |
| VPG Links: Profile News Message Board | |
| Charts:- Daily , Weekly | |
| Add VPG to Watchlist: View: Get Complete VPG Trend Analysis ➞ | |
 | ABM ABM Industries Incorporated |
| Sector: Services & Goods | |
| SubSector: Business Services | |
| MarketCap: 1706.72 Millions | |
| Recent Price: 44.77 Smart Investing & Trading Score: 88 | |
| Day Percent Change: -0.16% Day Change: -0.07 | |
| Week Change: 1.66% Year-to-date Change: -0.1% | |
| ABM Links: Profile News Message Board | |
| Charts:- Daily , Weekly | |
| Add ABM to Watchlist: View: Get Complete ABM Trend Analysis ➞ | |
 | TCMD Tactile Systems Technology, Inc. |
| Sector: Health Care | |
| SubSector: Medical Instruments & Supplies | |
| MarketCap: 655.96 Millions | |
| Recent Price: 14.28 Smart Investing & Trading Score: 32 | |
| Day Percent Change: -1.14% Day Change: -0.16 | |
| Week Change: -0.17% Year-to-date Change: -0.2% | |
| TCMD Links: Profile News Message Board | |
| Charts:- Daily , Weekly | |
| Add TCMD to Watchlist: View: Get Complete TCMD Trend Analysis ➞ | |
 | MCRI Monarch Casino & Resort, Inc. |
| Sector: Services & Goods | |
| SubSector: Resorts & Casinos | |
| MarketCap: 352.894 Millions | |
| Recent Price: 69.01 Smart Investing & Trading Score: 42 | |
| Day Percent Change: 1.26% Day Change: 0.86 | |
| Week Change: 1.38% Year-to-date Change: -0.2% | |
| MCRI Links: Profile News Message Board | |
| Charts:- Daily , Weekly | |
| Add MCRI to Watchlist: View: Get Complete MCRI Trend Analysis ➞ | |
 | OFG OFG Bancorp |
| Sector: Financials | |
| SubSector: Money Center Banks | |
| MarketCap: 537.599 Millions | |
| Recent Price: 37.34 Smart Investing & Trading Score: 90 | |
| Day Percent Change: 0.89% Day Change: 0.33 | |
| Week Change: 2.87% Year-to-date Change: -0.4% | |
| OFG Links: Profile News Message Board | |
| Charts:- Daily , Weekly | |
| Add OFG to Watchlist: View: Get Complete OFG Trend Analysis ➞ | |
 | NBN Northeast Bank |
| Sector: Financials | |
| SubSector: Regional - Northeast Banks | |
| MarketCap: 114.199 Millions | |
| Recent Price: 54.98 Smart Investing & Trading Score: 90 | |
| Day Percent Change: 0.16% Day Change: 0.09 | |
| Week Change: 4.7% Year-to-date Change: -0.4% | |
| NBN Links: Profile News Message Board | |
| Charts:- Daily , Weekly | |
| Add NBN to Watchlist: View: Get Complete NBN Trend Analysis ➞ | |
 | AKR Acadia Realty Trust |
| Sector: Financials | |
| SubSector: Property Management | |
| MarketCap: 1367.42 Millions | |
| Recent Price: 16.92 Smart Investing & Trading Score: 26 | |
| Day Percent Change: -2.20% Day Change: -0.38 | |
| Week Change: -2.31% Year-to-date Change: -0.4% | |
| AKR Links: Profile News Message Board | |
| Charts:- Daily , Weekly | |
| Add AKR to Watchlist: View: Get Complete AKR Trend Analysis ➞ | |
 | HBI Hanesbrands Inc. |
| Sector: Consumer Staples | |
| SubSector: Textile - Apparel Clothing | |
| MarketCap: 3559.75 Millions | |
| Recent Price: 4.44 Smart Investing & Trading Score: 5 | |
| Day Percent Change: -4.93% Day Change: -0.23 | |
| Week Change: -0.89% Year-to-date Change: -0.5% | |
| HBI Links: Profile News Message Board | |
| Charts:- Daily , Weekly | |
| Add HBI to Watchlist: View: Get Complete HBI Trend Analysis ➞ | |
 | VAL Valaris Limited |
| Sector: Energy | |
| SubSector: Oil & Gas Equipment & Services | |
| MarketCap: 4520 Millions | |
| Recent Price: 68.25 Smart Investing & Trading Score: 58 | |
| Day Percent Change: 4.92% Day Change: 3.20 | |
| Week Change: -1.37% Year-to-date Change: -0.5% | |
| VAL Links: Profile News Message Board | |
| Charts:- Daily , Weekly | |
| Add VAL to Watchlist: View: Get Complete VAL Trend Analysis ➞ | |
 | MYRG MYR Group Inc. |
| Sector: Industrials | |
| SubSector: General Contractors | |
| MarketCap: 405.363 Millions | |
| Recent Price: 143.92 Smart Investing & Trading Score: 0 | |
| Day Percent Change: -5.31% Day Change: -8.07 | |
| Week Change: -14.41% Year-to-date Change: -0.5% | |
| MYRG Links: Profile News Message Board | |
| Charts:- Daily , Weekly | |
| Add MYRG to Watchlist: View: Get Complete MYRG Trend Analysis ➞ | |
 | EEX Emerald Holding, Inc. |
| Sector: Services & Goods | |
| SubSector: Business Services | |
| MarketCap: 252.682 Millions | |
| Recent Price: 5.95 Smart Investing & Trading Score: 58 | |
| Day Percent Change: 0.51% Day Change: 0.03 | |
| Week Change: 1.54% Year-to-date Change: -0.5% | |
| EEX Links: Profile News Message Board | |
| Charts:- Daily , Weekly | |
| Add EEX to Watchlist: View: Get Complete EEX Trend Analysis ➞ | |
 | SONO Sonos, Inc. |
| Sector: Technology | |
| SubSector: Diversified Electronics | |
| MarketCap: 1047.96 Millions | |
| Recent Price: 17.05 Smart Investing & Trading Score: 37 | |
| Day Percent Change: 0.65% Day Change: 0.11 | |
| Week Change: 0.47% Year-to-date Change: -0.5% | |
| SONO Links: Profile News Message Board | |
| Charts:- Daily , Weekly | |
| Add SONO to Watchlist: View: Get Complete SONO Trend Analysis ➞ | |
 | CTBI Community Trust Bancorp, Inc. |
| Sector: Financials | |
| SubSector: Regional - Southeast Banks | |
| MarketCap: 608.435 Millions | |
| Recent Price: 43.62 Smart Investing & Trading Score: 100 | |
| Day Percent Change: 1.00% Day Change: 0.43 | |
| Week Change: 2.3% Year-to-date Change: -0.6% | |
| CTBI Links: Profile News Message Board | |
| Charts:- Daily , Weekly | |
| Add CTBI to Watchlist: View: Get Complete CTBI Trend Analysis ➞ | |
 | XPOF Xponential Fitness, Inc. |
| Sector: Services & Goods | |
| SubSector: Leisure | |
| MarketCap: 811 Millions | |
| Recent Price: 12.97 Smart Investing & Trading Score: 75 | |
| Day Percent Change: -2.08% Day Change: -0.28 | |
| Week Change: 1.21% Year-to-date Change: -0.6% | |
| XPOF Links: Profile News Message Board | |
| Charts:- Daily , Weekly | |
| Add XPOF to Watchlist: View: Get Complete XPOF Trend Analysis ➞ | |
 | BRT BRT Apartments Corp. |
| Sector: Financials | |
| SubSector: Mortgage Investment | |
| MarketCap: 163.239 Millions | |
| Recent Price: 18.48 Smart Investing & Trading Score: 95 | |
| Day Percent Change: -0.22% Day Change: -0.04 | |
| Week Change: 5.42% Year-to-date Change: -0.6% | |
| BRT Links: Profile News Message Board | |
| Charts:- Daily , Weekly | |
| Add BRT to Watchlist: View: Get Complete BRT Trend Analysis ➞ | |
 | MDGL Madrigal Pharmaceuticals, Inc. |
| Sector: Health Care | |
| SubSector: Biotechnology | |
| MarketCap: 1104.35 Millions | |
| Recent Price: 229.84 Smart Investing & Trading Score: 49 | |
| Day Percent Change: 6.38% Day Change: 13.79 | |
| Week Change: 18.88% Year-to-date Change: -0.7% | |
| MDGL Links: Profile News Message Board | |
| Charts:- Daily , Weekly | |
| Add MDGL to Watchlist: View: Get Complete MDGL Trend Analysis ➞ | |
 | FLR Fluor Corporation |
| Sector: Industrials | |
| SubSector: Heavy Construction | |
| MarketCap: 891.495 Millions | |
| Recent Price: 38.90 Smart Investing & Trading Score: 26 | |
| Day Percent Change: -5.67% Day Change: -2.34 | |
| Week Change: -5.01% Year-to-date Change: -0.7% | |
| FLR Links: Profile News Message Board | |
| Charts:- Daily , Weekly | |
| Add FLR to Watchlist: View: Get Complete FLR Trend Analysis ➞ | |
 | CNSL Consolidated Communications Holdings, Inc. |
| Sector: Technology | |
| SubSector: Telecom Services - Domestic | |
| MarketCap: 319.677 Millions | |
| Recent Price: 4.32 Smart Investing & Trading Score: 37 | |
| Day Percent Change: -0.23% Day Change: -0.01 | |
| Week Change: 1.17% Year-to-date Change: -0.7% | |
| CNSL Links: Profile News Message Board | |
| Charts:- Daily , Weekly | |
| Add CNSL to Watchlist: View: Get Complete CNSL Trend Analysis ➞ | |
 | NWN Northwest Natural Holding Company |
| Sector: Utilities | |
| SubSector: Gas Utilities | |
| MarketCap: 2058.17 Millions | |
| Recent Price: 38.63 Smart Investing & Trading Score: 90 | |
| Day Percent Change: -0.41% Day Change: -0.16 | |
| Week Change: 0.81% Year-to-date Change: -0.8% | |
| NWN Links: Profile News Message Board | |
| Charts:- Daily , Weekly | |
| Add NWN to Watchlist: View: Get Complete NWN Trend Analysis ➞ | |
 | GABC German American Bancorp, Inc. |
| Sector: Financials | |
| SubSector: Regional - Midwest Banks | |
| MarketCap: 731.47 Millions | |
| Recent Price: 32.15 Smart Investing & Trading Score: 76 | |
| Day Percent Change: 0.59% Day Change: 0.19 | |
| Week Change: -0.31% Year-to-date Change: -0.8% | |
| GABC Links: Profile News Message Board | |
| Charts:- Daily , Weekly | |
| Add GABC to Watchlist: View: Get Complete GABC Trend Analysis ➞ | |
 | VRCA Verrica Pharmaceuticals Inc. |
| Sector: Health Care | |
| SubSector: Biotechnology | |
| MarketCap: 289.585 Millions | |
| Recent Price: 7.26 Smart Investing & Trading Score: 100 | |
| Day Percent Change: 7.40% Day Change: 0.50 | |
| Week Change: 5.68% Year-to-date Change: -0.8% | |
| VRCA Links: Profile News Message Board | |
| Charts:- Daily , Weekly | |
| Add VRCA to Watchlist: View: Get Complete VRCA Trend Analysis ➞ | |
| Too many stocks? View smallcap stocks filtered by marketcap & sector |
| Marketcap: All SmallCap Stocks (default-no microcap), Large, Mid-Range, Small & MicroCap |
| Sector: Tech, Finance, Energy, Staples, Retail, Industrial, Materials, Utilities & Medical |
|
Best Stocks Today 12Stocks.com |
© 2024 12Stocks.com Terms & Conditions Privacy Contact Us
All Information Provided Only For Education And Not To Be Used For Investing or Trading. See Terms & Conditions


One More Thing ... Get Best Stocks Delivered Daily!
Never Ever Miss A Move With Our Top Ten Stocks Lists
Find Best Stocks In Any Market - Bull or Bear Market
Take A Peek At Our Top Ten Stocks Lists: Daily, Weekly, Year-to-Date & Top Trends
Find Best Stocks In Any Market - Bull or Bear Market
Take A Peek At Our Top Ten Stocks Lists: Daily, Weekly, Year-to-Date & Top Trends
Smallcap Stocks With Best Up Trends [0-bearish to 100-bullish]: Twist Bioscience[100], WideOpenWest [100], Joint [100], FTC Solar[100], Origin Materials[100], Alignment Healthcare[100], Clarus [100], IES [100], Emergent BioSolutions[100], Enovix [100], El Pollo[100]
Best Smallcap Stocks Year-to-Date:
Janux [482.74%], Viking [313.59%], Longboard [272.5%], Alpine Immune[239.29%], Bakkt [199.55%], Avidity Biosciences[192.48%], Vera [189.47%], Cullinan Oncology[176.9%], Super Micro[175.35%], Y-mAbs [151.47%], Sana [149.33%] Best Smallcap Stocks This Week:
Emergent BioSolutions[102.6%], Deciphera [73.24%], Origin Materials[66.52%], Eyenovia [60.78%], Cue Biopharma[56.04%], Aspen Aerogels[55.96%], Enovix [54.02%], Luna Innovations[53.77%], Codexis [47.37%], Carvana Co[44.31%], Office Properties[42.79%] Best Smallcap Stocks Daily:
Luna Innovations[36.00%], Twist Bioscience[28.74%], Ardelyx [28.42%], WideOpenWest [28.23%], 2U [26.63%], Joint [25.35%], FTC Solar[25.09%], Origin Materials[22.23%], Alignment Healthcare[21.97%], Clarus [18.67%], Aurora Innovation[18.09%]