
 Login Sign Up


| |||||
 |  | ||||

| 12Stocks.com Market Intelligence |
Best SmallCap Stocks
|
| In a hurry? Small Cap Stock Lists: Performance Trends Table, Stock Charts
Sort Small Cap stocks: Daily, Weekly, Year-to-Date, Market Cap & Trends. Filter Small Cap stocks list by sector: Show all, Tech, Finance, Energy, Staples, Retail, Industrial, Materials, Utilities and HealthCare Filter Small Cap stocks list by size: All Large Medium Small and MicroCap |
| 12Stocks.com Small Cap Stocks Performances & Trends Daily | |||||||||
|
|  The overall Smart Investing & Trading Score is 41 (0-bearish to 100-bullish) which puts Small Cap index in short term neutral trend. The Smart Investing & Trading Score from previous trading session is 88 and hence a deterioration of trend.
| ||||||||
Here are the Smart Investing & Trading Scores of the most requested small cap stocks at 12Stocks.com (click stock name for detailed review):
|


| 12Stocks.com: Investing in Smallcap Index with Stocks | |
|
The following table helps investors and traders sort through current performance and trends (as measured by Smart Investing & Trading Score) of various
stocks in the Smallcap Index. Quick View: Move mouse or cursor over stock symbol (ticker) to view short-term technical chart and over stock name to view long term chart. Click on  to add stock symbol to your watchlist and to add stock symbol to your watchlist and  to view watchlist. Click on any ticker or stock name for detailed market intelligence report for that stock. to view watchlist. Click on any ticker or stock name for detailed market intelligence report for that stock. |
12Stocks.com Performance of Stocks in Smallcap Index
| Ticker | Stock Name | Watchlist | Category | Recent Price | Smart Investing & Trading Score | Change % | YTD Change% |
| TWST | Twist Bioscience |   | Health Care | 31.23 | 57 | -2.50% | -15.27% |
| PARR | Par Pacific | | Energy | 30.80 | 10 | -5.03% | -15.31% |
| CHMG | Chemung Financial | | Financials | 42.16 | 32 | -1.23% | -15.33% |
| THFF | First Financial | | Financials | 36.41 | 35 | -0.63% | -15.38% |
| KLIC | Kulicke and | | Technology | 46.28 | 52 | -1.87% | -15.42% |
| ZUMZ | Zumiez | | Services & Goods | 17.20 | 49 | 1.53% | -15.44% |
| HONE | HarborOne Bancorp | | Financials | 10.13 | 60 | -2.22% | -15.44% |
| COMP | Compass | | Technology | 3.15 | 0 | -3.67% | -15.44% |
| BNL | Broadstone Net | | Financials | 14.56 | 52 | -0.68% | -15.45% |
| IPI | Intrepid Potash | | Materials | 20.20 | 85 | -0.39% | -15.45% |
| ABR | Arbor Realty | | Financials | 12.83 | 52 | -1.46% | -15.48% |
| WGO | Winnebago Industries | | Consumer Staples | 61.58 | 10 | -2.67% | -15.50% |
| KOS | Kosmos Energy | | Energy | 5.67 | 0 | -4.06% | -15.50% |
| MOV | Movado Group | | Consumer Staples | 25.47 | 53 | -2.26% | -15.52% |
| PRO | PROS | | Technology | 32.75 | 33 | -4.52% | -15.57% |
| ARTNA | Artesian Resources | | Utilities | 34.98 | 60 | -0.34% | -15.61% |
| TNET | TriNet Group | | Services & Goods | 100.37 | 0 | -2.85% | -15.61% |
| MHO | M/I Homes | | Industrials | 116.22 | 42 | -4.12% | -15.62% |
| CCOI | Cogent | | Technology | 64.18 | 52 | -2.74% | -15.62% |
| LASR | nLIGHT | | Technology | 11.39 | 35 | -1.21% | -15.63% |
| ASIX | AdvanSix | | Materials | 25.26 | 46 | -3.77% | -15.69% |
| YOU | Clear Secure | | Technology | 17.47 | 32 | -0.74% | -15.69% |
| BOOM | DMC Global | | Industrials | 15.85 | 18 | -4.29% | -15.78% |
| ORA | Ormat | | Utilities | 63.83 | 58 | -1.01% | -15.78% |
| AURA | Aura Biosciences | | Health Care | 7.45 | 59 | -0.67% | -15.82% |


| Too many stocks? View smallcap stocks filtered by marketcap & sector |
| Marketcap: All SmallCap Stocks (default-no microcap), Large, Mid-Range, Small |
| Smallcap Sector: Tech, Finance, Energy, Staples, Retail, Industrial, Materials, & Medical |
|
Get the most comprehensive stock market coverage daily at 12Stocks.com ➞ Best Stocks Today ➞ Best Stocks Weekly ➞ Best Stocks Year-to-Date ➞ Best Stocks Trends ➞  Best Stocks Today 12Stocks.com Best Nasdaq Stocks ➞ Best S&P 500 Stocks ➞ Best Tech Stocks ➞ Best Biotech Stocks ➞ |
| Detailed Overview of SmallCap Stocks |
| SmallCap Technical Overview, Leaders & Laggards, Top SmallCap ETF Funds & Detailed SmallCap Stocks List, Charts, Trends & More |
| Smallcap: Technical Analysis, Trends & YTD Performance | |
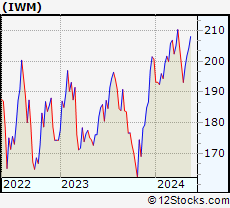
| SmallCap segment as represented by
IWM, an exchange-traded fund [ETF], holds basket of thousands of smallcap stocks from across all major sectors of the US stock market. The smallcap index (contains stocks like Riverbed & Sotheby's) is down by -2.4% and is currently underperforming the overall market by -7.2% year-to-date. Below is a quick view of technical charts and trends: | |
 IWM Weekly Chart |
|
| Long Term Trend: Good | |
| Medium Term Trend: Not Good | |
 IWM Daily Chart |
|
| Short Term Trend: Not Good | |
| Overall Trend Score: 41 | |
| YTD Performance: -2.4% | |
| **Trend Scores & Views Are Only For Educational Purposes And Not For Investing | |
| 12Stocks.com: Top Performing Small Cap Index Stocks | ||||||||||||||||||||||||||||||||||||||||||||||||
 The top performing Small Cap Index stocks year to date are
Now, more recently, over last week, the top performing Small Cap Index stocks on the move are


|
||||||||||||||||||||||||||||||||||||||||||||||||
| 12Stocks.com: Investing in Smallcap Index using Exchange Traded Funds | |
|
The following table shows list of key exchange traded funds (ETF) that
help investors track Smallcap index. The following list also includes leveraged ETF funds that track twice or thrice the daily returns of Smallcap indices. Short or inverse ETF funds move in the opposite direction to the index they track and are useful during market pullbacks or during bear markets. Quick View: Move mouse or cursor over ETF symbol (ticker) to view short-term technical chart and over ETF name to view long term chart. Click on ticker or stock name for detailed view. Click on to add stock symbol to your watchlist and to view watchlist. |
12Stocks.com List of ETFs that track Smallcap Index
| Ticker | ETF Name | Watchlist | Recent Price | Smart Investing & Trading Score | Change % | Week % | Year-to-date % |
| IWM | iShares Russell 2000 | | 195.90 | 41 | -2.03 | -1.26 | -2.4% |
| IJR | iShares Core S&P Small-Cap | | 104.39 | 86 | -1.90 | -1.19 | -3.57% |
| VTWO | Vanguard Russell 2000 ETF | | 79.16 | 81 | -2.01 | -1.32 | -2.39% |
| IWN | iShares Russell 2000 Value | | 149.04 | 86 | -1.98 | -1.39 | -4.05% |
| IWO | iShares Russell 2000 Growth | | 250.32 | 81 | -2.12 | -1.09 | -0.75% |
| IJS | iShares S&P Small-Cap 600 Value | | 96.08 | 68 | -1.91 | -1.14 | -6.78% |
| IJT | iShares S&P Small-Cap 600 Growth | | 124.60 | 88 | -1.86 | -1.18 | -0.43% |
| XSLV | PowerShares S&P SmallCap Low Volatil ETF | | 42.54 | 73 | -0.77 | -0.42 | -3.65% |
| SMLV | SPDR SSGA US Small Cap Low Volatil ETF | | 106.26 | 61 | -1.40 | -1.17 | -5.56% |
| SDD | ProShares UltraShort SmallCap600 | | 19.57 | 17 | 2.51 | 1.14 | 6.21% |
| SAA | ProShares Ultra SmallCap600 | | 22.60 | 81 | -2.88 | -1.91 | -9.42% |
| SBB | ProShares Short SmallCap600 | | 16.55 | 15 | 1.66 | 1.01 | 3.89% |
| 12Stocks.com: Charts, Trends, Fundamental Data and Performances of SmallCap Stocks | |
|
We now take in-depth look at all SmallCap stocks including charts, multi-period performances and overall trends (as measured by Smart Investing & Trading Score). One can sort SmallCap stocks (click link to choose) by Daily, Weekly and by Year-to-Date performances. Also, one can sort by size of the company or by market capitalization. |
| Select Your Default Chart Type: | |||||
| |||||
| Click on stock symbol or name for detailed view. Click on to add stock symbol to your watchlist and to view watchlist. Quick View: Move mouse or cursor over "Daily" to quickly view daily technical stock chart and over "Weekly" to view weekly technical stock chart. | |||||

 | TWST Twist Bioscience Corporation |
| Sector: Health Care | |
| SubSector: Medical Laboratories & Research | |
| MarketCap: 1065 Millions | |
| Recent Price: 31.23 Smart Investing & Trading Score: 57 | |
| Day Percent Change: -2.50% Day Change: -0.80 | |
| Week Change: -0.98% Year-to-date Change: -15.3% | |
| TWST Links: Profile News Message Board | |
| Charts:- Daily , Weekly | |
| Add TWST to Watchlist: View: Get Complete TWST Trend Analysis ➞ | |
 | PARR Par Pacific Holdings, Inc. |
| Sector: Energy | |
| SubSector: Oil & Gas Refining & Marketing | |
| MarketCap: 443.154 Millions | |
| Recent Price: 30.80 Smart Investing & Trading Score: 10 | |
| Day Percent Change: -5.03% Day Change: -1.63 | |
| Week Change: -4.97% Year-to-date Change: -15.3% | |
| PARR Links: Profile News Message Board | |
| Charts:- Daily , Weekly | |
| Add PARR to Watchlist: View: Get Complete PARR Trend Analysis ➞ | |
 | CHMG Chemung Financial Corporation |
| Sector: Financials | |
| SubSector: Regional - Pacific Banks | |
| MarketCap: 142.229 Millions | |
| Recent Price: 42.16 Smart Investing & Trading Score: 32 | |
| Day Percent Change: -1.23% Day Change: -0.52 | |
| Week Change: -2.08% Year-to-date Change: -15.3% | |
| CHMG Links: Profile News Message Board | |
| Charts:- Daily , Weekly | |
| Add CHMG to Watchlist: View: Get Complete CHMG Trend Analysis ➞ | |
 | THFF First Financial Corporation |
| Sector: Financials | |
| SubSector: Regional - Midwest Banks | |
| MarketCap: 433.07 Millions | |
| Recent Price: 36.41 Smart Investing & Trading Score: 35 | |
| Day Percent Change: -0.63% Day Change: -0.23 | |
| Week Change: -1.22% Year-to-date Change: -15.4% | |
| THFF Links: Profile News Message Board | |
| Charts:- Daily , Weekly | |
| Add THFF to Watchlist: View: Get Complete THFF Trend Analysis ➞ | |
 | KLIC Kulicke and Soffa Industries, Inc. |
| Sector: Technology | |
| SubSector: Semiconductor Equipment & Materials | |
| MarketCap: 1336.68 Millions | |
| Recent Price: 46.28 Smart Investing & Trading Score: 52 | |
| Day Percent Change: -1.87% Day Change: -0.88 | |
| Week Change: -1.57% Year-to-date Change: -15.4% | |
| KLIC Links: Profile News Message Board | |
| Charts:- Daily , Weekly | |
| Add KLIC to Watchlist: View: Get Complete KLIC Trend Analysis ➞ | |
 | ZUMZ Zumiez Inc. |
| Sector: Services & Goods | |
| SubSector: Specialty Retail, Other | |
| MarketCap: 526.244 Millions | |
| Recent Price: 17.20 Smart Investing & Trading Score: 49 | |
| Day Percent Change: 1.53% Day Change: 0.26 | |
| Week Change: 1.47% Year-to-date Change: -15.4% | |
| ZUMZ Links: Profile News Message Board | |
| Charts:- Daily , Weekly | |
| Add ZUMZ to Watchlist: View: Get Complete ZUMZ Trend Analysis ➞ | |
 | HONE HarborOne Bancorp, Inc. |
| Sector: Financials | |
| SubSector: Savings & Loans | |
| MarketCap: 456.03 Millions | |
| Recent Price: 10.13 Smart Investing & Trading Score: 60 | |
| Day Percent Change: -2.22% Day Change: -0.23 | |
| Week Change: -1.27% Year-to-date Change: -15.4% | |
| HONE Links: Profile News Message Board | |
| Charts:- Daily , Weekly | |
| Add HONE to Watchlist: View: Get Complete HONE Trend Analysis ➞ | |
 | COMP Compass, Inc. |
| Sector: Technology | |
| SubSector: Software - Application | |
| MarketCap: 1580 Millions | |
| Recent Price: 3.15 Smart Investing & Trading Score: 0 | |
| Day Percent Change: -3.67% Day Change: -0.12 | |
| Week Change: -4.55% Year-to-date Change: -15.4% | |
| COMP Links: Profile News Message Board | |
| Charts:- Daily , Weekly | |
| Add COMP to Watchlist: View: Get Complete COMP Trend Analysis ➞ | |
 | BNL Broadstone Net Lease, Inc. |
| Sector: Financials | |
| SubSector: REIT Diversified | |
| MarketCap: 27267 Millions | |
| Recent Price: 14.56 Smart Investing & Trading Score: 52 | |
| Day Percent Change: -0.68% Day Change: -0.10 | |
| Week Change: 1.61% Year-to-date Change: -15.5% | |
| BNL Links: Profile News Message Board | |
| Charts:- Daily , Weekly | |
| Add BNL to Watchlist: View: Get Complete BNL Trend Analysis ➞ | |
 | IPI Intrepid Potash, Inc. |
| Sector: Materials | |
| SubSector: Agricultural Chemicals | |
| MarketCap: 160.329 Millions | |
| Recent Price: 20.20 Smart Investing & Trading Score: 85 | |
| Day Percent Change: -0.39% Day Change: -0.08 | |
| Week Change: 3.43% Year-to-date Change: -15.5% | |
| IPI Links: Profile News Message Board | |
| Charts:- Daily , Weekly | |
| Add IPI to Watchlist: View: Get Complete IPI Trend Analysis ➞ | |
 | ABR Arbor Realty Trust, Inc. |
| Sector: Financials | |
| SubSector: Mortgage Investment | |
| MarketCap: 648.939 Millions | |
| Recent Price: 12.83 Smart Investing & Trading Score: 52 | |
| Day Percent Change: -1.46% Day Change: -0.19 | |
| Week Change: 0.08% Year-to-date Change: -15.5% | |
| ABR Links: Profile News Message Board | |
| Charts:- Daily , Weekly | |
| Add ABR to Watchlist: View: Get Complete ABR Trend Analysis ➞ | |
 | WGO Winnebago Industries, Inc. |
| Sector: Consumer Staples | |
| SubSector: Recreational Vehicles | |
| MarketCap: 896.559 Millions | |
| Recent Price: 61.58 Smart Investing & Trading Score: 10 | |
| Day Percent Change: -2.67% Day Change: -1.69 | |
| Week Change: -2.36% Year-to-date Change: -15.5% | |
| WGO Links: Profile News Message Board | |
| Charts:- Daily , Weekly | |
| Add WGO to Watchlist: View: Get Complete WGO Trend Analysis ➞ | |
 | KOS Kosmos Energy Ltd. |
| Sector: Energy | |
| SubSector: Independent Oil & Gas | |
| MarketCap: 261.693 Millions | |
| Recent Price: 5.67 Smart Investing & Trading Score: 0 | |
| Day Percent Change: -4.06% Day Change: -0.24 | |
| Week Change: -3.57% Year-to-date Change: -15.5% | |
| KOS Links: Profile News Message Board | |
| Charts:- Daily , Weekly | |
| Add KOS to Watchlist: View: Get Complete KOS Trend Analysis ➞ | |
 | MOV Movado Group, Inc. |
| Sector: Consumer Staples | |
| SubSector: Recreational Goods, Other | |
| MarketCap: 161.659 Millions | |
| Recent Price: 25.47 Smart Investing & Trading Score: 53 | |
| Day Percent Change: -2.26% Day Change: -0.59 | |
| Week Change: -2% Year-to-date Change: -15.5% | |
| MOV Links: Profile News Message Board | |
| Charts:- Daily , Weekly | |
| Add MOV to Watchlist: View: Get Complete MOV Trend Analysis ➞ | |
 | PRO PROS Holdings, Inc. |
| Sector: Technology | |
| SubSector: Application Software | |
| MarketCap: 1357.42 Millions | |
| Recent Price: 32.75 Smart Investing & Trading Score: 33 | |
| Day Percent Change: -4.52% Day Change: -1.55 | |
| Week Change: -3.62% Year-to-date Change: -15.6% | |
| PRO Links: Profile News Message Board | |
| Charts:- Daily , Weekly | |
| Add PRO to Watchlist: View: Get Complete PRO Trend Analysis ➞ | |
 | ARTNA Artesian Resources Corporation |
| Sector: Utilities | |
| SubSector: Water Utilities | |
| MarketCap: 299.402 Millions | |
| Recent Price: 34.98 Smart Investing & Trading Score: 60 | |
| Day Percent Change: -0.34% Day Change: -0.12 | |
| Week Change: 1.39% Year-to-date Change: -15.6% | |
| ARTNA Links: Profile News Message Board | |
| Charts:- Daily , Weekly | |
| Add ARTNA to Watchlist: View: Get Complete ARTNA Trend Analysis ➞ | |
 | TNET TriNet Group, Inc. |
| Sector: Services & Goods | |
| SubSector: Business Services | |
| MarketCap: 2648.72 Millions | |
| Recent Price: 100.37 Smart Investing & Trading Score: 0 | |
| Day Percent Change: -2.85% Day Change: -2.94 | |
| Week Change: -5.06% Year-to-date Change: -15.6% | |
| TNET Links: Profile News Message Board | |
| Charts:- Daily , Weekly | |
| Add TNET to Watchlist: View: Get Complete TNET Trend Analysis ➞ | |
 | MHO M/I Homes, Inc. |
| Sector: Industrials | |
| SubSector: Residential Construction | |
| MarketCap: 437.106 Millions | |
| Recent Price: 116.22 Smart Investing & Trading Score: 42 | |
| Day Percent Change: -4.12% Day Change: -5.00 | |
| Week Change: -3.21% Year-to-date Change: -15.6% | |
| MHO Links: Profile News Message Board | |
| Charts:- Daily , Weekly | |
| Add MHO to Watchlist: View: Get Complete MHO Trend Analysis ➞ | |
 | CCOI Cogent Communications Holdings, Inc. |
| Sector: Technology | |
| SubSector: Diversified Communication Services | |
| MarketCap: 3868.14 Millions | |
| Recent Price: 64.18 Smart Investing & Trading Score: 52 | |
| Day Percent Change: -2.74% Day Change: -1.81 | |
| Week Change: -2.45% Year-to-date Change: -15.6% | |
| CCOI Links: Profile News Message Board | |
| Charts:- Daily , Weekly | |
| Add CCOI to Watchlist: View: Get Complete CCOI Trend Analysis ➞ | |
 | LASR nLIGHT, Inc. |
| Sector: Technology | |
| SubSector: Semiconductor - Broad Line | |
| MarketCap: 445.642 Millions | |
| Recent Price: 11.39 Smart Investing & Trading Score: 35 | |
| Day Percent Change: -1.21% Day Change: -0.14 | |
| Week Change: -1.43% Year-to-date Change: -15.6% | |
| LASR Links: Profile News Message Board | |
| Charts:- Daily , Weekly | |
| Add LASR to Watchlist: View: Get Complete LASR Trend Analysis ➞ | |
 | ASIX AdvanSix Inc. |
| Sector: Materials | |
| SubSector: Chemicals - Major Diversified | |
| MarketCap: 394.136 Millions | |
| Recent Price: 25.26 Smart Investing & Trading Score: 46 | |
| Day Percent Change: -3.77% Day Change: -0.99 | |
| Week Change: -2.88% Year-to-date Change: -15.7% | |
| ASIX Links: Profile News Message Board | |
| Charts:- Daily , Weekly | |
| Add ASIX to Watchlist: View: Get Complete ASIX Trend Analysis ➞ | |
 | YOU Clear Secure, Inc. |
| Sector: Technology | |
| SubSector: Software - Application | |
| MarketCap: 3510 Millions | |
| Recent Price: 17.47 Smart Investing & Trading Score: 32 | |
| Day Percent Change: -0.74% Day Change: -0.13 | |
| Week Change: -0.4% Year-to-date Change: -15.7% | |
| YOU Links: Profile News Message Board | |
| Charts:- Daily , Weekly | |
| Add YOU to Watchlist: View: Get Complete YOU Trend Analysis ➞ | |
 | BOOM DMC Global Inc. |
| Sector: Industrials | |
| SubSector: Metal Fabrication | |
| MarketCap: 359.15 Millions | |
| Recent Price: 15.85 Smart Investing & Trading Score: 18 | |
| Day Percent Change: -4.29% Day Change: -0.71 | |
| Week Change: -3.88% Year-to-date Change: -15.8% | |
| BOOM Links: Profile News Message Board | |
| Charts:- Daily , Weekly | |
| Add BOOM to Watchlist: View: Get Complete BOOM Trend Analysis ➞ | |
 | ORA Ormat Technologies, Inc. |
| Sector: Utilities | |
| SubSector: Electric Utilities | |
| MarketCap: 3610.74 Millions | |
| Recent Price: 63.83 Smart Investing & Trading Score: 58 | |
| Day Percent Change: -1.01% Day Change: -0.65 | |
| Week Change: 1.14% Year-to-date Change: -15.8% | |
| ORA Links: Profile News Message Board | |
| Charts:- Daily , Weekly | |
| Add ORA to Watchlist: View: Get Complete ORA Trend Analysis ➞ | |
 | AURA Aura Biosciences, Inc. |
| Sector: Health Care | |
| SubSector: Biotechnology | |
| MarketCap: 469 Millions | |
| Recent Price: 7.45 Smart Investing & Trading Score: 59 | |
| Day Percent Change: -0.67% Day Change: -0.05 | |
| Week Change: 3.19% Year-to-date Change: -15.8% | |
| AURA Links: Profile News Message Board | |
| Charts:- Daily , Weekly | |
| Add AURA to Watchlist: View: Get Complete AURA Trend Analysis ➞ | |
| Too many stocks? View smallcap stocks filtered by marketcap & sector |
| Marketcap: All SmallCap Stocks (default-no microcap), Large, Mid-Range, Small & MicroCap |
| Sector: Tech, Finance, Energy, Staples, Retail, Industrial, Materials, Utilities & Medical |
|
Best Stocks Today 12Stocks.com |
© 2024 12Stocks.com Terms & Conditions Privacy Contact Us
All Information Provided Only For Education And Not To Be Used For Investing or Trading. See Terms & Conditions


One More Thing ... Get Best Stocks Delivered Daily!
Never Ever Miss A Move With Our Top Ten Stocks Lists
Find Best Stocks In Any Market - Bull or Bear Market
Take A Peek At Our Top Ten Stocks Lists: Daily, Weekly, Year-to-Date & Top Trends
Find Best Stocks In Any Market - Bull or Bear Market
Take A Peek At Our Top Ten Stocks Lists: Daily, Weekly, Year-to-Date & Top Trends
Smallcap Stocks With Best Up Trends [0-bearish to 100-bullish]: Allegheny [100], Brinker [100], Day One[100], Heartland Financial[100], Carpenter [100], LTC Properties[100], Semtech [100], California Water[100], Impinj [100], Sensient [100], Costamare [100]
Best Smallcap Stocks Year-to-Date:
Janux [431.32%], Viking [327.62%], Longboard [248.2%], Alpine Immune[239.23%], Super Micro[202.12%], Bakkt [200.9%], Avidity Biosciences[167.04%], Cullinan Oncology[164.88%], Arcutis Bio[157.59%], Vera [155.36%], Hippo [134.8%] Best Smallcap Stocks This Week:
Deciphera [72.49%], Cue Biopharma[39.19%], GrowGeneration [34.68%], Phibro Animal[31.19%], LendingTree [27.36%], Janux [20.3%], Seres [20.07%], Eyenovia [19.55%], P3 Health[18.22%], Heartland Financial[17.89%], Harmonic [16.74%] Best Smallcap Stocks Daily:
Cue Biopharma[33.80%], GrowGeneration [30.00%], LendingTree [29.24%], SES AI[17.04%], Allegheny [15.03%], AnaptysBio [14.27%], Harmonic [14.26%], LSB Industries[13.14%], P3 Health[12.09%], Clearwater Paper[10.69%], Seres [8.98%]