
 Login Sign Up


| |||||
 |  | ||||

| 12Stocks.com Market Intelligence |
Best SmallCap Stocks
|
| In a hurry? Small Cap Stock Lists: Performance Trends Table, Stock Charts
Sort Small Cap stocks: Daily, Weekly, Year-to-Date, Market Cap & Trends. Filter Small Cap stocks list by sector: Show all, Tech, Finance, Energy, Staples, Retail, Industrial, Materials, Utilities and HealthCare Filter Small Cap stocks list by size: All Large Medium Small and MicroCap |
| 12Stocks.com Small Cap Stocks Performances & Trends Daily | |||||||||
|
|  The overall Smart Investing & Trading Score is 39 (0-bearish to 100-bullish) which puts Small Cap index in short term bearish to neutral trend. The Smart Investing & Trading Score from previous trading session is 41 and hence a deterioration of trend.
| ||||||||
Here are the Smart Investing & Trading Scores of the most requested small cap stocks at 12Stocks.com (click stock name for detailed review):
|


| 12Stocks.com: Investing in Smallcap Index with Stocks | |
|
The following table helps investors and traders sort through current performance and trends (as measured by Smart Investing & Trading Score) of various
stocks in the Smallcap Index. Quick View: Move mouse or cursor over stock symbol (ticker) to view short-term technical chart and over stock name to view long term chart. Click on  to add stock symbol to your watchlist and to add stock symbol to your watchlist and  to view watchlist. Click on any ticker or stock name for detailed market intelligence report for that stock. to view watchlist. Click on any ticker or stock name for detailed market intelligence report for that stock. |
12Stocks.com Performance of Stocks in Smallcap Index
| Ticker | Stock Name | Watchlist | Category | Recent Price | Smart Investing & Trading Score | Change % | YTD Change% |
| ADUS | Addus HomeCare |   | Health Care | 98.31 | 75 | 2.25% | 5.88% |
| NWPX | Northwest Pipe | | Materials | 32.03 | 54 | 0.90% | 5.87% |
| HAYN | Haynes | | Industrials | 60.40 | 63 | 0.42% | 5.87% |
| SPNS | Sapiens | | Technology | 30.64 | 58 | -0.54% | 5.86% |
| ACEL | Accel Entertainment | | Services & Goods | 10.87 | 0 | 1.21% | 5.84% |
| JELD | JELD-WEN Holding | | Industrials | 19.98 | 20 | -2.54% | 5.83% |
| FCFS | FirstCash | | Financials | 114.67 | 10 | 1.50% | 5.79% |
| TPH | TRI Pointe | | Industrials | 37.45 | 55 | 1.63% | 5.79% |
| RDN | Radian Group | | Financials | 30.18 | 65 | 1.04% | 5.71% |
| BBSI | Barrett Business | | Services & Goods | 122.40 | 36 | 0.74% | 5.70% |
| ODC | Oil-Dri | | Materials | 70.82 | 32 | 2.27% | 5.58% |
| CWST | Casella Waste | | Industrials | 90.20 | 21 | -0.22% | 5.55% |
| SAFT | Safety Insurance | | Financials | 80.19 | 62 | 0.78% | 5.53% |
| BGS | B&G Foods | | Consumer Staples | 11.08 | 52 | -0.18% | 5.52% |
| HP | Helmerich & Payne | | Energy | 38.21 | 13 | -2.85% | 5.49% |
| FORM | FormFactor | | Technology | 43.99 | 33 | -1.35% | 5.47% |
| CMPR | Cimpress | | Services & Goods | 84.42 | 0 | -1.00% | 5.46% |
| CVCO | Cavco Industries | | Industrials | 365.48 | 14 | 0.35% | 5.44% |
| ZUO | Zuora | | Technology | 9.91 | 44 | 0.51% | 5.43% |
| OLP | One Liberty | | Financials | 23.09 | 100 | 0.79% | 5.39% |
| GLUE | Monte Rosa | | Health Care | 5.93 | 37 | 11.47% | 5.33% |
| BDC | Belden | | Industrials | 81.32 | 10 | 0.06% | 5.27% |
| LILAK | Liberty Latin | | Technology | 7.72 | 83 | 2.39% | 5.18% |
| IBOC | Bancshares | | Financials | 57.13 | 100 | 2.66% | 5.17% |
| MLAB | Mesa | | Technology | 110.15 | 74 | 3.84% | 5.14% |


| Too many stocks? View smallcap stocks filtered by marketcap & sector |
| Marketcap: All SmallCap Stocks (default-no microcap), Large, Mid-Range, Small |
| Smallcap Sector: Tech, Finance, Energy, Staples, Retail, Industrial, Materials, & Medical |
|
Get the most comprehensive stock market coverage daily at 12Stocks.com ➞ Best Stocks Today ➞ Best Stocks Weekly ➞ Best Stocks Year-to-Date ➞ Best Stocks Trends ➞  Best Stocks Today 12Stocks.com Best Nasdaq Stocks ➞ Best S&P 500 Stocks ➞ Best Tech Stocks ➞ Best Biotech Stocks ➞ |
| Detailed Overview of SmallCap Stocks |
| SmallCap Technical Overview, Leaders & Laggards, Top SmallCap ETF Funds & Detailed SmallCap Stocks List, Charts, Trends & More |
| Smallcap: Technical Analysis, Trends & YTD Performance | |
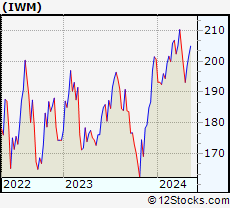
| SmallCap segment as represented by
IWM, an exchange-traded fund [ETF], holds basket of thousands of smallcap stocks from across all major sectors of the US stock market. The smallcap index (contains stocks like Riverbed & Sotheby's) is down by -2.19% and is currently underperforming the overall market by -6.73% year-to-date. Below is a quick view of technical charts and trends: | |
 IWM Weekly Chart |
|
| Long Term Trend: Not Good | |
| Medium Term Trend: Good | |
 IWM Daily Chart |
|
| Short Term Trend: Very Good | |
| Overall Trend Score: 39 | |
| YTD Performance: -2.19% | |
| **Trend Scores & Views Are Only For Educational Purposes And Not For Investing | |
| 12Stocks.com: Top Performing Small Cap Index Stocks | ||||||||||||||||||||||||||||||||||||||||||||||||
 The top performing Small Cap Index stocks year to date are
Now, more recently, over last week, the top performing Small Cap Index stocks on the move are


|
||||||||||||||||||||||||||||||||||||||||||||||||
| 12Stocks.com: Investing in Smallcap Index using Exchange Traded Funds | |
|
The following table shows list of key exchange traded funds (ETF) that
help investors track Smallcap index. The following list also includes leveraged ETF funds that track twice or thrice the daily returns of Smallcap indices. Short or inverse ETF funds move in the opposite direction to the index they track and are useful during market pullbacks or during bear markets. Quick View: Move mouse or cursor over ETF symbol (ticker) to view short-term technical chart and over ETF name to view long term chart. Click on ticker or stock name for detailed view. Click on to add stock symbol to your watchlist and to view watchlist. |
12Stocks.com List of ETFs that track Smallcap Index
| Ticker | ETF Name | Watchlist | Recent Price | Smart Investing & Trading Score | Change % | Week % | Year-to-date % |
| IWM | iShares Russell 2000 | | 196.31 | 39 | 0.21 | -1.05 | -2.19% |
| IJR | iShares Core S&P Small-Cap | | 104.75 | 22 | 0.34 | -0.85 | -3.23% |
| VTWO | Vanguard Russell 2000 ETF | | 79.37 | 14 | 0.27 | -1.06 | -2.13% |
| IWN | iShares Russell 2000 Value | | 149.91 | 22 | 0.58 | -0.81 | -3.49% |
| IJS | iShares S&P Small-Cap 600 Value | | 96.40 | 15 | 0.33 | -0.81 | -6.47% |
| IWO | iShares Russell 2000 Growth | | 249.70 | 7 | -0.25 | -1.34 | -1% |
| IJT | iShares S&P Small-Cap 600 Growth | | 124.90 | 15 | 0.24 | -0.94 | -0.19% |
| XSLV | PowerShares S&P SmallCap Low Volatil ETF | | 42.89 | 52 | 0.82 | 0.4 | -2.85% |
| SDD | ProShares UltraShort SmallCap600 | | 19.55 | 37 | -0.10 | 1.03 | 6.1% |
| SMLV | SPDR SSGA US Small Cap Low Volatil ETF | | 107.07 | 22 | 0.76 | -0.42 | -4.84% |
| SBB | ProShares Short SmallCap600 | | 16.50 | 20 | -0.30 | 0.7 | 3.58% |
| SAA | ProShares Ultra SmallCap600 | | 22.53 | 13 | -0.31 | -2.21 | -9.7% |
| 12Stocks.com: Charts, Trends, Fundamental Data and Performances of SmallCap Stocks | |
|
We now take in-depth look at all SmallCap stocks including charts, multi-period performances and overall trends (as measured by Smart Investing & Trading Score). One can sort SmallCap stocks (click link to choose) by Daily, Weekly and by Year-to-Date performances. Also, one can sort by size of the company or by market capitalization. |
| Select Your Default Chart Type: | |||||
| |||||
| Click on stock symbol or name for detailed view. Click on to add stock symbol to your watchlist and to view watchlist. Quick View: Move mouse or cursor over "Daily" to quickly view daily technical stock chart and over "Weekly" to view weekly technical stock chart. | |||||

 | ADUS Addus HomeCare Corporation |
| Sector: Health Care | |
| SubSector: Home Health Care | |
| MarketCap: 994.795 Millions | |
| Recent Price: 98.31 Smart Investing & Trading Score: 75 | |
| Day Percent Change: 2.25% Day Change: 2.16 | |
| Week Change: 3.99% Year-to-date Change: 5.9% | |
| ADUS Links: Profile News Message Board | |
| Charts:- Daily , Weekly | |
| Add ADUS to Watchlist: View: Get Complete ADUS Trend Analysis ➞ | |
 | NWPX Northwest Pipe Company |
| Sector: Materials | |
| SubSector: Steel & Iron | |
| MarketCap: 245.788 Millions | |
| Recent Price: 32.03 Smart Investing & Trading Score: 54 | |
| Day Percent Change: 0.90% Day Change: 0.28 | |
| Week Change: 0.71% Year-to-date Change: 5.9% | |
| NWPX Links: Profile News Message Board | |
| Charts:- Daily , Weekly | |
| Add NWPX to Watchlist: View: Get Complete NWPX Trend Analysis ➞ | |
 | HAYN Haynes International, Inc. |
| Sector: Industrials | |
| SubSector: Metal Fabrication | |
| MarketCap: 245.75 Millions | |
| Recent Price: 60.40 Smart Investing & Trading Score: 63 | |
| Day Percent Change: 0.42% Day Change: 0.25 | |
| Week Change: 0.15% Year-to-date Change: 5.9% | |
| HAYN Links: Profile News Message Board | |
| Charts:- Daily , Weekly | |
| Add HAYN to Watchlist: View: Get Complete HAYN Trend Analysis ➞ | |
 | SPNS Sapiens International Corporation N.V. |
| Sector: Technology | |
| SubSector: Business Software & Services | |
| MarketCap: 841.858 Millions | |
| Recent Price: 30.64 Smart Investing & Trading Score: 58 | |
| Day Percent Change: -0.54% Day Change: -0.16 | |
| Week Change: -2.12% Year-to-date Change: 5.9% | |
| SPNS Links: Profile News Message Board | |
| Charts:- Daily , Weekly | |
| Add SPNS to Watchlist: View: Get Complete SPNS Trend Analysis ➞ | |
 | ACEL Accel Entertainment, Inc. |
| Sector: Services & Goods | |
| SubSector: Gaming Activities | |
| MarketCap: 486.589 Millions | |
| Recent Price: 10.87 Smart Investing & Trading Score: 0 | |
| Day Percent Change: 1.21% Day Change: 0.13 | |
| Week Change: -2.86% Year-to-date Change: 5.8% | |
| ACEL Links: Profile News Message Board | |
| Charts:- Daily , Weekly | |
| Add ACEL to Watchlist: View: Get Complete ACEL Trend Analysis ➞ | |
 | JELD JELD-WEN Holding, Inc. |
| Sector: Industrials | |
| SubSector: General Building Materials | |
| MarketCap: 1022.53 Millions | |
| Recent Price: 19.98 Smart Investing & Trading Score: 20 | |
| Day Percent Change: -2.54% Day Change: -0.52 | |
| Week Change: -6.64% Year-to-date Change: 5.8% | |
| JELD Links: Profile News Message Board | |
| Charts:- Daily , Weekly | |
| Add JELD to Watchlist: View: Get Complete JELD Trend Analysis ➞ | |
 | FCFS FirstCash, Inc. |
| Sector: Financials | |
| SubSector: Credit Services | |
| MarketCap: 2795.48 Millions | |
| Recent Price: 114.67 Smart Investing & Trading Score: 10 | |
| Day Percent Change: 1.50% Day Change: 1.69 | |
| Week Change: -0.9% Year-to-date Change: 5.8% | |
| FCFS Links: Profile News Message Board | |
| Charts:- Daily , Weekly | |
| Add FCFS to Watchlist: View: Get Complete FCFS Trend Analysis ➞ | |
 | TPH TRI Pointe Group, Inc. |
| Sector: Industrials | |
| SubSector: Residential Construction | |
| MarketCap: 1140.06 Millions | |
| Recent Price: 37.45 Smart Investing & Trading Score: 55 | |
| Day Percent Change: 1.63% Day Change: 0.60 | |
| Week Change: -1.14% Year-to-date Change: 5.8% | |
| TPH Links: Profile News Message Board | |
| Charts:- Daily , Weekly | |
| Add TPH to Watchlist: View: Get Complete TPH Trend Analysis ➞ | |
 | RDN Radian Group Inc. |
| Sector: Financials | |
| SubSector: Property & Casualty Insurance | |
| MarketCap: 2950.12 Millions | |
| Recent Price: 30.18 Smart Investing & Trading Score: 65 | |
| Day Percent Change: 1.04% Day Change: 0.31 | |
| Week Change: -0.56% Year-to-date Change: 5.7% | |
| RDN Links: Profile News Message Board | |
| Charts:- Daily , Weekly | |
| Add RDN to Watchlist: View: Get Complete RDN Trend Analysis ➞ | |
 | BBSI Barrett Business Services, Inc. |
| Sector: Services & Goods | |
| SubSector: Staffing & Outsourcing Services | |
| MarketCap: 262.028 Millions | |
| Recent Price: 122.40 Smart Investing & Trading Score: 36 | |
| Day Percent Change: 0.74% Day Change: 0.90 | |
| Week Change: 0.52% Year-to-date Change: 5.7% | |
| BBSI Links: Profile News Message Board | |
| Charts:- Daily , Weekly | |
| Add BBSI to Watchlist: View: Get Complete BBSI Trend Analysis ➞ | |
 | ODC Oil-Dri Corporation of America |
| Sector: Materials | |
| SubSector: Specialty Chemicals | |
| MarketCap: 249.857 Millions | |
| Recent Price: 70.82 Smart Investing & Trading Score: 32 | |
| Day Percent Change: 2.27% Day Change: 1.57 | |
| Week Change: 3.01% Year-to-date Change: 5.6% | |
| ODC Links: Profile News Message Board | |
| Charts:- Daily , Weekly | |
| Add ODC to Watchlist: View: Get Complete ODC Trend Analysis ➞ | |
 | CWST Casella Waste Systems, Inc. |
| Sector: Industrials | |
| SubSector: Waste Management | |
| MarketCap: 2093.38 Millions | |
| Recent Price: 90.20 Smart Investing & Trading Score: 21 | |
| Day Percent Change: -0.22% Day Change: -0.20 | |
| Week Change: 0.16% Year-to-date Change: 5.6% | |
| CWST Links: Profile News Message Board | |
| Charts:- Daily , Weekly | |
| Add CWST to Watchlist: View: Get Complete CWST Trend Analysis ➞ | |
 | SAFT Safety Insurance Group, Inc. |
| Sector: Financials | |
| SubSector: Property & Casualty Insurance | |
| MarketCap: 1145.12 Millions | |
| Recent Price: 80.19 Smart Investing & Trading Score: 62 | |
| Day Percent Change: 0.78% Day Change: 0.62 | |
| Week Change: 1.74% Year-to-date Change: 5.5% | |
| SAFT Links: Profile News Message Board | |
| Charts:- Daily , Weekly | |
| Add SAFT to Watchlist: View: Get Complete SAFT Trend Analysis ➞ | |
 | BGS B&G Foods, Inc. |
| Sector: Consumer Staples | |
| SubSector: Processed & Packaged Goods | |
| MarketCap: 1456.08 Millions | |
| Recent Price: 11.08 Smart Investing & Trading Score: 52 | |
| Day Percent Change: -0.18% Day Change: -0.02 | |
| Week Change: 0.18% Year-to-date Change: 5.5% | |
| BGS Links: Profile News Message Board | |
| Charts:- Daily , Weekly | |
| Add BGS to Watchlist: View: Get Complete BGS Trend Analysis ➞ | |
 | HP Helmerich & Payne, Inc. |
| Sector: Energy | |
| SubSector: Oil & Gas Drilling & Exploration | |
| MarketCap: 1796.39 Millions | |
| Recent Price: 38.21 Smart Investing & Trading Score: 13 | |
| Day Percent Change: -2.85% Day Change: -1.12 | |
| Week Change: -5.4% Year-to-date Change: 5.5% | |
| HP Links: Profile News Message Board | |
| Charts:- Daily , Weekly | |
| Add HP to Watchlist: View: Get Complete HP Trend Analysis ➞ | |
 | FORM FormFactor, Inc. |
| Sector: Technology | |
| SubSector: Semiconductor - Broad Line | |
| MarketCap: 1426.42 Millions | |
| Recent Price: 43.99 Smart Investing & Trading Score: 33 | |
| Day Percent Change: -1.35% Day Change: -0.60 | |
| Week Change: -1.7% Year-to-date Change: 5.5% | |
| FORM Links: Profile News Message Board | |
| Charts:- Daily , Weekly | |
| Add FORM to Watchlist: View: Get Complete FORM Trend Analysis ➞ | |
 | CMPR Cimpress plc |
| Sector: Services & Goods | |
| SubSector: Business Services | |
| MarketCap: 1675.02 Millions | |
| Recent Price: 84.42 Smart Investing & Trading Score: 0 | |
| Day Percent Change: -1.00% Day Change: -0.85 | |
| Week Change: -5.23% Year-to-date Change: 5.5% | |
| CMPR Links: Profile News Message Board | |
| Charts:- Daily , Weekly | |
| Add CMPR to Watchlist: View: Get Complete CMPR Trend Analysis ➞ | |
 | CVCO Cavco Industries, Inc. |
| Sector: Industrials | |
| SubSector: Residential Construction | |
| MarketCap: 1375.86 Millions | |
| Recent Price: 365.48 Smart Investing & Trading Score: 14 | |
| Day Percent Change: 0.35% Day Change: 1.27 | |
| Week Change: -1.91% Year-to-date Change: 5.4% | |
| CVCO Links: Profile News Message Board | |
| Charts:- Daily , Weekly | |
| Add CVCO to Watchlist: View: Get Complete CVCO Trend Analysis ➞ | |
 | ZUO Zuora, Inc. |
| Sector: Technology | |
| SubSector: Application Software | |
| MarketCap: 1063.22 Millions | |
| Recent Price: 9.91 Smart Investing & Trading Score: 44 | |
| Day Percent Change: 0.51% Day Change: 0.05 | |
| Week Change: -0.4% Year-to-date Change: 5.4% | |
| ZUO Links: Profile News Message Board | |
| Charts:- Daily , Weekly | |
| Add ZUO to Watchlist: View: Get Complete ZUO Trend Analysis ➞ | |
 | OLP One Liberty Properties, Inc. |
| Sector: Financials | |
| SubSector: REIT - Diversified | |
| MarketCap: 378.353 Millions | |
| Recent Price: 23.09 Smart Investing & Trading Score: 100 | |
| Day Percent Change: 0.79% Day Change: 0.18 | |
| Week Change: 1.58% Year-to-date Change: 5.4% | |
| OLP Links: Profile News Message Board | |
| Charts:- Daily , Weekly | |
| Add OLP to Watchlist: View: Get Complete OLP Trend Analysis ➞ | |
 | GLUE Monte Rosa Therapeutics, Inc. |
| Sector: Health Care | |
| SubSector: Biotechnology | |
| MarketCap: 346 Millions | |
| Recent Price: 5.93 Smart Investing & Trading Score: 37 | |
| Day Percent Change: 11.47% Day Change: 0.61 | |
| Week Change: 11.26% Year-to-date Change: 5.3% | |
| GLUE Links: Profile News Message Board | |
| Charts:- Daily , Weekly | |
| Add GLUE to Watchlist: View: Get Complete GLUE Trend Analysis ➞ | |
 | BDC Belden Inc. |
| Sector: Industrials | |
| SubSector: Industrial Electrical Equipment | |
| MarketCap: 1490.59 Millions | |
| Recent Price: 81.32 Smart Investing & Trading Score: 10 | |
| Day Percent Change: 0.06% Day Change: 0.05 | |
| Week Change: -2.49% Year-to-date Change: 5.3% | |
| BDC Links: Profile News Message Board | |
| Charts:- Daily , Weekly | |
| Add BDC to Watchlist: View: Get Complete BDC Trend Analysis ➞ | |
 | LILAK Liberty Latin America Ltd. |
| Sector: Technology | |
| SubSector: CATV Systems | |
| MarketCap: 1210.32 Millions | |
| Recent Price: 7.72 Smart Investing & Trading Score: 83 | |
| Day Percent Change: 2.39% Day Change: 0.18 | |
| Week Change: 1.45% Year-to-date Change: 5.2% | |
| LILAK Links: Profile News Message Board | |
| Charts:- Daily , Weekly | |
| Add LILAK to Watchlist: View: Get Complete LILAK Trend Analysis ➞ | |
 | IBOC International Bancshares Corporation |
| Sector: Financials | |
| SubSector: Regional - Southwest Banks | |
| MarketCap: 1159.45 Millions | |
| Recent Price: 57.13 Smart Investing & Trading Score: 100 | |
| Day Percent Change: 2.66% Day Change: 1.48 | |
| Week Change: 1.75% Year-to-date Change: 5.2% | |
| IBOC Links: Profile News Message Board | |
| Charts:- Daily , Weekly | |
| Add IBOC to Watchlist: View: Get Complete IBOC Trend Analysis ➞ | |
 | MLAB Mesa Laboratories, Inc. |
| Sector: Technology | |
| SubSector: Scientific & Technical Instruments | |
| MarketCap: 935.453 Millions | |
| Recent Price: 110.15 Smart Investing & Trading Score: 74 | |
| Day Percent Change: 3.84% Day Change: 4.07 | |
| Week Change: 6.74% Year-to-date Change: 5.1% | |
| MLAB Links: Profile News Message Board | |
| Charts:- Daily , Weekly | |
| Add MLAB to Watchlist: View: Get Complete MLAB Trend Analysis ➞ | |
| Too many stocks? View smallcap stocks filtered by marketcap & sector |
| Marketcap: All SmallCap Stocks (default-no microcap), Large, Mid-Range, Small & MicroCap |
| Sector: Tech, Finance, Energy, Staples, Retail, Industrial, Materials, Utilities & Medical |
|
Best Stocks Today 12Stocks.com |
© 2024 12Stocks.com Terms & Conditions Privacy Contact Us
All Information Provided Only For Education And Not To Be Used For Investing or Trading. See Terms & Conditions


One More Thing ... Get Best Stocks Delivered Daily!
Never Ever Miss A Move With Our Top Ten Stocks Lists
Find Best Stocks In Any Market - Bull or Bear Market
Take A Peek At Our Top Ten Stocks Lists: Daily, Weekly, Year-to-Date & Top Trends
Find Best Stocks In Any Market - Bull or Bear Market
Take A Peek At Our Top Ten Stocks Lists: Daily, Weekly, Year-to-Date & Top Trends
Smallcap Stocks With Best Up Trends [0-bearish to 100-bullish]: Surmodics [100], Rocky Brands[100], TransMedics Group[100], LendingClub [100], A10 s[100], Carpenter [100], UFP [100], PROCEPT BioRobotics[100], Xencor [100], Trinity Industries[100], TPG RE[100]
Best Smallcap Stocks Year-to-Date:
Janux [441.55%], Viking [310.45%], Longboard [259.25%], Alpine Immune[239.26%], Avidity Biosciences[185.4%], Bakkt [182.96%], Cullinan Oncology[175.33%], Vera [173.32%], Arcutis Bio[173.07%], Super Micro[159.62%], Y-mAbs [141.35%] Best Smallcap Stocks This Week:
Deciphera [73.07%], Eyenovia [44.86%], Cue Biopharma[39.93%], Poseida [30.52%], Seres [30.3%], P3 Health[29.62%], Phibro Animal[28.75%], TransMedics Group[27.69%], Surmodics [27.24%], LendingTree [26.12%], Rocky Brands[24.58%] Best Smallcap Stocks Daily:
Surmodics [29.62%], Rocky Brands[28.06%], TransMedics Group[24.91%], Ventyx Biosciences[24.63%], Eyenovia [21.17%], LendingClub [19.68%], Summit [19.08%], Powell Industries[18.74%], MiMedx Group[18.34%], CareDx [18.04%], A10 s[17.69%]