
 Login Sign Up


| |||||
 |  | ||||

| 12Stocks.com Market Intelligence |
Best SmallCap Stocks
|
| In a hurry? Small Cap Stock Lists: Performance Trends Table, Stock Charts
Sort Small Cap stocks: Daily, Weekly, Year-to-Date, Market Cap & Trends. Filter Small Cap stocks list by sector: Show all, Tech, Finance, Energy, Staples, Retail, Industrial, Materials, Utilities and HealthCare Filter Small Cap stocks list by size: All Large Medium Small and MicroCap |
| 12Stocks.com Small Cap Stocks Performances & Trends Daily | |||||||||
|
|  The overall Smart Investing & Trading Score is 88 (0-bearish to 100-bullish) which puts Small Cap index in short term bullish trend. The Smart Investing & Trading Score from previous trading session is 56 and hence an improvement of trend.
| ||||||||
Here are the Smart Investing & Trading Scores of the most requested small cap stocks at 12Stocks.com (click stock name for detailed review):
|


| 12Stocks.com: Investing in Smallcap Index with Stocks | |
|
The following table helps investors and traders sort through current performance and trends (as measured by Smart Investing & Trading Score) of various
stocks in the Smallcap Index. Quick View: Move mouse or cursor over stock symbol (ticker) to view short-term technical chart and over stock name to view long term chart. Click on  to add stock symbol to your watchlist and to add stock symbol to your watchlist and  to view watchlist. Click on any ticker or stock name for detailed market intelligence report for that stock. to view watchlist. Click on any ticker or stock name for detailed market intelligence report for that stock. |
12Stocks.com Performance of Stocks in Smallcap Index
| Ticker | Stock Name | Watchlist | Category | Recent Price | Smart Investing & Trading Score | Change % | YTD Change% |
| CBNK | Capital Bancorp |   | Financials | 19.79 | 42 | 1.07% | -18.22% |
| CERS | Cerus | | Health Care | 1.76 | 52 | 3.22% | -18.29% |
| FBMS | First Bancshares | | Financials | 23.97 | 42 | 0.27% | -18.29% |
| HLLY | Holley | | Services & Goods | 4.05 | 20 | 1.38% | -18.33% |
| AVAH | Aveanna Healthcare | | Health Care | 2.20 | 10 | 0.00% | -18.37% |
| FENC | Fennec | | Health Care | 9.15 | 32 | -0.65% | -18.45% |
| CRCT | Cricut | | Technology | 5.43 | 41 | 0.74% | -18.65% |
| INSM | Insmed | | Health Care | 25.20 | 27 | 1.61% | -18.68% |
| IPAR | Inter Parfums | | Consumer Staples | 117.11 | 0 | -2.05% | -18.68% |
| SMP | Standard Motor | | Consumer Staples | 32.37 | 49 | -0.28% | -18.69% |
| NG | NovaGold Resources | | Materials | 3.04 | 73 | 3.40% | -18.72% |
| PKBK | Parke Bancorp | | Financials | 16.46 | 32 | 0.00% | -18.72% |
| OVLY | Oak Valley | | Financials | 24.34 | 32 | 0.00% | -18.73% |
| HAFC | Hanmi Financial | | Financials | 15.76 | 74 | -0.38% | -18.76% |
| DLTH | Duluth | | Services & Goods | 4.37 | 59 | -0.11% | -18.77% |
| DVAX | Dynavax | | Health Care | 11.35 | 27 | 1.25% | -18.81% |
| CWH | Camping World | | Financials | 21.32 | 17 | -0.61% | -18.81% |
| HTBK | Heritage Commerce | | Financials | 8.05 | 42 | 0.63% | -18.85% |
| CIVB | Civista Bancshares | | Financials | 14.96 | 42 | 0.74% | -18.87% |
| TCBK | TriCo Bancshares | | Financials | 34.85 | 47 | 2.97% | -18.89% |
| BRZE | Braze | | Technology | 43.18 | 15 | 3.50% | -18.90% |
| NEWT | Newtek Business | | Services & Goods | 11.19 | 52 | 1.73% | -18.91% |
| PTSI | P.A.M. Transportation | | Transports | 16.84 | 67 | 0.00% | -18.96% |
| MOND | Mondee | | Services & Goods | 2.25 | 15 | 3.21% | -19.06% |
| CENTA | Central Garden | | Materials | 35.60 | 44 | 0.18% | -19.15% |


| Too many stocks? View smallcap stocks filtered by marketcap & sector |
| Marketcap: All SmallCap Stocks (default-no microcap), Large, Mid-Range, Small |
| Smallcap Sector: Tech, Finance, Energy, Staples, Retail, Industrial, Materials, & Medical |
|
Get the most comprehensive stock market coverage daily at 12Stocks.com ➞ Best Stocks Today ➞ Best Stocks Weekly ➞ Best Stocks Year-to-Date ➞ Best Stocks Trends ➞  Best Stocks Today 12Stocks.com Best Nasdaq Stocks ➞ Best S&P 500 Stocks ➞ Best Tech Stocks ➞ Best Biotech Stocks ➞ |
| Detailed Overview of SmallCap Stocks |
| SmallCap Technical Overview, Leaders & Laggards, Top SmallCap ETF Funds & Detailed SmallCap Stocks List, Charts, Trends & More |
| Smallcap: Technical Analysis, Trends & YTD Performance | |
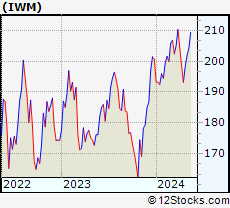
| SmallCap segment as represented by
IWM, an exchange-traded fund [ETF], holds basket of thousands of smallcap stocks from across all major sectors of the US stock market. The smallcap index (contains stocks like Riverbed & Sotheby's) is down by -0.36% and is currently underperforming the overall market by -6.65% year-to-date. Below is a quick view of technical charts and trends: | |
 IWM Weekly Chart |
|
| Long Term Trend: Very Good | |
| Medium Term Trend: Good | |
 IWM Daily Chart |
|
| Short Term Trend: Very Good | |
| Overall Trend Score: 88 | |
| YTD Performance: -0.36% | |
| **Trend Scores & Views Are Only For Educational Purposes And Not For Investing | |
| 12Stocks.com: Top Performing Small Cap Index Stocks | ||||||||||||||||||||||||||||||||||||||||||||||||
 The top performing Small Cap Index stocks year to date are
Now, more recently, over last week, the top performing Small Cap Index stocks on the move are


|
||||||||||||||||||||||||||||||||||||||||||||||||
| 12Stocks.com: Investing in Smallcap Index using Exchange Traded Funds | |
|
The following table shows list of key exchange traded funds (ETF) that
help investors track Smallcap index. The following list also includes leveraged ETF funds that track twice or thrice the daily returns of Smallcap indices. Short or inverse ETF funds move in the opposite direction to the index they track and are useful during market pullbacks or during bear markets. Quick View: Move mouse or cursor over ETF symbol (ticker) to view short-term technical chart and over ETF name to view long term chart. Click on ticker or stock name for detailed view. Click on to add stock symbol to your watchlist and to view watchlist. |
12Stocks.com List of ETFs that track Smallcap Index
| Ticker | ETF Name | Watchlist | Recent Price | Smart Investing & Trading Score | Change % | Week % | Year-to-date % |
| IWM | iShares Russell 2000 | | 199.98 | 88 | 0.80 | 0.8 | -0.36% |
| VTWO | Vanguard Russell 2000 ETF | | 80.77 | 88 | 0.69 | 0.69 | -0.41% |
| IWN | iShares Russell 2000 Value | | 152.09 | 93 | 0.63 | 0.63 | -2.09% |
| IJR | iShares Core S&P Small-Cap | | 106.37 | 93 | 0.68 | 0.68 | -1.74% |
| IWO | iShares Russell 2000 Growth | | 255.17 | 78 | 0.82 | 0.82 | 1.17% |
| IJS | iShares S&P Small-Cap 600 Value | | 97.96 | 70 | 0.79 | 0.79 | -4.96% |
| XSLV | PowerShares S&P SmallCap Low Volatil ETF | | 42.97 | 80 | 0.59 | 0.59 | -2.67% |
| IJT | iShares S&P Small-Cap 600 Growth | | 126.09 | 88 | 0.00 | 0 | 0.76% |
| SAA | ProShares Ultra SmallCap600 | | 23.27 | 88 | 1.00 | 1 | -6.73% |
| SBB | ProShares Short SmallCap600 | | 16.28 | 8 | -0.64 | -0.64 | 2.2% |
| SMLV | SPDR SSGA US Small Cap Low Volatil ETF | | 107.62 | 75 | 0.10 | 0.1 | -4.35% |
| SDD | ProShares UltraShort SmallCap600 | | 19.09 | 15 | -1.34 | -1.34 | 3.6% |
| 12Stocks.com: Charts, Trends, Fundamental Data and Performances of SmallCap Stocks | |
|
We now take in-depth look at all SmallCap stocks including charts, multi-period performances and overall trends (as measured by Smart Investing & Trading Score). One can sort SmallCap stocks (click link to choose) by Daily, Weekly and by Year-to-Date performances. Also, one can sort by size of the company or by market capitalization. |
| Select Your Default Chart Type: | |||||
| |||||
| Click on stock symbol or name for detailed view. Click on to add stock symbol to your watchlist and to view watchlist. Quick View: Move mouse or cursor over "Daily" to quickly view daily technical stock chart and over "Weekly" to view weekly technical stock chart. | |||||

 | CBNK Capital Bancorp, Inc. |
| Sector: Financials | |
| SubSector: Savings & Loans | |
| MarketCap: 174.93 Millions | |
| Recent Price: 19.79 Smart Investing & Trading Score: 42 | |
| Day Percent Change: 1.07% Day Change: 0.21 | |
| Week Change: 1.07% Year-to-date Change: -18.2% | |
| CBNK Links: Profile News Message Board | |
| Charts:- Daily , Weekly | |
| Add CBNK to Watchlist: View: Get Complete CBNK Trend Analysis ➞ | |
 | CERS Cerus Corporation |
| Sector: Health Care | |
| SubSector: Biotechnology | |
| MarketCap: 607.185 Millions | |
| Recent Price: 1.76 Smart Investing & Trading Score: 52 | |
| Day Percent Change: 3.22% Day Change: 0.05 | |
| Week Change: 3.22% Year-to-date Change: -18.3% | |
| CERS Links: Profile News Message Board | |
| Charts:- Daily , Weekly | |
| Add CERS to Watchlist: View: Get Complete CERS Trend Analysis ➞ | |
 | FBMS The First Bancshares, Inc. |
| Sector: Financials | |
| SubSector: Regional - Southeast Banks | |
| MarketCap: 359.535 Millions | |
| Recent Price: 23.97 Smart Investing & Trading Score: 42 | |
| Day Percent Change: 0.27% Day Change: 0.07 | |
| Week Change: 0.27% Year-to-date Change: -18.3% | |
| FBMS Links: Profile News Message Board | |
| Charts:- Daily , Weekly | |
| Add FBMS to Watchlist: View: Get Complete FBMS Trend Analysis ➞ | |
 | HLLY Holley Inc. |
| Sector: Services & Goods | |
| SubSector: Auto Parts | |
| MarketCap: 469 Millions | |
| Recent Price: 4.05 Smart Investing & Trading Score: 20 | |
| Day Percent Change: 1.38% Day Change: 0.05 | |
| Week Change: 1.38% Year-to-date Change: -18.3% | |
| HLLY Links: Profile News Message Board | |
| Charts:- Daily , Weekly | |
| Add HLLY to Watchlist: View: Get Complete HLLY Trend Analysis ➞ | |
 | AVAH Aveanna Healthcare Holdings Inc. |
| Sector: Health Care | |
| SubSector: Medical Care Facilities | |
| MarketCap: 305 Millions | |
| Recent Price: 2.20 Smart Investing & Trading Score: 10 | |
| Day Percent Change: 0.00% Day Change: 0.00 | |
| Week Change: 0% Year-to-date Change: -18.4% | |
| AVAH Links: Profile News Message Board | |
| Charts:- Daily , Weekly | |
| Add AVAH to Watchlist: View: Get Complete AVAH Trend Analysis ➞ | |
 | FENC Fennec Pharmaceuticals Inc. |
| Sector: Health Care | |
| SubSector: Biotechnology | |
| MarketCap: 126.785 Millions | |
| Recent Price: 9.15 Smart Investing & Trading Score: 32 | |
| Day Percent Change: -0.65% Day Change: -0.06 | |
| Week Change: -0.65% Year-to-date Change: -18.5% | |
| FENC Links: Profile News Message Board | |
| Charts:- Daily , Weekly | |
| Add FENC to Watchlist: View: Get Complete FENC Trend Analysis ➞ | |
 | CRCT Cricut, Inc. |
| Sector: Technology | |
| SubSector: Computer Hardware | |
| MarketCap: 2920 Millions | |
| Recent Price: 5.43 Smart Investing & Trading Score: 41 | |
| Day Percent Change: 0.74% Day Change: 0.04 | |
| Week Change: 0.74% Year-to-date Change: -18.7% | |
| CRCT Links: Profile News Message Board | |
| Charts:- Daily , Weekly | |
| Add CRCT to Watchlist: View: Get Complete CRCT Trend Analysis ➞ | |
 | INSM Insmed Incorporated |
| Sector: Health Care | |
| SubSector: Biotechnology | |
| MarketCap: 1452.45 Millions | |
| Recent Price: 25.20 Smart Investing & Trading Score: 27 | |
| Day Percent Change: 1.61% Day Change: 0.40 | |
| Week Change: 1.61% Year-to-date Change: -18.7% | |
| INSM Links: Profile News Message Board | |
| Charts:- Daily , Weekly | |
| Add INSM to Watchlist: View: Get Complete INSM Trend Analysis ➞ | |
 | IPAR Inter Parfums, Inc. |
| Sector: Consumer Staples | |
| SubSector: Personal Products | |
| MarketCap: 1302.55 Millions | |
| Recent Price: 117.11 Smart Investing & Trading Score: 0 | |
| Day Percent Change: -2.05% Day Change: -2.45 | |
| Week Change: -2.05% Year-to-date Change: -18.7% | |
| IPAR Links: Profile News Message Board | |
| Charts:- Daily , Weekly | |
| Add IPAR to Watchlist: View: Get Complete IPAR Trend Analysis ➞ | |
 | SMP Standard Motor Products, Inc. |
| Sector: Consumer Staples | |
| SubSector: Auto Parts | |
| MarketCap: 909.939 Millions | |
| Recent Price: 32.37 Smart Investing & Trading Score: 49 | |
| Day Percent Change: -0.28% Day Change: -0.09 | |
| Week Change: -0.28% Year-to-date Change: -18.7% | |
| SMP Links: Profile News Message Board | |
| Charts:- Daily , Weekly | |
| Add SMP to Watchlist: View: Get Complete SMP Trend Analysis ➞ | |
 | NG NovaGold Resources Inc. |
| Sector: Materials | |
| SubSector: Gold | |
| MarketCap: 2499.49 Millions | |
| Recent Price: 3.04 Smart Investing & Trading Score: 73 | |
| Day Percent Change: 3.40% Day Change: 0.10 | |
| Week Change: 3.4% Year-to-date Change: -18.7% | |
| NG Links: Profile News Message Board | |
| Charts:- Daily , Weekly | |
| Add NG to Watchlist: View: Get Complete NG Trend Analysis ➞ | |
 | PKBK Parke Bancorp, Inc. |
| Sector: Financials | |
| SubSector: Regional - Northeast Banks | |
| MarketCap: 165.799 Millions | |
| Recent Price: 16.46 Smart Investing & Trading Score: 32 | |
| Day Percent Change: 0.00% Day Change: 0.00 | |
| Week Change: 0% Year-to-date Change: -18.7% | |
| PKBK Links: Profile News Message Board | |
| Charts:- Daily , Weekly | |
| Add PKBK to Watchlist: View: Get Complete PKBK Trend Analysis ➞ | |
 | OVLY Oak Valley Bancorp |
| Sector: Financials | |
| SubSector: Regional - Pacific Banks | |
| MarketCap: 148.429 Millions | |
| Recent Price: 24.34 Smart Investing & Trading Score: 32 | |
| Day Percent Change: 0.00% Day Change: 0.00 | |
| Week Change: 0% Year-to-date Change: -18.7% | |
| OVLY Links: Profile News Message Board | |
| Charts:- Daily , Weekly | |
| Add OVLY to Watchlist: View: Get Complete OVLY Trend Analysis ➞ | |
 | HAFC Hanmi Financial Corporation |
| Sector: Financials | |
| SubSector: Regional - Pacific Banks | |
| MarketCap: 319.929 Millions | |
| Recent Price: 15.76 Smart Investing & Trading Score: 74 | |
| Day Percent Change: -0.38% Day Change: -0.06 | |
| Week Change: -0.38% Year-to-date Change: -18.8% | |
| HAFC Links: Profile News Message Board | |
| Charts:- Daily , Weekly | |
| Add HAFC to Watchlist: View: Get Complete HAFC Trend Analysis ➞ | |
 | DLTH Duluth Holdings Inc. |
| Sector: Services & Goods | |
| SubSector: Apparel Stores | |
| MarketCap: 180.008 Millions | |
| Recent Price: 4.37 Smart Investing & Trading Score: 59 | |
| Day Percent Change: -0.11% Day Change: 0.00 | |
| Week Change: -0.11% Year-to-date Change: -18.8% | |
| DLTH Links: Profile News Message Board | |
| Charts:- Daily , Weekly | |
| Add DLTH to Watchlist: View: Get Complete DLTH Trend Analysis ➞ | |
 | DVAX Dynavax Technologies Corporation |
| Sector: Health Care | |
| SubSector: Biotechnology | |
| MarketCap: 276.885 Millions | |
| Recent Price: 11.35 Smart Investing & Trading Score: 27 | |
| Day Percent Change: 1.25% Day Change: 0.14 | |
| Week Change: 1.25% Year-to-date Change: -18.8% | |
| DVAX Links: Profile News Message Board | |
| Charts:- Daily , Weekly | |
| Add DVAX to Watchlist: View: Get Complete DVAX Trend Analysis ➞ | |
 | CWH Camping World Holdings, Inc. |
| Sector: Financials | |
| SubSector: REIT - Office | |
| MarketCap: 473.566 Millions | |
| Recent Price: 21.32 Smart Investing & Trading Score: 17 | |
| Day Percent Change: -0.61% Day Change: -0.13 | |
| Week Change: -0.61% Year-to-date Change: -18.8% | |
| CWH Links: Profile News Message Board | |
| Charts:- Daily , Weekly | |
| Add CWH to Watchlist: View: Get Complete CWH Trend Analysis ➞ | |
 | HTBK Heritage Commerce Corp |
| Sector: Financials | |
| SubSector: Regional - Pacific Banks | |
| MarketCap: 416.129 Millions | |
| Recent Price: 8.05 Smart Investing & Trading Score: 42 | |
| Day Percent Change: 0.63% Day Change: 0.05 | |
| Week Change: 0.63% Year-to-date Change: -18.9% | |
| HTBK Links: Profile News Message Board | |
| Charts:- Daily , Weekly | |
| Add HTBK to Watchlist: View: Get Complete HTBK Trend Analysis ➞ | |
 | CIVB Civista Bancshares, Inc. |
| Sector: Financials | |
| SubSector: Regional - Pacific Banks | |
| MarketCap: 255.929 Millions | |
| Recent Price: 14.96 Smart Investing & Trading Score: 42 | |
| Day Percent Change: 0.74% Day Change: 0.11 | |
| Week Change: 0.74% Year-to-date Change: -18.9% | |
| CIVB Links: Profile News Message Board | |
| Charts:- Daily , Weekly | |
| Add CIVB to Watchlist: View: Get Complete CIVB Trend Analysis ➞ | |
 | TCBK TriCo Bancshares |
| Sector: Financials | |
| SubSector: Regional - Pacific Banks | |
| MarketCap: 875.129 Millions | |
| Recent Price: 34.85 Smart Investing & Trading Score: 47 | |
| Day Percent Change: 2.97% Day Change: 1.00 | |
| Week Change: 2.97% Year-to-date Change: -18.9% | |
| TCBK Links: Profile News Message Board | |
| Charts:- Daily , Weekly | |
| Add TCBK to Watchlist: View: Get Complete TCBK Trend Analysis ➞ | |
 | BRZE Braze, Inc. |
| Sector: Technology | |
| SubSector: Software - Application | |
| MarketCap: 4340 Millions | |
| Recent Price: 43.18 Smart Investing & Trading Score: 15 | |
| Day Percent Change: 3.50% Day Change: 1.46 | |
| Week Change: 3.5% Year-to-date Change: -18.9% | |
| BRZE Links: Profile News Message Board | |
| Charts:- Daily , Weekly | |
| Add BRZE to Watchlist: View: Get Complete BRZE Trend Analysis ➞ | |
 | NEWT Newtek Business Services Corp. |
| Sector: Services & Goods | |
| SubSector: Business Services | |
| MarketCap: 243.982 Millions | |
| Recent Price: 11.19 Smart Investing & Trading Score: 52 | |
| Day Percent Change: 1.73% Day Change: 0.19 | |
| Week Change: 1.73% Year-to-date Change: -18.9% | |
| NEWT Links: Profile News Message Board | |
| Charts:- Daily , Weekly | |
| Add NEWT to Watchlist: View: Get Complete NEWT Trend Analysis ➞ | |
 | PTSI P.A.M. Transportation Services, Inc. |
| Sector: Transports | |
| SubSector: Trucking | |
| MarketCap: 136.915 Millions | |
| Recent Price: 16.84 Smart Investing & Trading Score: 67 | |
| Day Percent Change: 0.00% Day Change: 0.00 | |
| Week Change: 0% Year-to-date Change: -19.0% | |
| PTSI Links: Profile News Message Board | |
| Charts:- Daily , Weekly | |
| Add PTSI to Watchlist: View: Get Complete PTSI Trend Analysis ➞ | |
 | MOND Mondee Holdings, Inc. |
| Sector: Services & Goods | |
| SubSector: Travel Services | |
| MarketCap: 744 Millions | |
| Recent Price: 2.25 Smart Investing & Trading Score: 15 | |
| Day Percent Change: 3.21% Day Change: 0.07 | |
| Week Change: 3.21% Year-to-date Change: -19.1% | |
| MOND Links: Profile News Message Board | |
| Charts:- Daily , Weekly | |
| Add MOND to Watchlist: View: Get Complete MOND Trend Analysis ➞ | |
 | CENTA Central Garden & Pet Company |
| Sector: Materials | |
| SubSector: Agricultural Chemicals | |
| MarketCap: 953 Millions | |
| Recent Price: 35.60 Smart Investing & Trading Score: 44 | |
| Day Percent Change: 0.18% Day Change: 0.06 | |
| Week Change: 0.18% Year-to-date Change: -19.2% | |
| CENTA Links: Profile News Message Board | |
| Charts:- Daily , Weekly | |
| Add CENTA to Watchlist: View: Get Complete CENTA Trend Analysis ➞ | |
| Too many stocks? View smallcap stocks filtered by marketcap & sector |
| Marketcap: All SmallCap Stocks (default-no microcap), Large, Mid-Range, Small & MicroCap |
| Sector: Tech, Finance, Energy, Staples, Retail, Industrial, Materials, Utilities & Medical |
|
Best Stocks Today 12Stocks.com |
© 2024 12Stocks.com Terms & Conditions Privacy Contact Us
All Information Provided Only For Education And Not To Be Used For Investing or Trading. See Terms & Conditions


One More Thing ... Get Best Stocks Delivered Daily!
Never Ever Miss A Move With Our Top Ten Stocks Lists
Find Best Stocks In Any Market - Bull or Bear Market
Take A Peek At Our Top Ten Stocks Lists: Daily, Weekly, Year-to-Date & Top Trends
Find Best Stocks In Any Market - Bull or Bear Market
Take A Peek At Our Top Ten Stocks Lists: Daily, Weekly, Year-to-Date & Top Trends
Smallcap Stocks With Best Up Trends [0-bearish to 100-bullish]: Bakkt [100], Deciphera [100], Phibro Animal[100], Heartland Financial[100], Sight Sciences[100], PTC [100], TPI Composites[100], Cullinan Oncology[100], Fulton Financial[100], Xencor [100], Richardson Electronics[100]
Best Smallcap Stocks Year-to-Date:
Janux [413.54%], Bakkt [355.16%], Viking [305.7%], Alpine Immune[239.57%], Longboard [237.23%], Super Micro[213.88%], Avidity Biosciences[175.17%], Arcutis Bio[170.43%], Cullinan Oncology[169.84%], Vera [164.02%], Hippo [137.76%] Best Smallcap Stocks This Week:
Deciphera [71.95%], Phibro Animal[28.32%], Vaxxinity [20.15%], Heartland Financial[18.56%], Janux [16.28%], Acrivon [16.08%], Velo3D [14.96%], MultiPlan [14.93%], Amprius [14.37%], Codexis [13.72%], ESS Tech[13.67%] Best Smallcap Stocks Daily:
Bakkt [2439.40%], Deciphera [71.95%], Phibro Animal[28.32%], Vaxxinity [20.15%], Heartland Financial[18.56%], Janux [16.28%], Acrivon [16.08%], Velo3D [14.96%], MultiPlan [14.93%], Amprius [14.37%], Codexis [13.72%]