
 Login Sign Up


| |||||
 |  | ||||

| 12Stocks.com Market Intelligence |
Best SmallCap Stocks
|
| In a hurry? Small Cap Stock Lists: Performance Trends Table, Stock Charts
Sort Small Cap stocks: Daily, Weekly, Year-to-Date, Market Cap & Trends. Filter Small Cap stocks list by sector: Show all, Tech, Finance, Energy, Staples, Retail, Industrial, Materials, Utilities and HealthCare Filter Small Cap stocks list by size: All Large Medium Small and MicroCap |
| 12Stocks.com Small Cap Stocks Performances & Trends Daily | |||||||||
|
|  The overall Smart Investing & Trading Score is 49 (0-bearish to 100-bullish) which puts Small Cap index in short term neutral trend. The Smart Investing & Trading Score from previous trading session is 14 and hence an improvement of trend.
| ||||||||
Here are the Smart Investing & Trading Scores of the most requested small cap stocks at 12Stocks.com (click stock name for detailed review):
|


| 12Stocks.com: Investing in Smallcap Index with Stocks | |
|
The following table helps investors and traders sort through current performance and trends (as measured by Smart Investing & Trading Score) of various
stocks in the Smallcap Index. Quick View: Move mouse or cursor over stock symbol (ticker) to view short-term technical chart and over stock name to view long term chart. Click on  to add stock symbol to your watchlist and to add stock symbol to your watchlist and  to view watchlist. Click on any ticker or stock name for detailed market intelligence report for that stock. to view watchlist. Click on any ticker or stock name for detailed market intelligence report for that stock. |
12Stocks.com Performance of Stocks in Smallcap Index
| Ticker | Stock Name | Watchlist | Category | Recent Price | Smart Investing & Trading Score | Change % | YTD Change% |
| BCO | Brink s |   | Services & Goods | 88.88 | 65 | 2.02% | 1.06% |
| UVSP | Univest Financial | | Financials | 22.25 | 100 | 1.04% | 1.00% |
| TCMD | Tactile Systems | | Health Care | 14.44 | 32 | 0.70% | 0.98% |
| SKT | Tanger Factory | | Financials | 27.99 | 39 | 2.04% | 0.97% |
| FFIN | First Financial | | Financials | 30.59 | 50 | 1.90% | 0.96% |
| PAGS | PagSeguro Digital | | Financials | 12.59 | 19 | 2.19% | 0.96% |
| PRA | ProAssurance | | Financials | 13.92 | 93 | 4.04% | 0.94% |
| VTS | Vitesse Energy | | Energy | 22.34 | 17 | 1.66% | 0.88% |
| TRNS | Transcat | | Technology | 110.25 | 33 | 2.56% | 0.84% |
| ONB | Old National | | Financials | 17.03 | 95 | 1.55% | 0.83% |
| THR | Thermon Group | | Industrials | 32.84 | 83 | 2.05% | 0.83% |
| CNDT | Conduent | | Technology | 3.68 | 100 | 5.44% | 0.82% |
| CTO | Consolidated-Tomoka Land | | Financials | 17.47 | 88 | 0.58% | 0.81% |
| DHX | DHI Group | | Services & Goods | 2.61 | 69 | 2.35% | 0.77% |
| EQBK | Equity Bancshares | | Financials | 34.14 | 90 | 1.94% | 0.71% |
| NSIT | Insight Enterprises | | Technology | 178.42 | 7 | 3.00% | 0.69% |
| DLX | Deluxe | | Services & Goods | 21.57 | 95 | 8.45% | 0.56% |
| AMWD | American Woodmark | | Consumer Staples | 93.37 | 24 | 0.35% | 0.56% |
| SP | SP Plus | | Services & Goods | 51.50 | 42 | -0.31% | 0.49% |
| CERE | Cerevel | | Health Care | 42.59 | 71 | -0.09% | 0.47% |
| MYGN | Myriad Genetics | | Services & Goods | 19.22 | 29 | -1.28% | 0.42% |
| MITK | Mitek Systems | | Technology | 13.09 | 51 | 4.89% | 0.38% |
| RRR | Red Rock | | Transports | 53.52 | 17 | 0.13% | 0.36% |
| HSII | Heidrick & Struggles | | Services & Goods | 29.63 | 10 | 0.82% | 0.34% |
| POR | Portland General | | Utilities | 43.48 | 95 | -1.00% | 0.32% |


| Too many stocks? View smallcap stocks filtered by marketcap & sector |
| Marketcap: All SmallCap Stocks (default-no microcap), Large, Mid-Range, Small |
| Smallcap Sector: Tech, Finance, Energy, Staples, Retail, Industrial, Materials, & Medical |
|
Get the most comprehensive stock market coverage daily at 12Stocks.com ➞ Best Stocks Today ➞ Best Stocks Weekly ➞ Best Stocks Year-to-Date ➞ Best Stocks Trends ➞  Best Stocks Today 12Stocks.com Best Nasdaq Stocks ➞ Best S&P 500 Stocks ➞ Best Tech Stocks ➞ Best Biotech Stocks ➞ |
| Detailed Overview of SmallCap Stocks |
| SmallCap Technical Overview, Leaders & Laggards, Top SmallCap ETF Funds & Detailed SmallCap Stocks List, Charts, Trends & More |
| Smallcap: Technical Analysis, Trends & YTD Performance | |
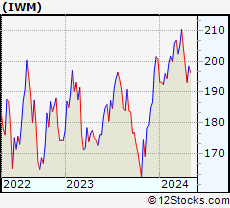
| SmallCap segment as represented by
IWM, an exchange-traded fund [ETF], holds basket of thousands of smallcap stocks from across all major sectors of the US stock market. The smallcap index (contains stocks like Riverbed & Sotheby's) is down by -0.39% and is currently underperforming the overall market by -6.01% year-to-date. Below is a quick view of technical charts and trends: | |
 IWM Weekly Chart |
|
| Long Term Trend: Not Good | |
| Medium Term Trend: Good | |
 IWM Daily Chart |
|
| Short Term Trend: Deteriorating | |
| Overall Trend Score: 49 | |
| YTD Performance: -0.39% | |
| **Trend Scores & Views Are Only For Educational Purposes And Not For Investing | |
| 12Stocks.com: Top Performing Small Cap Index Stocks | ||||||||||||||||||||||||||||||||||||||||||||||||
 The top performing Small Cap Index stocks year to date are
Now, more recently, over last week, the top performing Small Cap Index stocks on the move are


|
||||||||||||||||||||||||||||||||||||||||||||||||
| 12Stocks.com: Investing in Smallcap Index using Exchange Traded Funds | |
|
The following table shows list of key exchange traded funds (ETF) that
help investors track Smallcap index. The following list also includes leveraged ETF funds that track twice or thrice the daily returns of Smallcap indices. Short or inverse ETF funds move in the opposite direction to the index they track and are useful during market pullbacks or during bear markets. Quick View: Move mouse or cursor over ETF symbol (ticker) to view short-term technical chart and over ETF name to view long term chart. Click on ticker or stock name for detailed view. Click on to add stock symbol to your watchlist and to view watchlist. |
12Stocks.com List of ETFs that track Smallcap Index
| Ticker | ETF Name | Watchlist | Recent Price | Smart Investing & Trading Score | Change % | Week % | Year-to-date % |
| IWM | iShares Russell 2000 | | 199.92 | 49 | 1.84 | 0.77 | -0.39% |
| IJR | iShares Core S&P Small-Cap | | 106.33 | 50 | 1.52 | 0.64 | -1.77% |
| VTWO | Vanguard Russell 2000 ETF | | 80.85 | 7 | 1.88 | 0.79 | -0.31% |
| IWN | iShares Russell 2000 Value | | 152.88 | 57 | 2.04 | 1.15 | -1.58% |
| IWO | iShares Russell 2000 Growth | | 254.34 | 17 | 1.91 | 0.49 | 0.84% |
| IJS | iShares S&P Small-Cap 600 Value | | 98.02 | 13 | 1.68 | 0.85 | -4.9% |
| IJT | iShares S&P Small-Cap 600 Growth | | 126.72 | 20 | 1.42 | 0.5 | 1.26% |
| XSLV | PowerShares S&P SmallCap Low Volatil ETF | | 43.14 | 42 | 0.72 | 0.98 | -2.29% |
| SDD | ProShares UltraShort SmallCap600 | | 19.31 | 61 | -2.02 | -0.21 | 4.79% |
| SMLV | SPDR SSGA US Small Cap Low Volatil ETF | | 108.83 | 44 | 1.30 | 1.22 | -3.27% |
| SAA | ProShares Ultra SmallCap600 | | 22.93 | 32 | 1.56 | -0.46 | -8.08% |
| SBB | ProShares Short SmallCap600 | | 16.37 | 71 | -1.14 | -0.09 | 2.76% |
| 12Stocks.com: Charts, Trends, Fundamental Data and Performances of SmallCap Stocks | |
|
We now take in-depth look at all SmallCap stocks including charts, multi-period performances and overall trends (as measured by Smart Investing & Trading Score). One can sort SmallCap stocks (click link to choose) by Daily, Weekly and by Year-to-Date performances. Also, one can sort by size of the company or by market capitalization. |
| Select Your Default Chart Type: | |||||
| |||||
| Click on stock symbol or name for detailed view. Click on to add stock symbol to your watchlist and to view watchlist. Quick View: Move mouse or cursor over "Daily" to quickly view daily technical stock chart and over "Weekly" to view weekly technical stock chart. | |||||

 | BCO The Brink s Company |
| Sector: Services & Goods | |
| SubSector: Security & Protection Services | |
| MarketCap: 2544.73 Millions | |
| Recent Price: 88.88 Smart Investing & Trading Score: 65 | |
| Day Percent Change: 2.02% Day Change: 1.76 | |
| Week Change: 0.17% Year-to-date Change: 1.1% | |
| BCO Links: Profile News Message Board | |
| Charts:- Daily , Weekly | |
| Add BCO to Watchlist: View: Get Complete BCO Trend Analysis ➞ | |
 | UVSP Univest Financial Corporation |
| Sector: Financials | |
| SubSector: Regional - Northeast Banks | |
| MarketCap: 467.999 Millions | |
| Recent Price: 22.25 Smart Investing & Trading Score: 100 | |
| Day Percent Change: 1.04% Day Change: 0.23 | |
| Week Change: 4.8% Year-to-date Change: 1.0% | |
| UVSP Links: Profile News Message Board | |
| Charts:- Daily , Weekly | |
| Add UVSP to Watchlist: View: Get Complete UVSP Trend Analysis ➞ | |
 | TCMD Tactile Systems Technology, Inc. |
| Sector: Health Care | |
| SubSector: Medical Instruments & Supplies | |
| MarketCap: 655.96 Millions | |
| Recent Price: 14.44 Smart Investing & Trading Score: 32 | |
| Day Percent Change: 0.70% Day Change: 0.10 | |
| Week Change: 0.98% Year-to-date Change: 1.0% | |
| TCMD Links: Profile News Message Board | |
| Charts:- Daily , Weekly | |
| Add TCMD to Watchlist: View: Get Complete TCMD Trend Analysis ➞ | |
 | SKT Tanger Factory Outlet Centers, Inc. |
| Sector: Financials | |
| SubSector: REIT - Retail | |
| MarketCap: 720.214 Millions | |
| Recent Price: 27.99 Smart Investing & Trading Score: 39 | |
| Day Percent Change: 2.04% Day Change: 0.56 | |
| Week Change: -3.08% Year-to-date Change: 1.0% | |
| SKT Links: Profile News Message Board | |
| Charts:- Daily , Weekly | |
| Add SKT to Watchlist: View: Get Complete SKT Trend Analysis ➞ | |
 | FFIN First Financial Bankshares, Inc. |
| Sector: Financials | |
| SubSector: Regional - Southwest Banks | |
| MarketCap: 3503.75 Millions | |
| Recent Price: 30.59 Smart Investing & Trading Score: 50 | |
| Day Percent Change: 1.90% Day Change: 0.57 | |
| Week Change: 0.76% Year-to-date Change: 1.0% | |
| FFIN Links: Profile News Message Board | |
| Charts:- Daily , Weekly | |
| Add FFIN to Watchlist: View: Get Complete FFIN Trend Analysis ➞ | |
 | PAGS PagSeguro Digital Ltd. |
| Sector: Financials | |
| SubSector: Credit Services | |
| MarketCap: 6500.78 Millions | |
| Recent Price: 12.59 Smart Investing & Trading Score: 19 | |
| Day Percent Change: 2.19% Day Change: 0.27 | |
| Week Change: -0.71% Year-to-date Change: 1.0% | |
| PAGS Links: Profile News Message Board | |
| Charts:- Daily , Weekly | |
| Add PAGS to Watchlist: View: Get Complete PAGS Trend Analysis ➞ | |
 | PRA ProAssurance Corporation |
| Sector: Financials | |
| SubSector: Accident & Health Insurance | |
| MarketCap: 1434.6 Millions | |
| Recent Price: 13.92 Smart Investing & Trading Score: 93 | |
| Day Percent Change: 4.04% Day Change: 0.54 | |
| Week Change: 5.69% Year-to-date Change: 0.9% | |
| PRA Links: Profile News Message Board | |
| Charts:- Daily , Weekly | |
| Add PRA to Watchlist: View: Get Complete PRA Trend Analysis ➞ | |
 | VTS Vitesse Energy, Inc. |
| Sector: Energy | |
| SubSector: Oil & Gas E&P | |
| MarketCap: 639 Millions | |
| Recent Price: 22.34 Smart Investing & Trading Score: 17 | |
| Day Percent Change: 1.66% Day Change: 0.37 | |
| Week Change: -2.64% Year-to-date Change: 0.9% | |
| VTS Links: Profile News Message Board | |
| Charts:- Daily , Weekly | |
| Add VTS to Watchlist: View: Get Complete VTS Trend Analysis ➞ | |
 | TRNS Transcat, Inc. |
| Sector: Technology | |
| SubSector: Scientific & Technical Instruments | |
| MarketCap: 216.653 Millions | |
| Recent Price: 110.25 Smart Investing & Trading Score: 33 | |
| Day Percent Change: 2.56% Day Change: 2.75 | |
| Week Change: 0.38% Year-to-date Change: 0.8% | |
| TRNS Links: Profile News Message Board | |
| Charts:- Daily , Weekly | |
| Add TRNS to Watchlist: View: Get Complete TRNS Trend Analysis ➞ | |
 | ONB Old National Bancorp |
| Sector: Financials | |
| SubSector: Regional - Midwest Banks | |
| MarketCap: 2340.8 Millions | |
| Recent Price: 17.03 Smart Investing & Trading Score: 95 | |
| Day Percent Change: 1.55% Day Change: 0.26 | |
| Week Change: 2.78% Year-to-date Change: 0.8% | |
| ONB Links: Profile News Message Board | |
| Charts:- Daily , Weekly | |
| Add ONB to Watchlist: View: Get Complete ONB Trend Analysis ➞ | |
 | THR Thermon Group Holdings, Inc. |
| Sector: Industrials | |
| SubSector: Diversified Machinery | |
| MarketCap: 492.816 Millions | |
| Recent Price: 32.84 Smart Investing & Trading Score: 83 | |
| Day Percent Change: 2.05% Day Change: 0.66 | |
| Week Change: 3.17% Year-to-date Change: 0.8% | |
| THR Links: Profile News Message Board | |
| Charts:- Daily , Weekly | |
| Add THR to Watchlist: View: Get Complete THR Trend Analysis ➞ | |
 | CNDT Conduent Incorporated |
| Sector: Technology | |
| SubSector: Information Technology Services | |
| MarketCap: 514.968 Millions | |
| Recent Price: 3.68 Smart Investing & Trading Score: 100 | |
| Day Percent Change: 5.44% Day Change: 0.19 | |
| Week Change: 20.26% Year-to-date Change: 0.8% | |
| CNDT Links: Profile News Message Board | |
| Charts:- Daily , Weekly | |
| Add CNDT to Watchlist: View: Get Complete CNDT Trend Analysis ➞ | |
 | CTO Consolidated-Tomoka Land Co. |
| Sector: Financials | |
| SubSector: Real Estate Development | |
| MarketCap: 205.119 Millions | |
| Recent Price: 17.47 Smart Investing & Trading Score: 88 | |
| Day Percent Change: 0.58% Day Change: 0.10 | |
| Week Change: 1.98% Year-to-date Change: 0.8% | |
| CTO Links: Profile News Message Board | |
| Charts:- Daily , Weekly | |
| Add CTO to Watchlist: View: Get Complete CTO Trend Analysis ➞ | |
 | DHX DHI Group, Inc. |
| Sector: Services & Goods | |
| SubSector: Staffing & Outsourcing Services | |
| MarketCap: 144.728 Millions | |
| Recent Price: 2.61 Smart Investing & Trading Score: 69 | |
| Day Percent Change: 2.35% Day Change: 0.06 | |
| Week Change: 2.76% Year-to-date Change: 0.8% | |
| DHX Links: Profile News Message Board | |
| Charts:- Daily , Weekly | |
| Add DHX to Watchlist: View: Get Complete DHX Trend Analysis ➞ | |
 | EQBK Equity Bancshares, Inc. |
| Sector: Financials | |
| SubSector: Regional - Midwest Banks | |
| MarketCap: 272.87 Millions | |
| Recent Price: 34.14 Smart Investing & Trading Score: 90 | |
| Day Percent Change: 1.94% Day Change: 0.65 | |
| Week Change: 2.49% Year-to-date Change: 0.7% | |
| EQBK Links: Profile News Message Board | |
| Charts:- Daily , Weekly | |
| Add EQBK to Watchlist: View: Get Complete EQBK Trend Analysis ➞ | |
 | NSIT Insight Enterprises, Inc. |
| Sector: Technology | |
| SubSector: Information Technology Services | |
| MarketCap: 1498.48 Millions | |
| Recent Price: 178.42 Smart Investing & Trading Score: 7 | |
| Day Percent Change: 3.00% Day Change: 5.20 | |
| Week Change: -2.37% Year-to-date Change: 0.7% | |
| NSIT Links: Profile News Message Board | |
| Charts:- Daily , Weekly | |
| Add NSIT to Watchlist: View: Get Complete NSIT Trend Analysis ➞ | |
 | DLX Deluxe Corporation |
| Sector: Services & Goods | |
| SubSector: Business Services | |
| MarketCap: 1025.82 Millions | |
| Recent Price: 21.57 Smart Investing & Trading Score: 95 | |
| Day Percent Change: 8.45% Day Change: 1.68 | |
| Week Change: 6% Year-to-date Change: 0.6% | |
| DLX Links: Profile News Message Board | |
| Charts:- Daily , Weekly | |
| Add DLX to Watchlist: View: Get Complete DLX Trend Analysis ➞ | |
 | AMWD American Woodmark Corporation |
| Sector: Consumer Staples | |
| SubSector: Home Furnishings & Fixtures | |
| MarketCap: 958.435 Millions | |
| Recent Price: 93.37 Smart Investing & Trading Score: 24 | |
| Day Percent Change: 0.35% Day Change: 0.33 | |
| Week Change: 0.48% Year-to-date Change: 0.6% | |
| AMWD Links: Profile News Message Board | |
| Charts:- Daily , Weekly | |
| Add AMWD to Watchlist: View: Get Complete AMWD Trend Analysis ➞ | |
 | SP SP Plus Corporation |
| Sector: Services & Goods | |
| SubSector: Management Services | |
| MarketCap: 494.545 Millions | |
| Recent Price: 51.50 Smart Investing & Trading Score: 42 | |
| Day Percent Change: -0.31% Day Change: -0.16 | |
| Week Change: 0.68% Year-to-date Change: 0.5% | |
| SP Links: Profile News Message Board | |
| Charts:- Daily , Weekly | |
| Add SP to Watchlist: View: Get Complete SP Trend Analysis ➞ | |
 | CERE Cerevel Therapeutics Holdings, Inc. |
| Sector: Health Care | |
| SubSector: Biotechnology | |
| MarketCap: 21587 Millions | |
| Recent Price: 42.59 Smart Investing & Trading Score: 71 | |
| Day Percent Change: -0.09% Day Change: -0.04 | |
| Week Change: 0.28% Year-to-date Change: 0.5% | |
| CERE Links: Profile News Message Board | |
| Charts:- Daily , Weekly | |
| Add CERE to Watchlist: View: Get Complete CERE Trend Analysis ➞ | |
 | MYGN Myriad Genetics, Inc. |
| Sector: Services & Goods | |
| SubSector: Research Services | |
| MarketCap: 1051.94 Millions | |
| Recent Price: 19.22 Smart Investing & Trading Score: 29 | |
| Day Percent Change: -1.28% Day Change: -0.25 | |
| Week Change: 5.72% Year-to-date Change: 0.4% | |
| MYGN Links: Profile News Message Board | |
| Charts:- Daily , Weekly | |
| Add MYGN to Watchlist: View: Get Complete MYGN Trend Analysis ➞ | |
 | MITK Mitek Systems, Inc. |
| Sector: Technology | |
| SubSector: Application Software | |
| MarketCap: 265.962 Millions | |
| Recent Price: 13.09 Smart Investing & Trading Score: 51 | |
| Day Percent Change: 4.89% Day Change: 0.61 | |
| Week Change: 3.07% Year-to-date Change: 0.4% | |
| MITK Links: Profile News Message Board | |
| Charts:- Daily , Weekly | |
| Add MITK to Watchlist: View: Get Complete MITK Trend Analysis ➞ | |
 | RRR Red Rock Resorts, Inc. |
| Sector: Transports | |
| SubSector: Rental & Leasing Services | |
| MarketCap: 1144.04 Millions | |
| Recent Price: 53.52 Smart Investing & Trading Score: 17 | |
| Day Percent Change: 0.13% Day Change: 0.07 | |
| Week Change: -1.11% Year-to-date Change: 0.4% | |
| RRR Links: Profile News Message Board | |
| Charts:- Daily , Weekly | |
| Add RRR to Watchlist: View: Get Complete RRR Trend Analysis ➞ | |
 | HSII Heidrick & Struggles International, Inc. |
| Sector: Services & Goods | |
| SubSector: Staffing & Outsourcing Services | |
| MarketCap: 431.428 Millions | |
| Recent Price: 29.63 Smart Investing & Trading Score: 10 | |
| Day Percent Change: 0.82% Day Change: 0.24 | |
| Week Change: -2.08% Year-to-date Change: 0.3% | |
| HSII Links: Profile News Message Board | |
| Charts:- Daily , Weekly | |
| Add HSII to Watchlist: View: Get Complete HSII Trend Analysis ➞ | |
 | POR Portland General Electric Company |
| Sector: Utilities | |
| SubSector: Electric Utilities | |
| MarketCap: 4291.84 Millions | |
| Recent Price: 43.48 Smart Investing & Trading Score: 95 | |
| Day Percent Change: -1.00% Day Change: -0.44 | |
| Week Change: 1.59% Year-to-date Change: 0.3% | |
| POR Links: Profile News Message Board | |
| Charts:- Daily , Weekly | |
| Add POR to Watchlist: View: Get Complete POR Trend Analysis ➞ | |
| Too many stocks? View smallcap stocks filtered by marketcap & sector |
| Marketcap: All SmallCap Stocks (default-no microcap), Large, Mid-Range, Small & MicroCap |
| Sector: Tech, Finance, Energy, Staples, Retail, Industrial, Materials, Utilities & Medical |
|
Best Stocks Today 12Stocks.com |
© 2024 12Stocks.com Terms & Conditions Privacy Contact Us
All Information Provided Only For Education And Not To Be Used For Investing or Trading. See Terms & Conditions


One More Thing ... Get Best Stocks Delivered Daily!
Never Ever Miss A Move With Our Top Ten Stocks Lists
Find Best Stocks In Any Market - Bull or Bear Market
Take A Peek At Our Top Ten Stocks Lists: Daily, Weekly, Year-to-Date & Top Trends
Find Best Stocks In Any Market - Bull or Bear Market
Take A Peek At Our Top Ten Stocks Lists: Daily, Weekly, Year-to-Date & Top Trends
Smallcap Stocks With Best Up Trends [0-bearish to 100-bullish]: Emergent BioSolutions[100], Aspen Aerogels[100], Perdoceo Education[100], Gannett Co[100], Pitney Bowes[100], Benchmark Electronics[100], Origin Materials[100], FormFactor [100], Lantheus [100], Q2 [100], Blueprint Medicines[100]
Best Smallcap Stocks Year-to-Date:
Janux [440.16%], Viking [307.09%], Longboard [273.98%], Alpine Immune[239.23%], Bakkt [187.89%], Avidity Biosciences[182.96%], Vera [170.74%], Cullinan Oncology[169.74%], Super Micro[168.25%], Arcutis Bio[166.25%], Y-mAbs [152.93%] Best Smallcap Stocks This Week:
Deciphera [73.24%], Emergent BioSolutions[71.88%], Eyenovia [48.36%], Aspen Aerogels[48.14%], P3 Health[38.51%], Carvana Co[38.18%], Cue Biopharma[37.73%], Origin Materials[36.24%], TransMedics Group[35.14%], Seres [34.55%], Enovix [32.07%] Best Smallcap Stocks Daily:
Emergent BioSolutions[70.98%], Aspen Aerogels[56.70%], Carvana Co[33.77%], Perdoceo Education[31.46%], Enovix [31.06%], Office Properties[28.00%], Gannett Co[26.97%], Sunnova Energy[25.21%], Pitney Bowes[24.70%], Pulmonx [21.37%], CommScope Holding[20.95%]