
 Login Sign Up


| |||||
 |  | ||||

| 12Stocks.com Market Intelligence |
Best SmallCap Stocks
|
| In a hurry? Small Cap Stock Lists: Performance Trends Table, Stock Charts
Sort Small Cap stocks: Daily, Weekly, Year-to-Date, Market Cap & Trends. Filter Small Cap stocks list by sector: Show all, Tech, Finance, Energy, Staples, Retail, Industrial, Materials, Utilities and HealthCare Filter Small Cap stocks list by size: All Large Medium Small and MicroCap |
| 12Stocks.com Small Cap Stocks Performances & Trends Daily | |||||||||
|
|  The overall Smart Investing & Trading Score is 69 (0-bearish to 100-bullish) which puts Small Cap index in short term neutral to bullish trend. The Smart Investing & Trading Score from previous trading session is 49 and hence an improvement of trend.
| ||||||||
Here are the Smart Investing & Trading Scores of the most requested small cap stocks at 12Stocks.com (click stock name for detailed review):
|


| 12Stocks.com: Investing in Smallcap Index with Stocks | |
|
The following table helps investors and traders sort through current performance and trends (as measured by Smart Investing & Trading Score) of various
stocks in the Smallcap Index. Quick View: Move mouse or cursor over stock symbol (ticker) to view short-term technical chart and over stock name to view long term chart. Click on  to add stock symbol to your watchlist and to add stock symbol to your watchlist and  to view watchlist. Click on any ticker or stock name for detailed market intelligence report for that stock. to view watchlist. Click on any ticker or stock name for detailed market intelligence report for that stock. |
12Stocks.com Performance of Stocks in Smallcap Index
| Ticker | Stock Name | Watchlist | Category | Recent Price | Smart Investing & Trading Score | Change % | YTD Change% |
| HOPE | Hope Bancorp |   | Financials | 10.84 | 67 | 2.17% | -10.26% |
| AMSWA | American | | Technology | 10.13 | 35 | 0.70% | -10.35% |
| PRTH | Priority | | Industrials | 3.19 | 39 | -0.31% | -10.39% |
| ROG | Rogers | | Technology | 118.33 | 76 | -1.39% | -10.40% |
| CURV | Torrid | | Services & Goods | 5.24 | 90 | 0.19% | -10.43% |
| PECO | Phillips Edison | | Financials | 32.97 | 43 | -0.75% | -10.48% |
| BOWL | Bowlero | | Services & Goods | 12.63 | 100 | 4.77% | -10.55% |
| LAND | Gladstone Land | | Financials | 12.92 | 60 | -0.69% | -10.59% |
| SRDX | Surmodics | | Health Care | 32.49 | 93 | -5.96% | -10.62% |
| RNST | Renasant | | Financials | 30.09 | 69 | -0.03% | -10.66% |
| WISH | ContextLogic | | Services & Goods | 5.31 | 20 | -3.28% | -10.68% |
| STRO | Sutro Biopharma | | Health Care | 3.83 | 39 | -2.79% | -10.72% |
| HEES | H&E Equipment | | Transports | 46.65 | 17 | -0.85% | -10.84% |
| BHB | Bar Harbor | | Financials | 26.15 | 100 | 0.50% | -10.93% |
| ORA | Ormat | | Utilities | 67.50 | 100 | 1.18% | -10.94% |
| GOGO | Gogo | | Technology | 9.02 | 76 | -0.99% | -10.96% |
| AURA | Aura Biosciences | | Health Care | 7.88 | 64 | 4.93% | -10.96% |
| AMBC | Ambac Financial | | Financials | 14.67 | 32 | -1.48% | -10.98% |
| OCFC | OceanFirst Financial | | Financials | 15.45 | 93 | -0.19% | -11.00% |
| BKU | BankUnited | | Financials | 28.85 | 100 | 0.28% | -11.04% |
| HTH | Hilltop | | Financials | 31.32 | 100 | 1.92% | -11.05% |
| CBL | CBL & Associates Properties | | Financials | 21.71 | 45 | 0.65% | -11.10% |
| WRBY | Warby Parker | | Health Care | 12.54 | 37 | 2.16% | -11.10% |
| VRA | Vera Bradley | | Consumer Staples | 6.84 | 59 | -1.87% | -11.17% |
| PEBO | Peoples Bancorp | | Financials | 29.98 | 83 | -0.07% | -11.20% |


| Too many stocks? View smallcap stocks filtered by marketcap & sector |
| Marketcap: All SmallCap Stocks (default-no microcap), Large, Mid-Range, Small |
| Smallcap Sector: Tech, Finance, Energy, Staples, Retail, Industrial, Materials, & Medical |
|
Get the most comprehensive stock market coverage daily at 12Stocks.com ➞ Best Stocks Today ➞ Best Stocks Weekly ➞ Best Stocks Year-to-Date ➞ Best Stocks Trends ➞  Best Stocks Today 12Stocks.com Best Nasdaq Stocks ➞ Best S&P 500 Stocks ➞ Best Tech Stocks ➞ Best Biotech Stocks ➞ |
| Detailed Overview of SmallCap Stocks |
| SmallCap Technical Overview, Leaders & Laggards, Top SmallCap ETF Funds & Detailed SmallCap Stocks List, Charts, Trends & More |
| Smallcap: Technical Analysis, Trends & YTD Performance | |
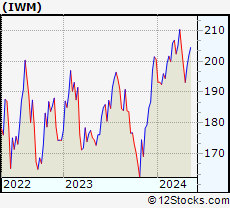
| SmallCap segment as represented by
IWM, an exchange-traded fund [ETF], holds basket of thousands of smallcap stocks from across all major sectors of the US stock market. The smallcap index (contains stocks like Riverbed & Sotheby's) is up by 0.59% and is currently underperforming the overall market by -6.29% year-to-date. Below is a quick view of technical charts and trends: | |
 IWM Weekly Chart |
|
| Long Term Trend: Not Good | |
| Medium Term Trend: Very Good | |
 IWM Daily Chart |
|
| Short Term Trend: Very Good | |
| Overall Trend Score: 69 | |
| YTD Performance: 0.59% | |
| **Trend Scores & Views Are Only For Educational Purposes And Not For Investing | |
| 12Stocks.com: Top Performing Small Cap Index Stocks | ||||||||||||||||||||||||||||||||||||||||||||||||
 The top performing Small Cap Index stocks year to date are
Now, more recently, over last week, the top performing Small Cap Index stocks on the move are


|
||||||||||||||||||||||||||||||||||||||||||||||||
| 12Stocks.com: Investing in Smallcap Index using Exchange Traded Funds | |
|
The following table shows list of key exchange traded funds (ETF) that
help investors track Smallcap index. The following list also includes leveraged ETF funds that track twice or thrice the daily returns of Smallcap indices. Short or inverse ETF funds move in the opposite direction to the index they track and are useful during market pullbacks or during bear markets. Quick View: Move mouse or cursor over ETF symbol (ticker) to view short-term technical chart and over ETF name to view long term chart. Click on ticker or stock name for detailed view. Click on to add stock symbol to your watchlist and to view watchlist. |
12Stocks.com List of ETFs that track Smallcap Index
| Ticker | ETF Name | Watchlist | Recent Price | Smart Investing & Trading Score | Change % | Week % | Year-to-date % |
| IWM | iShares Russell 2000 | | 201.90 | 69 | 0.99 | 1.77 | 0.59% |
| IJR | iShares Core S&P Small-Cap | | 107.13 | 82 | 0.75 | 1.4 | -1.03% |
| VTWO | Vanguard Russell 2000 ETF | | 81.61 | 69 | 0.94 | 1.73 | 0.63% |
| IWN | iShares Russell 2000 Value | | 154.21 | 100 | 0.87 | 2.03 | -0.72% |
| IJS | iShares S&P Small-Cap 600 Value | | 98.72 | 64 | 0.71 | 1.57 | -4.22% |
| IWO | iShares Russell 2000 Growth | | 256.87 | 57 | 0.99 | 1.49 | 1.84% |
| IJT | iShares S&P Small-Cap 600 Growth | | 127.76 | 95 | 0.82 | 1.32 | 2.09% |
| XSLV | PowerShares S&P SmallCap Low Volatil ETF | | 43.22 | 87 | 0.19 | 1.17 | -2.11% |
| SBB | ProShares Short SmallCap600 | | 16.16 | 13 | -1.28 | -1.37 | 1.44% |
| SDD | ProShares UltraShort SmallCap600 | | 18.84 | 23 | -2.41 | -2.61 | 2.27% |
| SAA | ProShares Ultra SmallCap600 | | 23.59 | 69 | 2.86 | 2.39 | -5.45% |
| SMLV | SPDR SSGA US Small Cap Low Volatil ETF | | 109.69 | 87 | 0.78 | 2.01 | -2.52% |
| 12Stocks.com: Charts, Trends, Fundamental Data and Performances of SmallCap Stocks | |
|
We now take in-depth look at all SmallCap stocks including charts, multi-period performances and overall trends (as measured by Smart Investing & Trading Score). One can sort SmallCap stocks (click link to choose) by Daily, Weekly and by Year-to-Date performances. Also, one can sort by size of the company or by market capitalization. |
| Select Your Default Chart Type: | |||||
| |||||
| Click on stock symbol or name for detailed view. Click on to add stock symbol to your watchlist and to view watchlist. Quick View: Move mouse or cursor over "Daily" to quickly view daily technical stock chart and over "Weekly" to view weekly technical stock chart. | |||||

 | HOPE Hope Bancorp, Inc. |
| Sector: Financials | |
| SubSector: Regional - Pacific Banks | |
| MarketCap: 1099.29 Millions | |
| Recent Price: 10.84 Smart Investing & Trading Score: 67 | |
| Day Percent Change: 2.17% Day Change: 0.23 | |
| Week Change: -1.09% Year-to-date Change: -10.3% | |
| HOPE Links: Profile News Message Board | |
| Charts:- Daily , Weekly | |
| Add HOPE to Watchlist: View: Get Complete HOPE Trend Analysis ➞ | |
 | AMSWA American Software, Inc. |
| Sector: Technology | |
| SubSector: Application Software | |
| MarketCap: 389.862 Millions | |
| Recent Price: 10.13 Smart Investing & Trading Score: 35 | |
| Day Percent Change: 0.70% Day Change: 0.07 | |
| Week Change: -0.88% Year-to-date Change: -10.4% | |
| AMSWA Links: Profile News Message Board | |
| Charts:- Daily , Weekly | |
| Add AMSWA to Watchlist: View: Get Complete AMSWA Trend Analysis ➞ | |
 | PRTH Priority Technology Holdings, Inc. |
| Sector: Industrials | |
| SubSector: Conglomerates | |
| MarketCap: 116.548 Millions | |
| Recent Price: 3.19 Smart Investing & Trading Score: 39 | |
| Day Percent Change: -0.31% Day Change: -0.01 | |
| Week Change: 0.79% Year-to-date Change: -10.4% | |
| PRTH Links: Profile News Message Board | |
| Charts:- Daily , Weekly | |
| Add PRTH to Watchlist: View: Get Complete PRTH Trend Analysis ➞ | |
 | ROG Rogers Corporation |
| Sector: Technology | |
| SubSector: Diversified Electronics | |
| MarketCap: 1756.36 Millions | |
| Recent Price: 118.33 Smart Investing & Trading Score: 76 | |
| Day Percent Change: -1.39% Day Change: -1.67 | |
| Week Change: -2.23% Year-to-date Change: -10.4% | |
| ROG Links: Profile News Message Board | |
| Charts:- Daily , Weekly | |
| Add ROG to Watchlist: View: Get Complete ROG Trend Analysis ➞ | |
 | CURV Torrid Holdings Inc. |
| Sector: Services & Goods | |
| SubSector: Apparel Retail | |
| MarketCap: 278 Millions | |
| Recent Price: 5.24 Smart Investing & Trading Score: 90 | |
| Day Percent Change: 0.19% Day Change: 0.01 | |
| Week Change: 4.8% Year-to-date Change: -10.4% | |
| CURV Links: Profile News Message Board | |
| Charts:- Daily , Weekly | |
| Add CURV to Watchlist: View: Get Complete CURV Trend Analysis ➞ | |
 | PECO Phillips Edison & Company, Inc. |
| Sector: Financials | |
| SubSector: REIT - Retail | |
| MarketCap: 3920 Millions | |
| Recent Price: 32.97 Smart Investing & Trading Score: 43 | |
| Day Percent Change: -0.75% Day Change: -0.25 | |
| Week Change: 1.1% Year-to-date Change: -10.5% | |
| PECO Links: Profile News Message Board | |
| Charts:- Daily , Weekly | |
| Add PECO to Watchlist: View: Get Complete PECO Trend Analysis ➞ | |
 | BOWL Bowlero Corp. |
| Sector: Services & Goods | |
| SubSector: Leisure | |
| MarketCap: 2000 Millions | |
| Recent Price: 12.63 Smart Investing & Trading Score: 100 | |
| Day Percent Change: 4.77% Day Change: 0.58 | |
| Week Change: 7.86% Year-to-date Change: -10.6% | |
| BOWL Links: Profile News Message Board | |
| Charts:- Daily , Weekly | |
| Add BOWL to Watchlist: View: Get Complete BOWL Trend Analysis ➞ | |
 | LAND Gladstone Land Corporation |
| Sector: Financials | |
| SubSector: REIT - Diversified | |
| MarketCap: 252.653 Millions | |
| Recent Price: 12.92 Smart Investing & Trading Score: 60 | |
| Day Percent Change: -0.69% Day Change: -0.09 | |
| Week Change: 1.89% Year-to-date Change: -10.6% | |
| LAND Links: Profile News Message Board | |
| Charts:- Daily , Weekly | |
| Add LAND to Watchlist: View: Get Complete LAND Trend Analysis ➞ | |
 | SRDX Surmodics, Inc. |
| Sector: Health Care | |
| SubSector: Diagnostic Substances | |
| MarketCap: 388.171 Millions | |
| Recent Price: 32.49 Smart Investing & Trading Score: 93 | |
| Day Percent Change: -5.96% Day Change: -2.06 | |
| Week Change: 24.15% Year-to-date Change: -10.6% | |
| SRDX Links: Profile News Message Board | |
| Charts:- Daily , Weekly | |
| Add SRDX to Watchlist: View: Get Complete SRDX Trend Analysis ➞ | |
 | RNST Renasant Corporation |
| Sector: Financials | |
| SubSector: Money Center Banks | |
| MarketCap: 1279.39 Millions | |
| Recent Price: 30.09 Smart Investing & Trading Score: 69 | |
| Day Percent Change: -0.03% Day Change: -0.01 | |
| Week Change: 0.8% Year-to-date Change: -10.7% | |
| RNST Links: Profile News Message Board | |
| Charts:- Daily , Weekly | |
| Add RNST to Watchlist: View: Get Complete RNST Trend Analysis ➞ | |
 | WISH ContextLogic Inc. |
| Sector: Services & Goods | |
| SubSector: Internet Retail | |
| MarketCap: 165 Millions | |
| Recent Price: 5.31 Smart Investing & Trading Score: 20 | |
| Day Percent Change: -3.28% Day Change: -0.18 | |
| Week Change: -8.13% Year-to-date Change: -10.7% | |
| WISH Links: Profile News Message Board | |
| Charts:- Daily , Weekly | |
| Add WISH to Watchlist: View: Get Complete WISH Trend Analysis ➞ | |
 | STRO Sutro Biopharma, Inc. |
| Sector: Health Care | |
| SubSector: Biotechnology | |
| MarketCap: 196.485 Millions | |
| Recent Price: 3.83 Smart Investing & Trading Score: 39 | |
| Day Percent Change: -2.79% Day Change: -0.11 | |
| Week Change: 11.99% Year-to-date Change: -10.7% | |
| STRO Links: Profile News Message Board | |
| Charts:- Daily , Weekly | |
| Add STRO to Watchlist: View: Get Complete STRO Trend Analysis ➞ | |
 | HEES H&E Equipment Services, Inc. |
| Sector: Transports | |
| SubSector: Rental & Leasing Services | |
| MarketCap: 451.944 Millions | |
| Recent Price: 46.65 Smart Investing & Trading Score: 17 | |
| Day Percent Change: -0.85% Day Change: -0.40 | |
| Week Change: -20.46% Year-to-date Change: -10.8% | |
| HEES Links: Profile News Message Board | |
| Charts:- Daily , Weekly | |
| Add HEES to Watchlist: View: Get Complete HEES Trend Analysis ➞ | |
 | BHB Bar Harbor Bankshares |
| Sector: Financials | |
| SubSector: Regional - Northeast Banks | |
| MarketCap: 298.099 Millions | |
| Recent Price: 26.15 Smart Investing & Trading Score: 100 | |
| Day Percent Change: 0.50% Day Change: 0.13 | |
| Week Change: 2.51% Year-to-date Change: -10.9% | |
| BHB Links: Profile News Message Board | |
| Charts:- Daily , Weekly | |
| Add BHB to Watchlist: View: Get Complete BHB Trend Analysis ➞ | |
 | ORA Ormat Technologies, Inc. |
| Sector: Utilities | |
| SubSector: Electric Utilities | |
| MarketCap: 3610.74 Millions | |
| Recent Price: 67.50 Smart Investing & Trading Score: 100 | |
| Day Percent Change: 1.18% Day Change: 0.79 | |
| Week Change: 6.96% Year-to-date Change: -10.9% | |
| ORA Links: Profile News Message Board | |
| Charts:- Daily , Weekly | |
| Add ORA to Watchlist: View: Get Complete ORA Trend Analysis ➞ | |
 | GOGO Gogo Inc. |
| Sector: Technology | |
| SubSector: Diversified Communication Services | |
| MarketCap: 307.064 Millions | |
| Recent Price: 9.02 Smart Investing & Trading Score: 76 | |
| Day Percent Change: -0.99% Day Change: -0.09 | |
| Week Change: -1.31% Year-to-date Change: -11.0% | |
| GOGO Links: Profile News Message Board | |
| Charts:- Daily , Weekly | |
| Add GOGO to Watchlist: View: Get Complete GOGO Trend Analysis ➞ | |
 | AURA Aura Biosciences, Inc. |
| Sector: Health Care | |
| SubSector: Biotechnology | |
| MarketCap: 469 Millions | |
| Recent Price: 7.88 Smart Investing & Trading Score: 64 | |
| Day Percent Change: 4.93% Day Change: 0.37 | |
| Week Change: 9.14% Year-to-date Change: -11.0% | |
| AURA Links: Profile News Message Board | |
| Charts:- Daily , Weekly | |
| Add AURA to Watchlist: View: Get Complete AURA Trend Analysis ➞ | |
 | AMBC Ambac Financial Group, Inc. |
| Sector: Financials | |
| SubSector: Surety & Title Insurance | |
| MarketCap: 587.818 Millions | |
| Recent Price: 14.67 Smart Investing & Trading Score: 32 | |
| Day Percent Change: -1.48% Day Change: -0.22 | |
| Week Change: 0.55% Year-to-date Change: -11.0% | |
| AMBC Links: Profile News Message Board | |
| Charts:- Daily , Weekly | |
| Add AMBC to Watchlist: View: Get Complete AMBC Trend Analysis ➞ | |
 | OCFC OceanFirst Financial Corp. |
| Sector: Financials | |
| SubSector: Savings & Loans | |
| MarketCap: 867.43 Millions | |
| Recent Price: 15.45 Smart Investing & Trading Score: 93 | |
| Day Percent Change: -0.19% Day Change: -0.03 | |
| Week Change: 0.52% Year-to-date Change: -11.0% | |
| OCFC Links: Profile News Message Board | |
| Charts:- Daily , Weekly | |
| Add OCFC to Watchlist: View: Get Complete OCFC Trend Analysis ➞ | |
 | BKU BankUnited, Inc. |
| Sector: Financials | |
| SubSector: Regional - Mid-Atlantic Banks | |
| MarketCap: 1905.99 Millions | |
| Recent Price: 28.85 Smart Investing & Trading Score: 100 | |
| Day Percent Change: 0.28% Day Change: 0.08 | |
| Week Change: 5.83% Year-to-date Change: -11.0% | |
| BKU Links: Profile News Message Board | |
| Charts:- Daily , Weekly | |
| Add BKU to Watchlist: View: Get Complete BKU Trend Analysis ➞ | |
 | HTH Hilltop Holdings Inc. |
| Sector: Financials | |
| SubSector: Mortgage Investment | |
| MarketCap: 1317.89 Millions | |
| Recent Price: 31.32 Smart Investing & Trading Score: 100 | |
| Day Percent Change: 1.92% Day Change: 0.59 | |
| Week Change: 3.16% Year-to-date Change: -11.1% | |
| HTH Links: Profile News Message Board | |
| Charts:- Daily , Weekly | |
| Add HTH to Watchlist: View: Get Complete HTH Trend Analysis ➞ | |
 | CBL CBL & Associates Properties, Inc. |
| Sector: Financials | |
| SubSector: REIT - Retail | |
| MarketCap: 690 Millions | |
| Recent Price: 21.71 Smart Investing & Trading Score: 45 | |
| Day Percent Change: 0.65% Day Change: 0.14 | |
| Week Change: -0.96% Year-to-date Change: -11.1% | |
| CBL Links: Profile News Message Board | |
| Charts:- Daily , Weekly | |
| Add CBL to Watchlist: View: Get Complete CBL Trend Analysis ➞ | |
 | WRBY Warby Parker Inc. |
| Sector: Health Care | |
| SubSector: Medical Instruments & Supplies | |
| MarketCap: 1380 Millions | |
| Recent Price: 12.54 Smart Investing & Trading Score: 37 | |
| Day Percent Change: 2.16% Day Change: 0.26 | |
| Week Change: -2.94% Year-to-date Change: -11.1% | |
| WRBY Links: Profile News Message Board | |
| Charts:- Daily , Weekly | |
| Add WRBY to Watchlist: View: Get Complete WRBY Trend Analysis ➞ | |
 | VRA Vera Bradley, Inc. |
| Sector: Consumer Staples | |
| SubSector: Textile - Apparel Footwear & Accessories | |
| MarketCap: 151.17 Millions | |
| Recent Price: 6.84 Smart Investing & Trading Score: 59 | |
| Day Percent Change: -1.87% Day Change: -0.13 | |
| Week Change: 1.41% Year-to-date Change: -11.2% | |
| VRA Links: Profile News Message Board | |
| Charts:- Daily , Weekly | |
| Add VRA to Watchlist: View: Get Complete VRA Trend Analysis ➞ | |
 | PEBO Peoples Bancorp Inc. |
| Sector: Financials | |
| SubSector: Regional - Midwest Banks | |
| MarketCap: 449.77 Millions | |
| Recent Price: 29.98 Smart Investing & Trading Score: 83 | |
| Day Percent Change: -0.07% Day Change: -0.02 | |
| Week Change: 0.74% Year-to-date Change: -11.2% | |
| PEBO Links: Profile News Message Board | |
| Charts:- Daily , Weekly | |
| Add PEBO to Watchlist: View: Get Complete PEBO Trend Analysis ➞ | |
| Too many stocks? View smallcap stocks filtered by marketcap & sector |
| Marketcap: All SmallCap Stocks (default-no microcap), Large, Mid-Range, Small & MicroCap |
| Sector: Tech, Finance, Energy, Staples, Retail, Industrial, Materials, Utilities & Medical |
|
Best Stocks Today 12Stocks.com |
© 2024 12Stocks.com Terms & Conditions Privacy Contact Us
All Information Provided Only For Education And Not To Be Used For Investing or Trading. See Terms & Conditions


One More Thing ... Get Best Stocks Delivered Daily!
Never Ever Miss A Move With Our Top Ten Stocks Lists
Find Best Stocks In Any Market - Bull or Bear Market
Take A Peek At Our Top Ten Stocks Lists: Daily, Weekly, Year-to-Date & Top Trends
Find Best Stocks In Any Market - Bull or Bear Market
Take A Peek At Our Top Ten Stocks Lists: Daily, Weekly, Year-to-Date & Top Trends
Smallcap Stocks With Best Up Trends [0-bearish to 100-bullish]: Twist Bioscience[100], WideOpenWest [100], Joint [100], FTC Solar[100], Origin Materials[100], Alignment Healthcare[100], Clarus [100], IES [100], Emergent BioSolutions[100], Enovix [100], El Pollo[100]
Best Smallcap Stocks Year-to-Date:
Janux [482.74%], Viking [313.59%], Longboard [272.5%], Alpine Immune[239.29%], Bakkt [199.55%], Avidity Biosciences[192.48%], Vera [189.47%], Cullinan Oncology[176.9%], Super Micro[175.35%], Y-mAbs [151.47%], Sana [149.33%] Best Smallcap Stocks This Week:
Emergent BioSolutions[102.6%], Deciphera [73.24%], Origin Materials[66.52%], Eyenovia [60.78%], Cue Biopharma[56.04%], Aspen Aerogels[55.96%], Enovix [54.02%], Luna Innovations[53.77%], Codexis [47.37%], Carvana Co[44.31%], Office Properties[42.79%] Best Smallcap Stocks Daily:
Luna Innovations[36.00%], Twist Bioscience[28.74%], Ardelyx [28.42%], WideOpenWest [28.23%], 2U [26.63%], Joint [25.35%], FTC Solar[25.09%], Origin Materials[22.23%], Alignment Healthcare[21.97%], Clarus [18.67%], Aurora Innovation[18.09%]