
 Login Sign Up


| |||||
 |  | ||||

| 12Stocks.com Market Intelligence |
Best SmallCap Stocks
|
| In a hurry? Small Cap Stock Lists: Performance Trends Table, Stock Charts
Sort Small Cap stocks: Daily, Weekly, Year-to-Date, Market Cap & Trends. Filter Small Cap stocks list by sector: Show all, Tech, Finance, Energy, Staples, Retail, Industrial, Materials, Utilities and HealthCare Filter Small Cap stocks list by size: All Large Medium Small and MicroCap |
| 12Stocks.com Small Cap Stocks Performances & Trends Daily | |||||||||
|
|  The overall Smart Investing & Trading Score is 88 (0-bearish to 100-bullish) which puts Small Cap index in short term bullish trend. The Smart Investing & Trading Score from previous trading session is 56 and hence an improvement of trend.
| ||||||||
Here are the Smart Investing & Trading Scores of the most requested small cap stocks at 12Stocks.com (click stock name for detailed review):
|


| 12Stocks.com: Investing in Smallcap Index with Stocks | |
|
The following table helps investors and traders sort through current performance and trends (as measured by Smart Investing & Trading Score) of various
stocks in the Smallcap Index. Quick View: Move mouse or cursor over stock symbol (ticker) to view short-term technical chart and over stock name to view long term chart. Click on  to add stock symbol to your watchlist and to add stock symbol to your watchlist and  to view watchlist. Click on any ticker or stock name for detailed market intelligence report for that stock. to view watchlist. Click on any ticker or stock name for detailed market intelligence report for that stock. |
12Stocks.com Performance of Stocks in Smallcap Index
| Ticker | Stock Name | Watchlist | Category | Recent Price | Smart Investing & Trading Score | Change % | YTD Change% |
| HIBB | Hibbett Sports |   | Services & Goods | 85.95 | 81 | -0.23% | 19.34% |
| COLL | Collegium Pharmaceutical | | Health Care | 36.71 | 80 | 0.80% | 19.27% |
| VSEC | VSE | | Services & Goods | 77.05 | 41 | 1.37% | 19.25% |
| KNF | Knife River | | Materials | 79.30 | 70 | 1.34% | 19.25% |
| HMST | HomeStreet | | Financials | 12.28 | 35 | 1.91% | 19.22% |
| DGII | Digi | | Technology | 30.97 | 83 | 0.06% | 19.12% |
| SEM | Select Medical | | Health Care | 27.99 | 76 | 2.12% | 19.11% |
| ELF | e.l.f. Beauty | | Consumer Staples | 171.86 | 48 | -4.33% | 19.07% |
| SFL | SFL | | Transports | 13.41 | 95 | 1.28% | 18.88% |
| STNG | Scorpio Tankers | | Transports | 72.25 | 90 | -0.71% | 18.83% |
| ICHR | Ichor | | Technology | 39.96 | 100 | 1.55% | 18.82% |
| NOTE | FiscalNote | | Technology | 1.39 | 100 | 1.46% | 18.80% |
| ANIP | ANI | | Health Care | 65.50 | 51 | 0.21% | 18.79% |
| LLAP | Terran Orbital | | Industrials | 1.36 | 75 | 1.49% | 18.78% |
| BKD | Brookdale Senior | | Health Care | 6.91 | 95 | -0.72% | 18.73% |
| REVG | REV Group | | Consumer Staples | 21.55 | 46 | 1.46% | 18.60% |
| ACVA | ACV Auctions | | Services & Goods | 17.83 | 46 | -1.44% | 18.39% |
| BLX | Banco Latinoamericano | | Financials | 29.27 | 53 | -1.05% | 18.31% |
| CRS | Carpenter | | Industrials | 83.73 | 100 | -0.32% | 18.26% |
| MYRG | MYR Group | | Industrials | 170.70 | 90 | 1.51% | 18.03% |
| SLDP | Solid Power | | Industrials | 1.68 | 75 | -1.75% | 17.89% |
| SWX | Southwest Gas | | Utilities | 74.63 | 58 | -0.49% | 17.81% |
| BSIG | BrightSphere | | Financials | 22.57 | 51 | -0.18% | 17.80% |
| KODK | Eastman Kodak | | Technology | 4.59 | 53 | 1.55% | 17.69% |
| KAR | KAR Auction | | Services & Goods | 17.41 | 75 | -0.06% | 17.56% |


| Too many stocks? View smallcap stocks filtered by marketcap & sector |
| Marketcap: All SmallCap Stocks (default-no microcap), Large, Mid-Range, Small |
| Smallcap Sector: Tech, Finance, Energy, Staples, Retail, Industrial, Materials, & Medical |
|
Get the most comprehensive stock market coverage daily at 12Stocks.com ➞ Best Stocks Today ➞ Best Stocks Weekly ➞ Best Stocks Year-to-Date ➞ Best Stocks Trends ➞  Best Stocks Today 12Stocks.com Best Nasdaq Stocks ➞ Best S&P 500 Stocks ➞ Best Tech Stocks ➞ Best Biotech Stocks ➞ |
| Detailed Overview of SmallCap Stocks |
| SmallCap Technical Overview, Leaders & Laggards, Top SmallCap ETF Funds & Detailed SmallCap Stocks List, Charts, Trends & More |
| Smallcap: Technical Analysis, Trends & YTD Performance | |
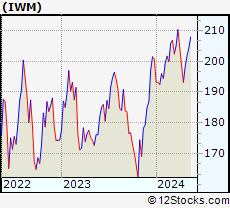
| SmallCap segment as represented by
IWM, an exchange-traded fund [ETF], holds basket of thousands of smallcap stocks from across all major sectors of the US stock market. The smallcap index (contains stocks like Riverbed & Sotheby's) is down by -0.37% and is currently underperforming the overall market by -6.93% year-to-date. Below is a quick view of technical charts and trends: | |
 IWM Weekly Chart |
|
| Long Term Trend: Very Good | |
| Medium Term Trend: Good | |
 IWM Daily Chart |
|
| Short Term Trend: Very Good | |
| Overall Trend Score: 88 | |
| YTD Performance: -0.37% | |
| **Trend Scores & Views Are Only For Educational Purposes And Not For Investing | |
| 12Stocks.com: Top Performing Small Cap Index Stocks | ||||||||||||||||||||||||||||||||||||||||||||||||
 The top performing Small Cap Index stocks year to date are
Now, more recently, over last week, the top performing Small Cap Index stocks on the move are


|
||||||||||||||||||||||||||||||||||||||||||||||||
| 12Stocks.com: Investing in Smallcap Index using Exchange Traded Funds | |
|
The following table shows list of key exchange traded funds (ETF) that
help investors track Smallcap index. The following list also includes leveraged ETF funds that track twice or thrice the daily returns of Smallcap indices. Short or inverse ETF funds move in the opposite direction to the index they track and are useful during market pullbacks or during bear markets. Quick View: Move mouse or cursor over ETF symbol (ticker) to view short-term technical chart and over ETF name to view long term chart. Click on ticker or stock name for detailed view. Click on to add stock symbol to your watchlist and to view watchlist. |
12Stocks.com List of ETFs that track Smallcap Index
| Ticker | ETF Name | Watchlist | Recent Price | Smart Investing & Trading Score | Change % | Week % | Year-to-date % |
| IWM | iShares Russell 2000 | | 199.96 | 88 | 0.79 | 0.79 | -0.37% |
| IJR | iShares Core S&P Small-Cap | | 106.41 | 93 | 0.72 | 0.72 | -1.7% |
| VTWO | Vanguard Russell 2000 ETF | | 80.78 | 88 | 0.70 | 0.7 | -0.39% |
| IWN | iShares Russell 2000 Value | | 152.05 | 93 | 0.60 | 0.6 | -2.11% |
| IWO | iShares Russell 2000 Growth | | 255.74 | 88 | 1.05 | 1.05 | 1.4% |
| IJS | iShares S&P Small-Cap 600 Value | | 97.95 | 75 | 0.78 | 0.78 | -4.97% |
| IJT | iShares S&P Small-Cap 600 Growth | | 126.96 | 95 | 0.69 | 0.69 | 1.45% |
| XSLV | PowerShares S&P SmallCap Low Volatil ETF | | 42.87 | 80 | 0.35 | 0.35 | -2.9% |
| SMLV | SPDR SSGA US Small Cap Low Volatil ETF | | 107.77 | 68 | 0.23 | 0.23 | -4.22% |
| SAA | ProShares Ultra SmallCap600 | | 23.27 | 95 | 1.00 | 1 | -6.73% |
| SBB | ProShares Short SmallCap600 | | 16.28 | 8 | -0.64 | -0.64 | 2.2% |
| SDD | ProShares UltraShort SmallCap600 | | 19.09 | 10 | -1.34 | -1.34 | 3.6% |
| 12Stocks.com: Charts, Trends, Fundamental Data and Performances of SmallCap Stocks | |
|
We now take in-depth look at all SmallCap stocks including charts, multi-period performances and overall trends (as measured by Smart Investing & Trading Score). One can sort SmallCap stocks (click link to choose) by Daily, Weekly and by Year-to-Date performances. Also, one can sort by size of the company or by market capitalization. |
| Select Your Default Chart Type: | |||||
| |||||
| Click on stock symbol or name for detailed view. Click on to add stock symbol to your watchlist and to view watchlist. Quick View: Move mouse or cursor over "Daily" to quickly view daily technical stock chart and over "Weekly" to view weekly technical stock chart. | |||||

 | HIBB Hibbett Sports, Inc. |
| Sector: Services & Goods | |
| SubSector: Sporting Goods Stores | |
| MarketCap: 183 Millions | |
| Recent Price: 85.95 Smart Investing & Trading Score: 81 | |
| Day Percent Change: -0.23% Day Change: -0.20 | |
| Week Change: -0.23% Year-to-date Change: 19.3% | |
| HIBB Links: Profile News Message Board | |
| Charts:- Daily , Weekly | |
| Add HIBB to Watchlist: View: Get Complete HIBB Trend Analysis ➞ | |
 | COLL Collegium Pharmaceutical, Inc. |
| Sector: Health Care | |
| SubSector: Drugs - Generic | |
| MarketCap: 569.185 Millions | |
| Recent Price: 36.71 Smart Investing & Trading Score: 80 | |
| Day Percent Change: 0.80% Day Change: 0.29 | |
| Week Change: 0.8% Year-to-date Change: 19.3% | |
| COLL Links: Profile News Message Board | |
| Charts:- Daily , Weekly | |
| Add COLL to Watchlist: View: Get Complete COLL Trend Analysis ➞ | |
 | VSEC VSE Corporation |
| Sector: Services & Goods | |
| SubSector: Technical Services | |
| MarketCap: 183.61 Millions | |
| Recent Price: 77.05 Smart Investing & Trading Score: 41 | |
| Day Percent Change: 1.37% Day Change: 1.04 | |
| Week Change: 1.37% Year-to-date Change: 19.3% | |
| VSEC Links: Profile News Message Board | |
| Charts:- Daily , Weekly | |
| Add VSEC to Watchlist: View: Get Complete VSEC Trend Analysis ➞ | |
 | KNF Knife River Corporation |
| Sector: Materials | |
| SubSector: Building Materials | |
| MarketCap: 2570 Millions | |
| Recent Price: 79.30 Smart Investing & Trading Score: 70 | |
| Day Percent Change: 1.34% Day Change: 1.05 | |
| Week Change: 1.34% Year-to-date Change: 19.3% | |
| KNF Links: Profile News Message Board | |
| Charts:- Daily , Weekly | |
| Add KNF to Watchlist: View: Get Complete KNF Trend Analysis ➞ | |
 | HMST HomeStreet, Inc. |
| Sector: Financials | |
| SubSector: Savings & Loans | |
| MarketCap: 535.33 Millions | |
| Recent Price: 12.28 Smart Investing & Trading Score: 35 | |
| Day Percent Change: 1.91% Day Change: 0.23 | |
| Week Change: 1.91% Year-to-date Change: 19.2% | |
| HMST Links: Profile News Message Board | |
| Charts:- Daily , Weekly | |
| Add HMST to Watchlist: View: Get Complete HMST Trend Analysis ➞ | |
 | DGII Digi International Inc. |
| Sector: Technology | |
| SubSector: Communication Equipment | |
| MarketCap: 257.339 Millions | |
| Recent Price: 30.97 Smart Investing & Trading Score: 83 | |
| Day Percent Change: 0.06% Day Change: 0.02 | |
| Week Change: 0.06% Year-to-date Change: 19.1% | |
| DGII Links: Profile News Message Board | |
| Charts:- Daily , Weekly | |
| Add DGII to Watchlist: View: Get Complete DGII Trend Analysis ➞ | |
 | SEM Select Medical Holdings Corporation |
| Sector: Health Care | |
| SubSector: Hospitals | |
| MarketCap: 1765.96 Millions | |
| Recent Price: 27.99 Smart Investing & Trading Score: 76 | |
| Day Percent Change: 2.12% Day Change: 0.58 | |
| Week Change: 2.12% Year-to-date Change: 19.1% | |
| SEM Links: Profile News Message Board | |
| Charts:- Daily , Weekly | |
| Add SEM to Watchlist: View: Get Complete SEM Trend Analysis ➞ | |
 | ELF e.l.f. Beauty, Inc. |
| Sector: Consumer Staples | |
| SubSector: Personal Products | |
| MarketCap: 497.985 Millions | |
| Recent Price: 171.86 Smart Investing & Trading Score: 48 | |
| Day Percent Change: -4.33% Day Change: -7.77 | |
| Week Change: -4.33% Year-to-date Change: 19.1% | |
| ELF Links: Profile News Message Board | |
| Charts:- Daily , Weekly | |
| Add ELF to Watchlist: View: Get Complete ELF Trend Analysis ➞ | |
 | SFL SFL Corporation Ltd. |
| Sector: Transports | |
| SubSector: Shipping | |
| MarketCap: 890.414 Millions | |
| Recent Price: 13.41 Smart Investing & Trading Score: 95 | |
| Day Percent Change: 1.28% Day Change: 0.17 | |
| Week Change: 1.28% Year-to-date Change: 18.9% | |
| SFL Links: Profile News Message Board | |
| Charts:- Daily , Weekly | |
| Add SFL to Watchlist: View: Get Complete SFL Trend Analysis ➞ | |
 | STNG Scorpio Tankers Inc. |
| Sector: Transports | |
| SubSector: Shipping | |
| MarketCap: 813.214 Millions | |
| Recent Price: 72.25 Smart Investing & Trading Score: 90 | |
| Day Percent Change: -0.71% Day Change: -0.52 | |
| Week Change: -0.71% Year-to-date Change: 18.8% | |
| STNG Links: Profile News Message Board | |
| Charts:- Daily , Weekly | |
| Add STNG to Watchlist: View: Get Complete STNG Trend Analysis ➞ | |
 | ICHR Ichor Holdings, Ltd. |
| Sector: Technology | |
| SubSector: Semiconductor Equipment & Materials | |
| MarketCap: 409.018 Millions | |
| Recent Price: 39.96 Smart Investing & Trading Score: 100 | |
| Day Percent Change: 1.55% Day Change: 0.61 | |
| Week Change: 1.55% Year-to-date Change: 18.8% | |
| ICHR Links: Profile News Message Board | |
| Charts:- Daily , Weekly | |
| Add ICHR to Watchlist: View: Get Complete ICHR Trend Analysis ➞ | |
 | NOTE FiscalNote Holdings, Inc. |
| Sector: Technology | |
| SubSector: Information Technology Services | |
| MarketCap: 493 Millions | |
| Recent Price: 1.39 Smart Investing & Trading Score: 100 | |
| Day Percent Change: 1.46% Day Change: 0.02 | |
| Week Change: 1.46% Year-to-date Change: 18.8% | |
| NOTE Links: Profile News Message Board | |
| Charts:- Daily , Weekly | |
| Add NOTE to Watchlist: View: Get Complete NOTE Trend Analysis ➞ | |
 | ANIP ANI Pharmaceuticals, Inc. |
| Sector: Health Care | |
| SubSector: Biotechnology | |
| MarketCap: 489.285 Millions | |
| Recent Price: 65.50 Smart Investing & Trading Score: 51 | |
| Day Percent Change: 0.21% Day Change: 0.14 | |
| Week Change: 0.21% Year-to-date Change: 18.8% | |
| ANIP Links: Profile News Message Board | |
| Charts:- Daily , Weekly | |
| Add ANIP to Watchlist: View: Get Complete ANIP Trend Analysis ➞ | |
 | LLAP Terran Orbital Corporation |
| Sector: Industrials | |
| SubSector: Aerospace & Defense | |
| MarketCap: 206 Millions | |
| Recent Price: 1.36 Smart Investing & Trading Score: 75 | |
| Day Percent Change: 1.49% Day Change: 0.02 | |
| Week Change: 1.49% Year-to-date Change: 18.8% | |
| LLAP Links: Profile News Message Board | |
| Charts:- Daily , Weekly | |
| Add LLAP to Watchlist: View: Get Complete LLAP Trend Analysis ➞ | |
 | BKD Brookdale Senior Living Inc. |
| Sector: Health Care | |
| SubSector: Long-Term Care Facilities | |
| MarketCap: 420.686 Millions | |
| Recent Price: 6.91 Smart Investing & Trading Score: 95 | |
| Day Percent Change: -0.72% Day Change: -0.05 | |
| Week Change: -0.72% Year-to-date Change: 18.7% | |
| BKD Links: Profile News Message Board | |
| Charts:- Daily , Weekly | |
| Add BKD to Watchlist: View: Get Complete BKD Trend Analysis ➞ | |
 | REVG REV Group, Inc. |
| Sector: Consumer Staples | |
| SubSector: Trucks & Other Vehicles | |
| MarketCap: 398.597 Millions | |
| Recent Price: 21.55 Smart Investing & Trading Score: 46 | |
| Day Percent Change: 1.46% Day Change: 0.31 | |
| Week Change: 1.46% Year-to-date Change: 18.6% | |
| REVG Links: Profile News Message Board | |
| Charts:- Daily , Weekly | |
| Add REVG to Watchlist: View: Get Complete REVG Trend Analysis ➞ | |
 | ACVA ACV Auctions Inc. |
| Sector: Services & Goods | |
| SubSector: Auto & Truck Dealerships | |
| MarketCap: 2680 Millions | |
| Recent Price: 17.83 Smart Investing & Trading Score: 46 | |
| Day Percent Change: -1.44% Day Change: -0.26 | |
| Week Change: -1.44% Year-to-date Change: 18.4% | |
| ACVA Links: Profile News Message Board | |
| Charts:- Daily , Weekly | |
| Add ACVA to Watchlist: View: Get Complete ACVA Trend Analysis ➞ | |
 | BLX Banco Latinoamericano de Comercio Exterior, S.A |
| Sector: Financials | |
| SubSector: Foreign Money Center Banks | |
| MarketCap: 390.471 Millions | |
| Recent Price: 29.27 Smart Investing & Trading Score: 53 | |
| Day Percent Change: -1.05% Day Change: -0.31 | |
| Week Change: -1.05% Year-to-date Change: 18.3% | |
| BLX Links: Profile News Message Board | |
| Charts:- Daily , Weekly | |
| Add BLX to Watchlist: View: Get Complete BLX Trend Analysis ➞ | |
 | CRS Carpenter Technology Corporation |
| Sector: Industrials | |
| SubSector: Metal Fabrication | |
| MarketCap: 853.35 Millions | |
| Recent Price: 83.73 Smart Investing & Trading Score: 100 | |
| Day Percent Change: -0.32% Day Change: -0.27 | |
| Week Change: -0.32% Year-to-date Change: 18.3% | |
| CRS Links: Profile News Message Board | |
| Charts:- Daily , Weekly | |
| Add CRS to Watchlist: View: Get Complete CRS Trend Analysis ➞ | |
 | MYRG MYR Group Inc. |
| Sector: Industrials | |
| SubSector: General Contractors | |
| MarketCap: 405.363 Millions | |
| Recent Price: 170.70 Smart Investing & Trading Score: 90 | |
| Day Percent Change: 1.51% Day Change: 2.54 | |
| Week Change: 1.51% Year-to-date Change: 18.0% | |
| MYRG Links: Profile News Message Board | |
| Charts:- Daily , Weekly | |
| Add MYRG to Watchlist: View: Get Complete MYRG Trend Analysis ➞ | |
 | SLDP Solid Power, Inc. |
| Sector: Industrials | |
| SubSector: Electrical Equipment & Parts | |
| MarketCap: 445 Millions | |
| Recent Price: 1.68 Smart Investing & Trading Score: 75 | |
| Day Percent Change: -1.75% Day Change: -0.03 | |
| Week Change: -1.75% Year-to-date Change: 17.9% | |
| SLDP Links: Profile News Message Board | |
| Charts:- Daily , Weekly | |
| Add SLDP to Watchlist: View: Get Complete SLDP Trend Analysis ➞ | |
 | SWX Southwest Gas Holdings, Inc. |
| Sector: Utilities | |
| SubSector: Gas Utilities | |
| MarketCap: 3427.87 Millions | |
| Recent Price: 74.63 Smart Investing & Trading Score: 58 | |
| Day Percent Change: -0.49% Day Change: -0.37 | |
| Week Change: -0.49% Year-to-date Change: 17.8% | |
| SWX Links: Profile News Message Board | |
| Charts:- Daily , Weekly | |
| Add SWX to Watchlist: View: Get Complete SWX Trend Analysis ➞ | |
 | BSIG BrightSphere Investment Group Inc. |
| Sector: Financials | |
| SubSector: Asset Management | |
| MarketCap: 430.103 Millions | |
| Recent Price: 22.57 Smart Investing & Trading Score: 51 | |
| Day Percent Change: -0.18% Day Change: -0.04 | |
| Week Change: -0.18% Year-to-date Change: 17.8% | |
| BSIG Links: Profile News Message Board | |
| Charts:- Daily , Weekly | |
| Add BSIG to Watchlist: View: Get Complete BSIG Trend Analysis ➞ | |
 | KODK Eastman Kodak Company |
| Sector: Technology | |
| SubSector: Electronic Equipment | |
| MarketCap: 78.47 Millions | |
| Recent Price: 4.59 Smart Investing & Trading Score: 53 | |
| Day Percent Change: 1.55% Day Change: 0.07 | |
| Week Change: 1.55% Year-to-date Change: 17.7% | |
| KODK Links: Profile News Message Board | |
| Charts:- Daily , Weekly | |
| Add KODK to Watchlist: View: Get Complete KODK Trend Analysis ➞ | |
 | KAR KAR Auction Services, Inc. |
| Sector: Services & Goods | |
| SubSector: Specialty Retail, Other | |
| MarketCap: 1709.54 Millions | |
| Recent Price: 17.41 Smart Investing & Trading Score: 75 | |
| Day Percent Change: -0.06% Day Change: -0.01 | |
| Week Change: -0.06% Year-to-date Change: 17.6% | |
| KAR Links: Profile News Message Board | |
| Charts:- Daily , Weekly | |
| Add KAR to Watchlist: View: Get Complete KAR Trend Analysis ➞ | |
| Too many stocks? View smallcap stocks filtered by marketcap & sector |
| Marketcap: All SmallCap Stocks (default-no microcap), Large, Mid-Range, Small & MicroCap |
| Sector: Tech, Finance, Energy, Staples, Retail, Industrial, Materials, Utilities & Medical |
|
Best Stocks Today 12Stocks.com |
© 2024 12Stocks.com Terms & Conditions Privacy Contact Us
All Information Provided Only For Education And Not To Be Used For Investing or Trading. See Terms & Conditions


One More Thing ... Get Best Stocks Delivered Daily!
Never Ever Miss A Move With Our Top Ten Stocks Lists
Find Best Stocks In Any Market - Bull or Bear Market
Take A Peek At Our Top Ten Stocks Lists: Daily, Weekly, Year-to-Date & Top Trends
Find Best Stocks In Any Market - Bull or Bear Market
Take A Peek At Our Top Ten Stocks Lists: Daily, Weekly, Year-to-Date & Top Trends
Smallcap Stocks With Best Up Trends [0-bearish to 100-bullish]: Bakkt [100], Deciphera [100], Phibro Animal[100], Heartland Financial[100], PTC [100], Day One[100], Richardson Electronics[100], Fulton Financial[100], Cullinan Oncology[100], Lands [100], TransMedics Group[100]
Best Smallcap Stocks Year-to-Date:
CareMax [580.41%], Janux [421.92%], Bakkt [346.64%], Viking [305.75%], Longboard [247.46%], Alpine Immune[239.81%], Super Micro[213.22%], Avidity Biosciences[173.23%], Arcutis Bio[171.83%], Vera [167.31%], Cullinan Oncology[166.01%] Best Smallcap Stocks This Week:
Deciphera [72.56%], Phibro Animal[31.81%], Vaxxinity [31.65%], Zevia PBC[20.94%], Velo3D [19.97%], Acrivon [18.2%], Janux [18.18%], MultiPlan [15.53%], Heartland Financial[15.15%], Codexis [14.66%], Eyenovia [13.37%] Best Smallcap Stocks Daily:
Bakkt [2391.87%], Deciphera [72.56%], Phibro Animal[31.81%], Vaxxinity [31.65%], Zevia PBC[20.94%], Velo3D [19.97%], Acrivon [18.20%], Janux [18.18%], MultiPlan [15.53%], Heartland Financial[15.15%], Codexis [14.66%]