
 Login Sign Up


| |||||
 |  | ||||

| 12Stocks.com Market Intelligence |
Best SmallCap Stocks
|
| In a hurry? Small Cap Stock Lists: Performance Trends Table, Stock Charts
Sort Small Cap stocks: Daily, Weekly, Year-to-Date, Market Cap & Trends. Filter Small Cap stocks list by sector: Show all, Tech, Finance, Energy, Staples, Retail, Industrial, Materials, Utilities and HealthCare Filter Small Cap stocks list by size: All Large Medium Small and MicroCap |
| 12Stocks.com Small Cap Stocks Performances & Trends Daily | |||||||||
|
|  The overall Smart Investing & Trading Score is 24 (0-bearish to 100-bullish) which puts Small Cap index in short term bearish to neutral trend. The Smart Investing & Trading Score from previous trading session is 14 and hence an improvement of trend.
| ||||||||
Here are the Smart Investing & Trading Scores of the most requested small cap stocks at 12Stocks.com (click stock name for detailed review):
|


| 12Stocks.com: Investing in Smallcap Index with Stocks | |
|
The following table helps investors and traders sort through current performance and trends (as measured by Smart Investing & Trading Score) of various
stocks in the Smallcap Index. Quick View: Move mouse or cursor over stock symbol (ticker) to view short-term technical chart and over stock name to view long term chart. Click on  to add stock symbol to your watchlist and to add stock symbol to your watchlist and  to view watchlist. Click on any ticker or stock name for detailed market intelligence report for that stock. to view watchlist. Click on any ticker or stock name for detailed market intelligence report for that stock. |
12Stocks.com Performance of Stocks in Smallcap Index
| Ticker | Stock Name | Watchlist | Category | Recent Price | Smart Investing & Trading Score | Change % | YTD Change% |
| IGT | Game |   | Services & Goods | 19.96 | 30 | 0.30% | -27.18% |
| DOMO | Domo | | Technology | 7.49 | 32 | -1.06% | -27.21% |
| LUNG | Pulmonx | | Health Care | 9.28 | 49 | 20.21% | -27.22% |
| VCYT | Veracyte | | Health Care | 20.02 | 50 | -0.55% | -27.23% |
| AIRS | AirSculpt | | Health Care | 5.45 | 25 | -1.54% | -27.24% |
| OPRX | OptimizeRx | | Technology | 10.41 | 54 | -0.10% | -27.25% |
| EVRI | Everi | | Services & Goods | 8.20 | 10 | 1.93% | -27.28% |
| ZNTL | Zentalis | | Health Care | 11.01 | 42 | -2.70% | -27.41% |
| CWCO | Consolidated Water | | Utilities | 25.84 | 37 | 0.31% | -27.42% |
| INST | Instructure | | Technology | 19.57 | 42 | 0.62% | -27.55% |
| PX | P10 | | Financials | 7.39 | 46 | 0.61% | -27.64% |
| PRFT | Perficient | | Technology | 47.58 | 49 | 0.72% | -27.71% |
| SNFCA | Security National | | Financials | 6.50 | 0 | 0.00% | -27.78% |
| SITM | SiTime | | Technology | 88.03 | 47 | 0.87% | -27.89% |
| SCPH | sc | | Health Care | 4.52 | 42 | -0.44% | -27.91% |
| SST | System1 | | Industrials | 1.74 | 41 | 0.87% | -28.01% |
| IRWD | Ironwood | | Health Care | 8.23 | 57 | 0.12% | -28.06% |
| AKTS | Akoustis | | Technology | 0.60 | 62 | 0.00% | -28.06% |
| VICR | Vicor | | Technology | 32.22 | 10 | 1.24% | -28.32% |
| NYMT | New York | | Financials | 6.11 | 43 | -12.96% | -28.37% |
| FLGT | Fulgent Genetics | | Health Care | 20.70 | 59 | 0.00% | -28.40% |
| PL | Planet Labs | | Industrials | 1.77 | 37 | 0.85% | -28.43% |
| DCOM | Dime Community | | Financials | 19.27 | 86 | 1.64% | -28.44% |
| PWSC | PowerSchool | | Technology | 16.91 | 10 | 0.48% | -28.47% |
| IONQ | IonQ | | Technology | 8.90 | 37 | 1.71% | -28.60% |


| Too many stocks? View smallcap stocks filtered by marketcap & sector |
| Marketcap: All SmallCap Stocks (default-no microcap), Large, Mid-Range, Small |
| Smallcap Sector: Tech, Finance, Energy, Staples, Retail, Industrial, Materials, & Medical |
|
Get the most comprehensive stock market coverage daily at 12Stocks.com ➞ Best Stocks Today ➞ Best Stocks Weekly ➞ Best Stocks Year-to-Date ➞ Best Stocks Trends ➞  Best Stocks Today 12Stocks.com Best Nasdaq Stocks ➞ Best S&P 500 Stocks ➞ Best Tech Stocks ➞ Best Biotech Stocks ➞ |
| Detailed Overview of SmallCap Stocks |
| SmallCap Technical Overview, Leaders & Laggards, Top SmallCap ETF Funds & Detailed SmallCap Stocks List, Charts, Trends & More |
| Smallcap: Technical Analysis, Trends & YTD Performance | |
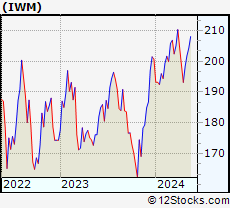
| SmallCap segment as represented by
IWM, an exchange-traded fund [ETF], holds basket of thousands of smallcap stocks from across all major sectors of the US stock market. The smallcap index (contains stocks like Riverbed & Sotheby's) is down by -1.02% and is currently underperforming the overall market by -6.17% year-to-date. Below is a quick view of technical charts and trends: | |
 IWM Weekly Chart |
|
| Long Term Trend: Not Good | |
| Medium Term Trend: Not Good | |
 IWM Daily Chart |
|
| Short Term Trend: Deteriorating | |
| Overall Trend Score: 24 | |
| YTD Performance: -1.02% | |
| **Trend Scores & Views Are Only For Educational Purposes And Not For Investing | |
| 12Stocks.com: Top Performing Small Cap Index Stocks | ||||||||||||||||||||||||||||||||||||||||||||||||
 The top performing Small Cap Index stocks year to date are
Now, more recently, over last week, the top performing Small Cap Index stocks on the move are


|
||||||||||||||||||||||||||||||||||||||||||||||||
| 12Stocks.com: Investing in Smallcap Index using Exchange Traded Funds | |
|
The following table shows list of key exchange traded funds (ETF) that
help investors track Smallcap index. The following list also includes leveraged ETF funds that track twice or thrice the daily returns of Smallcap indices. Short or inverse ETF funds move in the opposite direction to the index they track and are useful during market pullbacks or during bear markets. Quick View: Move mouse or cursor over ETF symbol (ticker) to view short-term technical chart and over ETF name to view long term chart. Click on ticker or stock name for detailed view. Click on to add stock symbol to your watchlist and to view watchlist. |
12Stocks.com List of ETFs that track Smallcap Index
| Ticker | ETF Name | Watchlist | Recent Price | Smart Investing & Trading Score | Change % | Week % | Year-to-date % |
| IWM | iShares Russell 2000 | | 198.66 | 24 | 1.20 | 0.14 | -1.02% |
| IJR | iShares Core S&P Small-Cap | | 105.66 | 15 | 0.88 | 0.01 | -2.39% |
| IWN | iShares Russell 2000 Value | | 151.74 | 15 | 1.28 | 0.39 | -2.31% |
| IWO | iShares Russell 2000 Growth | | 252.43 | 7 | 1.14 | -0.26 | 0.08% |
| 12Stocks.com: Charts, Trends, Fundamental Data and Performances of SmallCap Stocks | |
|
We now take in-depth look at all SmallCap stocks including charts, multi-period performances and overall trends (as measured by Smart Investing & Trading Score). One can sort SmallCap stocks (click link to choose) by Daily, Weekly and by Year-to-Date performances. Also, one can sort by size of the company or by market capitalization. |
| Select Your Default Chart Type: | |||||
| |||||
| Click on stock symbol or name for detailed view. Click on to add stock symbol to your watchlist and to view watchlist. Quick View: Move mouse or cursor over "Daily" to quickly view daily technical stock chart and over "Weekly" to view weekly technical stock chart. | |||||

 | IGT International Game Technology PLC |
| Sector: Services & Goods | |
| SubSector: Gaming Activities | |
| MarketCap: 1030.89 Millions | |
| Recent Price: 19.96 Smart Investing & Trading Score: 30 | |
| Day Percent Change: 0.30% Day Change: 0.06 | |
| Week Change: -1.67% Year-to-date Change: -27.2% | |
| IGT Links: Profile News Message Board | |
| Charts:- Daily , Weekly | |
| Add IGT to Watchlist: View: Get Complete IGT Trend Analysis ➞ | |
 | DOMO Domo, Inc. |
| Sector: Technology | |
| SubSector: Application Software | |
| MarketCap: 247.062 Millions | |
| Recent Price: 7.49 Smart Investing & Trading Score: 32 | |
| Day Percent Change: -1.06% Day Change: -0.08 | |
| Week Change: -1.32% Year-to-date Change: -27.2% | |
| DOMO Links: Profile News Message Board | |
| Charts:- Daily , Weekly | |
| Add DOMO to Watchlist: View: Get Complete DOMO Trend Analysis ➞ | |
 | LUNG Pulmonx Corporation |
| Sector: Health Care | |
| SubSector: Medical Devices | |
| MarketCap: 18187 Millions | |
| Recent Price: 9.28 Smart Investing & Trading Score: 49 | |
| Day Percent Change: 20.21% Day Change: 1.56 | |
| Week Change: 27.47% Year-to-date Change: -27.2% | |
| LUNG Links: Profile News Message Board | |
| Charts:- Daily , Weekly | |
| Add LUNG to Watchlist: View: Get Complete LUNG Trend Analysis ➞ | |
 | VCYT Veracyte, Inc. |
| Sector: Health Care | |
| SubSector: Biotechnology | |
| MarketCap: 1089.05 Millions | |
| Recent Price: 20.02 Smart Investing & Trading Score: 50 | |
| Day Percent Change: -0.55% Day Change: -0.11 | |
| Week Change: 3.68% Year-to-date Change: -27.2% | |
| VCYT Links: Profile News Message Board | |
| Charts:- Daily , Weekly | |
| Add VCYT to Watchlist: View: Get Complete VCYT Trend Analysis ➞ | |
 | AIRS AirSculpt Technologies, Inc. |
| Sector: Health Care | |
| SubSector: Medical Care Facilities | |
| MarketCap: 497 Millions | |
| Recent Price: 5.45 Smart Investing & Trading Score: 25 | |
| Day Percent Change: -1.54% Day Change: -0.08 | |
| Week Change: -2.85% Year-to-date Change: -27.2% | |
| AIRS Links: Profile News Message Board | |
| Charts:- Daily , Weekly | |
| Add AIRS to Watchlist: View: Get Complete AIRS Trend Analysis ➞ | |
 | OPRX OptimizeRx Corporation |
| Sector: Technology | |
| SubSector: Healthcare Information Services | |
| MarketCap: 107.155 Millions | |
| Recent Price: 10.41 Smart Investing & Trading Score: 54 | |
| Day Percent Change: -0.10% Day Change: -0.01 | |
| Week Change: 2.87% Year-to-date Change: -27.3% | |
| OPRX Links: Profile News Message Board | |
| Charts:- Daily , Weekly | |
| Add OPRX to Watchlist: View: Get Complete OPRX Trend Analysis ➞ | |
 | EVRI Everi Holdings Inc. |
| Sector: Services & Goods | |
| SubSector: Gaming Activities | |
| MarketCap: 273.389 Millions | |
| Recent Price: 8.20 Smart Investing & Trading Score: 10 | |
| Day Percent Change: 1.93% Day Change: 0.16 | |
| Week Change: -2.21% Year-to-date Change: -27.3% | |
| EVRI Links: Profile News Message Board | |
| Charts:- Daily , Weekly | |
| Add EVRI to Watchlist: View: Get Complete EVRI Trend Analysis ➞ | |
 | ZNTL Zentalis Pharmaceuticals, Inc. |
| Sector: Health Care | |
| SubSector: Biotechnology | |
| MarketCap: 22187 Millions | |
| Recent Price: 11.01 Smart Investing & Trading Score: 42 | |
| Day Percent Change: -2.70% Day Change: -0.30 | |
| Week Change: -0.5% Year-to-date Change: -27.4% | |
| ZNTL Links: Profile News Message Board | |
| Charts:- Daily , Weekly | |
| Add ZNTL to Watchlist: View: Get Complete ZNTL Trend Analysis ➞ | |
 | CWCO Consolidated Water Co. Ltd. |
| Sector: Utilities | |
| SubSector: Water Utilities | |
| MarketCap: 223.302 Millions | |
| Recent Price: 25.84 Smart Investing & Trading Score: 37 | |
| Day Percent Change: 0.31% Day Change: 0.08 | |
| Week Change: 2.46% Year-to-date Change: -27.4% | |
| CWCO Links: Profile News Message Board | |
| Charts:- Daily , Weekly | |
| Add CWCO to Watchlist: View: Get Complete CWCO Trend Analysis ➞ | |
 | INST Instructure Holdings, Inc. |
| Sector: Technology | |
| SubSector: Software - Application | |
| MarketCap: 3580 Millions | |
| Recent Price: 19.57 Smart Investing & Trading Score: 42 | |
| Day Percent Change: 0.62% Day Change: 0.12 | |
| Week Change: -0.41% Year-to-date Change: -27.6% | |
| INST Links: Profile News Message Board | |
| Charts:- Daily , Weekly | |
| Add INST to Watchlist: View: Get Complete INST Trend Analysis ➞ | |
 | PX P10, Inc. |
| Sector: Financials | |
| SubSector: Asset Management | |
| MarketCap: 1300 Millions | |
| Recent Price: 7.39 Smart Investing & Trading Score: 46 | |
| Day Percent Change: 0.61% Day Change: 0.04 | |
| Week Change: -0.87% Year-to-date Change: -27.6% | |
| PX Links: Profile News Message Board | |
| Charts:- Daily , Weekly | |
| Add PX to Watchlist: View: Get Complete PX Trend Analysis ➞ | |
 | PRFT Perficient, Inc. |
| Sector: Technology | |
| SubSector: Information Technology Services | |
| MarketCap: 1005.68 Millions | |
| Recent Price: 47.58 Smart Investing & Trading Score: 49 | |
| Day Percent Change: 0.72% Day Change: 0.34 | |
| Week Change: 10.68% Year-to-date Change: -27.7% | |
| PRFT Links: Profile News Message Board | |
| Charts:- Daily , Weekly | |
| Add PRFT to Watchlist: View: Get Complete PRFT Trend Analysis ➞ | |
 | SNFCA Security National Financial Corporation |
| Sector: Financials | |
| SubSector: Credit Services | |
| MarketCap: 81.0208 Millions | |
| Recent Price: 6.50 Smart Investing & Trading Score: 0 | |
| Day Percent Change: 0.00% Day Change: 0.00 | |
| Week Change: -3.27% Year-to-date Change: -27.8% | |
| SNFCA Links: Profile News Message Board | |
| Charts:- Daily , Weekly | |
| Add SNFCA to Watchlist: View: Get Complete SNFCA Trend Analysis ➞ | |
 | SITM SiTime Corporation |
| Sector: Technology | |
| SubSector: Semiconductor - Specialized | |
| MarketCap: 403.76 Millions | |
| Recent Price: 88.03 Smart Investing & Trading Score: 47 | |
| Day Percent Change: 0.87% Day Change: 0.75 | |
| Week Change: -0.85% Year-to-date Change: -27.9% | |
| SITM Links: Profile News Message Board | |
| Charts:- Daily , Weekly | |
| Add SITM to Watchlist: View: Get Complete SITM Trend Analysis ➞ | |
 | SCPH scPharmaceuticals Inc. |
| Sector: Health Care | |
| SubSector: Biotechnology | |
| MarketCap: 136.185 Millions | |
| Recent Price: 4.52 Smart Investing & Trading Score: 42 | |
| Day Percent Change: -0.44% Day Change: -0.02 | |
| Week Change: 0.67% Year-to-date Change: -27.9% | |
| SCPH Links: Profile News Message Board | |
| Charts:- Daily , Weekly | |
| Add SCPH to Watchlist: View: Get Complete SCPH Trend Analysis ➞ | |
 | SST System1, Inc. |
| Sector: Industrials | |
| SubSector: Specialty Business Services | |
| MarketCap: 504 Millions | |
| Recent Price: 1.74 Smart Investing & Trading Score: 41 | |
| Day Percent Change: 0.87% Day Change: 0.02 | |
| Week Change: 0.29% Year-to-date Change: -28.0% | |
| SST Links: Profile News Message Board | |
| Charts:- Daily , Weekly | |
| Add SST to Watchlist: View: Get Complete SST Trend Analysis ➞ | |
 | IRWD Ironwood Pharmaceuticals, Inc. |
| Sector: Health Care | |
| SubSector: Drugs - Generic | |
| MarketCap: 1616.35 Millions | |
| Recent Price: 8.23 Smart Investing & Trading Score: 57 | |
| Day Percent Change: 0.12% Day Change: 0.01 | |
| Week Change: 5.24% Year-to-date Change: -28.1% | |
| IRWD Links: Profile News Message Board | |
| Charts:- Daily , Weekly | |
| Add IRWD to Watchlist: View: Get Complete IRWD Trend Analysis ➞ | |
 | AKTS Akoustis Technologies, Inc. |
| Sector: Technology | |
| SubSector: Communication Equipment | |
| MarketCap: 197.039 Millions | |
| Recent Price: 0.60 Smart Investing & Trading Score: 62 | |
| Day Percent Change: 0.00% Day Change: 0.00 | |
| Week Change: 9.85% Year-to-date Change: -28.1% | |
| AKTS Links: Profile News Message Board | |
| Charts:- Daily , Weekly | |
| Add AKTS to Watchlist: View: Get Complete AKTS Trend Analysis ➞ | |
 | VICR Vicor Corporation |
| Sector: Technology | |
| SubSector: Diversified Electronics | |
| MarketCap: 1526.76 Millions | |
| Recent Price: 32.22 Smart Investing & Trading Score: 10 | |
| Day Percent Change: 1.24% Day Change: 0.40 | |
| Week Change: -6.38% Year-to-date Change: -28.3% | |
| VICR Links: Profile News Message Board | |
| Charts:- Daily , Weekly | |
| Add VICR to Watchlist: View: Get Complete VICR Trend Analysis ➞ | |
 | NYMT New York Mortgage Trust, Inc. |
| Sector: Financials | |
| SubSector: Mortgage Investment | |
| MarketCap: 1038.39 Millions | |
| Recent Price: 6.11 Smart Investing & Trading Score: 43 | |
| Day Percent Change: -12.96% Day Change: -0.91 | |
| Week Change: -13.21% Year-to-date Change: -28.4% | |
| NYMT Links: Profile News Message Board | |
| Charts:- Daily , Weekly | |
| Add NYMT to Watchlist: View: Get Complete NYMT Trend Analysis ➞ | |
 | FLGT Fulgent Genetics, Inc. |
| Sector: Health Care | |
| SubSector: Medical Laboratories & Research | |
| MarketCap: 222.2 Millions | |
| Recent Price: 20.70 Smart Investing & Trading Score: 59 | |
| Day Percent Change: 0.00% Day Change: 0.00 | |
| Week Change: 2.99% Year-to-date Change: -28.4% | |
| FLGT Links: Profile News Message Board | |
| Charts:- Daily , Weekly | |
| Add FLGT to Watchlist: View: Get Complete FLGT Trend Analysis ➞ | |
 | PL Planet Labs PBC |
| Sector: Industrials | |
| SubSector: Aerospace & Defense | |
| MarketCap: 874 Millions | |
| Recent Price: 1.77 Smart Investing & Trading Score: 37 | |
| Day Percent Change: 0.85% Day Change: 0.01 | |
| Week Change: 0.28% Year-to-date Change: -28.4% | |
| PL Links: Profile News Message Board | |
| Charts:- Daily , Weekly | |
| Add PL to Watchlist: View: Get Complete PL Trend Analysis ➞ | |
 | DCOM Dime Community Bancshares, Inc. |
| Sector: Financials | |
| SubSector: Savings & Loans | |
| MarketCap: 477.83 Millions | |
| Recent Price: 19.27 Smart Investing & Trading Score: 86 | |
| Day Percent Change: 1.64% Day Change: 0.31 | |
| Week Change: 1% Year-to-date Change: -28.4% | |
| DCOM Links: Profile News Message Board | |
| Charts:- Daily , Weekly | |
| Add DCOM to Watchlist: View: Get Complete DCOM Trend Analysis ➞ | |
 | PWSC PowerSchool Holdings, Inc. |
| Sector: Technology | |
| SubSector: Software - Application | |
| MarketCap: 3870 Millions | |
| Recent Price: 16.91 Smart Investing & Trading Score: 10 | |
| Day Percent Change: 0.48% Day Change: 0.08 | |
| Week Change: -3.76% Year-to-date Change: -28.5% | |
| PWSC Links: Profile News Message Board | |
| Charts:- Daily , Weekly | |
| Add PWSC to Watchlist: View: Get Complete PWSC Trend Analysis ➞ | |
 | IONQ IonQ, Inc. |
| Sector: Technology | |
| SubSector: Computer Hardware | |
| MarketCap: 2680 Millions | |
| Recent Price: 8.90 Smart Investing & Trading Score: 37 | |
| Day Percent Change: 1.71% Day Change: 0.15 | |
| Week Change: -0.78% Year-to-date Change: -28.6% | |
| IONQ Links: Profile News Message Board | |
| Charts:- Daily , Weekly | |
| Add IONQ to Watchlist: View: Get Complete IONQ Trend Analysis ➞ | |
| Too many stocks? View smallcap stocks filtered by marketcap & sector |
| Marketcap: All SmallCap Stocks (default-no microcap), Large, Mid-Range, Small & MicroCap |
| Sector: Tech, Finance, Energy, Staples, Retail, Industrial, Materials, Utilities & Medical |
|
Best Stocks Today 12Stocks.com |
© 2024 12Stocks.com Terms & Conditions Privacy Contact Us
All Information Provided Only For Education And Not To Be Used For Investing or Trading. See Terms & Conditions


One More Thing ... Get Best Stocks Delivered Daily!
Never Ever Miss A Move With Our Top Ten Stocks Lists
Find Best Stocks In Any Market - Bull or Bear Market
Take A Peek At Our Top Ten Stocks Lists: Daily, Weekly, Year-to-Date & Top Trends
Find Best Stocks In Any Market - Bull or Bear Market
Take A Peek At Our Top Ten Stocks Lists: Daily, Weekly, Year-to-Date & Top Trends
Smallcap Stocks With Best Up Trends [0-bearish to 100-bullish]: Gannett Co[100], Pitney Bowes[100], Sprouts Farmers[100], Herbalife Nutrition[100], Gray Television[100], Surmodics [100], TPI Composites[100], Outbrain [100], Fluence Energy[100], Heartland Financial[100], Mercury General[100]
Best Smallcap Stocks Year-to-Date:
Janux [440.16%], Viking [306.02%], Longboard [258.92%], Alpine Immune[239.44%], Bakkt [187.89%], Avidity Biosciences[184.07%], Vera [170.74%], Cullinan Oncology[169.74%], Arcutis Bio[163.93%], Super Micro[161.15%], Y-mAbs [145.23%] Best Smallcap Stocks This Week:
Emergent BioSolutions[110.94%], Eyenovia [45.27%], P3 Health[38.51%], Aspen Aerogels[37.17%], Origin Materials[36.24%], Cue Biopharma[35.9%], Poseida [34.98%], Enovix [32.07%], Surmodics [31.94%], Phibro Animal[28.44%], TransMedics Group[28.2%] Best Smallcap Stocks Daily:
Emergent BioSolutions[109.84%], Aspen Aerogels[45.11%], Gannett Co[31.12%], Enovix [31.06%], Pitney Bowes[23.87%], Office Properties[22.00%], Pulmonx [20.21%], Perdoceo Education[19.25%], Origin Materials[17.75%], Benchmark Electronics[17.40%], Children s[14.21%]