
 Login Sign Up


| |||||
 |  | ||||

| 12Stocks.com Market Intelligence |
Best SmallCap Stocks
|
| In a hurry? Small Cap Stock Lists: Performance Trends Table, Stock Charts
Sort Small Cap stocks: Daily, Weekly, Year-to-Date, Market Cap & Trends. Filter Small Cap stocks list by sector: Show all, Tech, Finance, Energy, Staples, Retail, Industrial, Materials, Utilities and HealthCare Filter Small Cap stocks list by size: All Large Medium Small and MicroCap |
| 12Stocks.com Small Cap Stocks Performances & Trends Daily | |||||||||
|
|  The overall Smart Investing & Trading Score is 69 (0-bearish to 100-bullish) which puts Small Cap index in short term neutral to bullish trend. The Smart Investing & Trading Score from previous trading session is 49 and hence an improvement of trend.
| ||||||||
Here are the Smart Investing & Trading Scores of the most requested small cap stocks at 12Stocks.com (click stock name for detailed review):
|


| 12Stocks.com: Investing in Smallcap Index with Stocks | |
|
The following table helps investors and traders sort through current performance and trends (as measured by Smart Investing & Trading Score) of various
stocks in the Smallcap Index. Quick View: Move mouse or cursor over stock symbol (ticker) to view short-term technical chart and over stock name to view long term chart. Click on  to add stock symbol to your watchlist and to add stock symbol to your watchlist and  to view watchlist. Click on any ticker or stock name for detailed market intelligence report for that stock. to view watchlist. Click on any ticker or stock name for detailed market intelligence report for that stock. |
12Stocks.com Performance of Stocks in Smallcap Index
| Ticker | Stock Name | Watchlist | Category | Recent Price | Smart Investing & Trading Score | Change % | YTD Change% |
| GOLF | Acushnet |   | Services & Goods | 62.18 | 50 | 0.52% | -1.57% |
| SGH | SMART Global | | Technology | 18.63 | 39 | 0.65% | -1.58% |
| FTDR | frontdoor | | Services & Goods | 34.65 | 100 | 1.85% | -1.62% |
| PKE | Park Aerospace | | Technology | 14.46 | 32 | 0.14% | -1.63% |
| SR | Spire | | Utilities | 61.31 | 75 | -0.60% | -1.65% |
| PMT | PennyMac Mortgage | | Financials | 14.70 | 95 | 1.38% | -1.67% |
| REFI | Chicago Atlantic | | Financials | 15.92 | 64 | 0.76% | -1.67% |
| CASS | Cass Information | | Services & Goods | 44.28 | 49 | 0.68% | -1.71% |
| ITIC | Investors Title | | Financials | 159.34 | 59 | -1.75% | -1.73% |
| RYAM | Rayonier Advanced | | Materials | 3.98 | 68 | 0.76% | -1.73% |
| WTS | Watts Water | | Industrials | 204.69 | 70 | 0.65% | -1.75% |
| CTO | Consolidated-Tomoka Land | | Financials | 17.02 | 33 | -2.58% | -1.79% |
| ANDE | Andersons | | Consumer Staples | 56.51 | 58 | 0.87% | -1.79% |
| EQC | Equity Commonwealth | | Financials | 18.85 | 75 | -1.05% | -1.82% |
| QCRH | QCR | | Financials | 57.29 | 70 | 0.51% | -1.88% |
| CRVL | CorVel | | Financials | 242.51 | 70 | 0.39% | -1.90% |
| PLAY | Dave & Buster s Entertainment | | Services & Goods | 52.82 | 17 | 0.69% | -1.91% |
| FFBC | First Financial | | Financials | 23.29 | 100 | 0.91% | -1.94% |
| CADE | Cadence Ban | | Financials | 29.00 | 93 | 0.94% | -1.99% |
| BATRK | Liberty Braves | | Services & Goods | 38.79 | 57 | 0.62% | -2.00% |
| EHAB | Enhabit | | Health Care | 10.14 | 68 | 0.10% | -2.03% |
| SAVA | Cassava Sciences | | Health Care | 22.05 | 42 | -0.05% | -2.04% |
| HWC | Hancock Whitney | | Financials | 47.57 | 100 | 0.83% | -2.10% |
| THRM | Gentherm | | Consumer Staples | 51.23 | 42 | -0.50% | -2.16% |
| JOE | St. Joe | | Financials | 58.84 | 95 | 1.80% | -2.23% |


| Too many stocks? View smallcap stocks filtered by marketcap & sector |
| Marketcap: All SmallCap Stocks (default-no microcap), Large, Mid-Range, Small |
| Smallcap Sector: Tech, Finance, Energy, Staples, Retail, Industrial, Materials, & Medical |
|
Get the most comprehensive stock market coverage daily at 12Stocks.com ➞ Best Stocks Today ➞ Best Stocks Weekly ➞ Best Stocks Year-to-Date ➞ Best Stocks Trends ➞  Best Stocks Today 12Stocks.com Best Nasdaq Stocks ➞ Best S&P 500 Stocks ➞ Best Tech Stocks ➞ Best Biotech Stocks ➞ |
| Detailed Overview of SmallCap Stocks |
| SmallCap Technical Overview, Leaders & Laggards, Top SmallCap ETF Funds & Detailed SmallCap Stocks List, Charts, Trends & More |
| Smallcap: Technical Analysis, Trends & YTD Performance | |
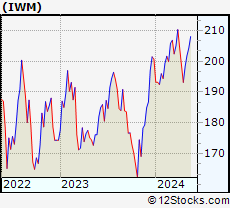
| SmallCap segment as represented by
IWM, an exchange-traded fund [ETF], holds basket of thousands of smallcap stocks from across all major sectors of the US stock market. The smallcap index (contains stocks like Riverbed & Sotheby's) is up by 0.59% and is currently underperforming the overall market by -6.29% year-to-date. Below is a quick view of technical charts and trends: | |
 IWM Weekly Chart |
|
| Long Term Trend: Not Good | |
| Medium Term Trend: Very Good | |
 IWM Daily Chart |
|
| Short Term Trend: Very Good | |
| Overall Trend Score: 69 | |
| YTD Performance: 0.59% | |
| **Trend Scores & Views Are Only For Educational Purposes And Not For Investing | |
| 12Stocks.com: Top Performing Small Cap Index Stocks | ||||||||||||||||||||||||||||||||||||||||||||||||
 The top performing Small Cap Index stocks year to date are
Now, more recently, over last week, the top performing Small Cap Index stocks on the move are


|
||||||||||||||||||||||||||||||||||||||||||||||||
| 12Stocks.com: Investing in Smallcap Index using Exchange Traded Funds | |
|
The following table shows list of key exchange traded funds (ETF) that
help investors track Smallcap index. The following list also includes leveraged ETF funds that track twice or thrice the daily returns of Smallcap indices. Short or inverse ETF funds move in the opposite direction to the index they track and are useful during market pullbacks or during bear markets. Quick View: Move mouse or cursor over ETF symbol (ticker) to view short-term technical chart and over ETF name to view long term chart. Click on ticker or stock name for detailed view. Click on to add stock symbol to your watchlist and to view watchlist. |
12Stocks.com List of ETFs that track Smallcap Index
| Ticker | ETF Name | Watchlist | Recent Price | Smart Investing & Trading Score | Change % | Week % | Year-to-date % |
| IWM | iShares Russell 2000 | | 201.90 | 69 | 0.99 | 1.77 | 0.59% |
| IJR | iShares Core S&P Small-Cap | | 107.13 | 82 | 0.75 | 1.4 | -1.03% |
| VTWO | Vanguard Russell 2000 ETF | | 81.61 | 69 | 0.94 | 1.73 | 0.63% |
| IWN | iShares Russell 2000 Value | | 154.21 | 100 | 0.87 | 2.03 | -0.72% |
| IJS | iShares S&P Small-Cap 600 Value | | 98.72 | 64 | 0.71 | 1.57 | -4.22% |
| IWO | iShares Russell 2000 Growth | | 256.87 | 57 | 0.99 | 1.49 | 1.84% |
| IJT | iShares S&P Small-Cap 600 Growth | | 127.76 | 95 | 0.82 | 1.32 | 2.09% |
| XSLV | PowerShares S&P SmallCap Low Volatil ETF | | 43.22 | 87 | 0.19 | 1.17 | -2.11% |
| SBB | ProShares Short SmallCap600 | | 16.16 | 13 | -1.28 | -1.37 | 1.44% |
| SDD | ProShares UltraShort SmallCap600 | | 18.84 | 23 | -2.41 | -2.61 | 2.27% |
| SAA | ProShares Ultra SmallCap600 | | 23.59 | 69 | 2.86 | 2.39 | -5.45% |
| SMLV | SPDR SSGA US Small Cap Low Volatil ETF | | 109.69 | 87 | 0.78 | 2.01 | -2.52% |
| 12Stocks.com: Charts, Trends, Fundamental Data and Performances of SmallCap Stocks | |
|
We now take in-depth look at all SmallCap stocks including charts, multi-period performances and overall trends (as measured by Smart Investing & Trading Score). One can sort SmallCap stocks (click link to choose) by Daily, Weekly and by Year-to-Date performances. Also, one can sort by size of the company or by market capitalization. |
| Select Your Default Chart Type: | |||||
| |||||
| Click on stock symbol or name for detailed view. Click on to add stock symbol to your watchlist and to view watchlist. Quick View: Move mouse or cursor over "Daily" to quickly view daily technical stock chart and over "Weekly" to view weekly technical stock chart. | |||||

 | GOLF Acushnet Holdings Corp. |
| Sector: Services & Goods | |
| SubSector: Sporting Goods Stores | |
| MarketCap: 1717.74 Millions | |
| Recent Price: 62.18 Smart Investing & Trading Score: 50 | |
| Day Percent Change: 0.52% Day Change: 0.32 | |
| Week Change: -0.08% Year-to-date Change: -1.6% | |
| GOLF Links: Profile News Message Board | |
| Charts:- Daily , Weekly | |
| Add GOLF to Watchlist: View: Get Complete GOLF Trend Analysis ➞ | |
 | SGH SMART Global Holdings, Inc. |
| Sector: Technology | |
| SubSector: Semiconductor- Memory Chips | |
| MarketCap: 657.8 Millions | |
| Recent Price: 18.63 Smart Investing & Trading Score: 39 | |
| Day Percent Change: 0.65% Day Change: 0.12 | |
| Week Change: 1.58% Year-to-date Change: -1.6% | |
| SGH Links: Profile News Message Board | |
| Charts:- Daily , Weekly | |
| Add SGH to Watchlist: View: Get Complete SGH Trend Analysis ➞ | |
 | FTDR frontdoor, inc. |
| Sector: Services & Goods | |
| SubSector: Business Services | |
| MarketCap: 2974.22 Millions | |
| Recent Price: 34.65 Smart Investing & Trading Score: 100 | |
| Day Percent Change: 1.85% Day Change: 0.63 | |
| Week Change: 11.59% Year-to-date Change: -1.6% | |
| FTDR Links: Profile News Message Board | |
| Charts:- Daily , Weekly | |
| Add FTDR to Watchlist: View: Get Complete FTDR Trend Analysis ➞ | |
 | PKE Park Aerospace Corp. |
| Sector: Technology | |
| SubSector: Semiconductor Equipment & Materials | |
| MarketCap: 229.018 Millions | |
| Recent Price: 14.46 Smart Investing & Trading Score: 32 | |
| Day Percent Change: 0.14% Day Change: 0.02 | |
| Week Change: -2.03% Year-to-date Change: -1.6% | |
| PKE Links: Profile News Message Board | |
| Charts:- Daily , Weekly | |
| Add PKE to Watchlist: View: Get Complete PKE Trend Analysis ➞ | |
 | SR Spire Inc. |
| Sector: Utilities | |
| SubSector: Gas Utilities | |
| MarketCap: 3745.87 Millions | |
| Recent Price: 61.31 Smart Investing & Trading Score: 75 | |
| Day Percent Change: -0.60% Day Change: -0.37 | |
| Week Change: -0.15% Year-to-date Change: -1.7% | |
| SR Links: Profile News Message Board | |
| Charts:- Daily , Weekly | |
| Add SR to Watchlist: View: Get Complete SR Trend Analysis ➞ | |
 | PMT PennyMac Mortgage Investment Trust |
| Sector: Financials | |
| SubSector: Mortgage Investment | |
| MarketCap: 917.639 Millions | |
| Recent Price: 14.70 Smart Investing & Trading Score: 95 | |
| Day Percent Change: 1.38% Day Change: 0.20 | |
| Week Change: 4.26% Year-to-date Change: -1.7% | |
| PMT Links: Profile News Message Board | |
| Charts:- Daily , Weekly | |
| Add PMT to Watchlist: View: Get Complete PMT Trend Analysis ➞ | |
 | REFI Chicago Atlantic Financials Finance, Inc. |
| Sector: Financials | |
| SubSector: REIT - Mortgage | |
| MarketCap: 285 Millions | |
| Recent Price: 15.92 Smart Investing & Trading Score: 64 | |
| Day Percent Change: 0.76% Day Change: 0.12 | |
| Week Change: 1.73% Year-to-date Change: -1.7% | |
| REFI Links: Profile News Message Board | |
| Charts:- Daily , Weekly | |
| Add REFI to Watchlist: View: Get Complete REFI Trend Analysis ➞ | |
 | CASS Cass Information Systems, Inc. |
| Sector: Services & Goods | |
| SubSector: Business Services | |
| MarketCap: 477.382 Millions | |
| Recent Price: 44.28 Smart Investing & Trading Score: 49 | |
| Day Percent Change: 0.68% Day Change: 0.30 | |
| Week Change: 1.51% Year-to-date Change: -1.7% | |
| CASS Links: Profile News Message Board | |
| Charts:- Daily , Weekly | |
| Add CASS to Watchlist: View: Get Complete CASS Trend Analysis ➞ | |
 | ITIC Investors Title Company |
| Sector: Financials | |
| SubSector: Surety & Title Insurance | |
| MarketCap: 219.518 Millions | |
| Recent Price: 159.34 Smart Investing & Trading Score: 59 | |
| Day Percent Change: -1.75% Day Change: -2.84 | |
| Week Change: -0.01% Year-to-date Change: -1.7% | |
| ITIC Links: Profile News Message Board | |
| Charts:- Daily , Weekly | |
| Add ITIC to Watchlist: View: Get Complete ITIC Trend Analysis ➞ | |
 | RYAM Rayonier Advanced Materials Inc. |
| Sector: Materials | |
| SubSector: Chemicals - Major Diversified | |
| MarketCap: 116.736 Millions | |
| Recent Price: 3.98 Smart Investing & Trading Score: 68 | |
| Day Percent Change: 0.76% Day Change: 0.03 | |
| Week Change: 2.31% Year-to-date Change: -1.7% | |
| RYAM Links: Profile News Message Board | |
| Charts:- Daily , Weekly | |
| Add RYAM to Watchlist: View: Get Complete RYAM Trend Analysis ➞ | |
 | WTS Watts Water Technologies, Inc. |
| Sector: Industrials | |
| SubSector: Industrial Equipment & Components | |
| MarketCap: 2903.29 Millions | |
| Recent Price: 204.69 Smart Investing & Trading Score: 70 | |
| Day Percent Change: 0.65% Day Change: 1.33 | |
| Week Change: 1.58% Year-to-date Change: -1.8% | |
| WTS Links: Profile News Message Board | |
| Charts:- Daily , Weekly | |
| Add WTS to Watchlist: View: Get Complete WTS Trend Analysis ➞ | |
 | CTO Consolidated-Tomoka Land Co. |
| Sector: Financials | |
| SubSector: Real Estate Development | |
| MarketCap: 205.119 Millions | |
| Recent Price: 17.02 Smart Investing & Trading Score: 33 | |
| Day Percent Change: -2.58% Day Change: -0.45 | |
| Week Change: -0.64% Year-to-date Change: -1.8% | |
| CTO Links: Profile News Message Board | |
| Charts:- Daily , Weekly | |
| Add CTO to Watchlist: View: Get Complete CTO Trend Analysis ➞ | |
 | ANDE The Andersons, Inc. |
| Sector: Consumer Staples | |
| SubSector: Farm Products | |
| MarketCap: 630.887 Millions | |
| Recent Price: 56.51 Smart Investing & Trading Score: 58 | |
| Day Percent Change: 0.87% Day Change: 0.49 | |
| Week Change: -0.7% Year-to-date Change: -1.8% | |
| ANDE Links: Profile News Message Board | |
| Charts:- Daily , Weekly | |
| Add ANDE to Watchlist: View: Get Complete ANDE Trend Analysis ➞ | |
 | EQC Equity Commonwealth |
| Sector: Financials | |
| SubSector: REIT - Office | |
| MarketCap: 3659.36 Millions | |
| Recent Price: 18.85 Smart Investing & Trading Score: 75 | |
| Day Percent Change: -1.05% Day Change: -0.20 | |
| Week Change: 1.34% Year-to-date Change: -1.8% | |
| EQC Links: Profile News Message Board | |
| Charts:- Daily , Weekly | |
| Add EQC to Watchlist: View: Get Complete EQC Trend Analysis ➞ | |
 | QCRH QCR Holdings, Inc. |
| Sector: Financials | |
| SubSector: Regional - Southwest Banks | |
| MarketCap: 465.765 Millions | |
| Recent Price: 57.29 Smart Investing & Trading Score: 70 | |
| Day Percent Change: 0.51% Day Change: 0.29 | |
| Week Change: 1.92% Year-to-date Change: -1.9% | |
| QCRH Links: Profile News Message Board | |
| Charts:- Daily , Weekly | |
| Add QCRH to Watchlist: View: Get Complete QCRH Trend Analysis ➞ | |
 | CRVL CorVel Corporation |
| Sector: Financials | |
| SubSector: Insurance Brokers | |
| MarketCap: 1090.67 Millions | |
| Recent Price: 242.51 Smart Investing & Trading Score: 70 | |
| Day Percent Change: 0.39% Day Change: 0.94 | |
| Week Change: 1.62% Year-to-date Change: -1.9% | |
| CRVL Links: Profile News Message Board | |
| Charts:- Daily , Weekly | |
| Add CRVL to Watchlist: View: Get Complete CRVL Trend Analysis ➞ | |
 | PLAY Dave & Buster s Entertainment, Inc. |
| Sector: Services & Goods | |
| SubSector: Restaurants | |
| MarketCap: 283.07 Millions | |
| Recent Price: 52.82 Smart Investing & Trading Score: 17 | |
| Day Percent Change: 0.69% Day Change: 0.36 | |
| Week Change: 1.25% Year-to-date Change: -1.9% | |
| PLAY Links: Profile News Message Board | |
| Charts:- Daily , Weekly | |
| Add PLAY to Watchlist: View: Get Complete PLAY Trend Analysis ➞ | |
 | FFBC First Financial Bancorp. |
| Sector: Financials | |
| SubSector: Regional - Midwest Banks | |
| MarketCap: 1363.7 Millions | |
| Recent Price: 23.29 Smart Investing & Trading Score: 100 | |
| Day Percent Change: 0.91% Day Change: 0.21 | |
| Week Change: 3.19% Year-to-date Change: -1.9% | |
| FFBC Links: Profile News Message Board | |
| Charts:- Daily , Weekly | |
| Add FFBC to Watchlist: View: Get Complete FFBC Trend Analysis ➞ | |
 | CADE Cadence Bancorporation |
| Sector: Financials | |
| SubSector: Regional - Southeast Banks | |
| MarketCap: 756.335 Millions | |
| Recent Price: 29.00 Smart Investing & Trading Score: 93 | |
| Day Percent Change: 0.94% Day Change: 0.27 | |
| Week Change: -0.07% Year-to-date Change: -2.0% | |
| CADE Links: Profile News Message Board | |
| Charts:- Daily , Weekly | |
| Add CADE to Watchlist: View: Get Complete CADE Trend Analysis ➞ | |
 | BATRK The Liberty Braves Group |
| Sector: Services & Goods | |
| SubSector: Broadcasting - TV | |
| MarketCap: 638.363 Millions | |
| Recent Price: 38.79 Smart Investing & Trading Score: 57 | |
| Day Percent Change: 0.62% Day Change: 0.24 | |
| Week Change: 1.57% Year-to-date Change: -2.0% | |
| BATRK Links: Profile News Message Board | |
| Charts:- Daily , Weekly | |
| Add BATRK to Watchlist: View: Get Complete BATRK Trend Analysis ➞ | |
 | EHAB Enhabit, Inc. |
| Sector: Health Care | |
| SubSector: Medical Care Facilities | |
| MarketCap: 569 Millions | |
| Recent Price: 10.14 Smart Investing & Trading Score: 68 | |
| Day Percent Change: 0.10% Day Change: 0.01 | |
| Week Change: 1.1% Year-to-date Change: -2.0% | |
| EHAB Links: Profile News Message Board | |
| Charts:- Daily , Weekly | |
| Add EHAB to Watchlist: View: Get Complete EHAB Trend Analysis ➞ | |
 | SAVA Cassava Sciences, Inc. |
| Sector: Health Care | |
| SubSector: Biotechnology | |
| MarketCap: 86.6785 Millions | |
| Recent Price: 22.05 Smart Investing & Trading Score: 42 | |
| Day Percent Change: -0.05% Day Change: -0.01 | |
| Week Change: -1.3% Year-to-date Change: -2.0% | |
| SAVA Links: Profile News Message Board | |
| Charts:- Daily , Weekly | |
| Add SAVA to Watchlist: View: Get Complete SAVA Trend Analysis ➞ | |
 | HWC Hancock Whitney Corporation |
| Sector: Financials | |
| SubSector: Regional - Southeast Banks | |
| MarketCap: 1438.55 Millions | |
| Recent Price: 47.57 Smart Investing & Trading Score: 100 | |
| Day Percent Change: 0.83% Day Change: 0.39 | |
| Week Change: 1.78% Year-to-date Change: -2.1% | |
| HWC Links: Profile News Message Board | |
| Charts:- Daily , Weekly | |
| Add HWC to Watchlist: View: Get Complete HWC Trend Analysis ➞ | |
 | THRM Gentherm Incorporated |
| Sector: Consumer Staples | |
| SubSector: Auto Parts | |
| MarketCap: 1032.59 Millions | |
| Recent Price: 51.23 Smart Investing & Trading Score: 42 | |
| Day Percent Change: -0.50% Day Change: -0.26 | |
| Week Change: 1.27% Year-to-date Change: -2.2% | |
| THRM Links: Profile News Message Board | |
| Charts:- Daily , Weekly | |
| Add THRM to Watchlist: View: Get Complete THRM Trend Analysis ➞ | |
 | JOE The St. Joe Company |
| Sector: Financials | |
| SubSector: Real Estate Development | |
| MarketCap: 1029.39 Millions | |
| Recent Price: 58.84 Smart Investing & Trading Score: 95 | |
| Day Percent Change: 1.80% Day Change: 1.04 | |
| Week Change: 0.53% Year-to-date Change: -2.2% | |
| JOE Links: Profile News Message Board | |
| Charts:- Daily , Weekly | |
| Add JOE to Watchlist: View: Get Complete JOE Trend Analysis ➞ | |
| Too many stocks? View smallcap stocks filtered by marketcap & sector |
| Marketcap: All SmallCap Stocks (default-no microcap), Large, Mid-Range, Small & MicroCap |
| Sector: Tech, Finance, Energy, Staples, Retail, Industrial, Materials, Utilities & Medical |
|
Best Stocks Today 12Stocks.com |
© 2024 12Stocks.com Terms & Conditions Privacy Contact Us
All Information Provided Only For Education And Not To Be Used For Investing or Trading. See Terms & Conditions


One More Thing ... Get Best Stocks Delivered Daily!
Never Ever Miss A Move With Our Top Ten Stocks Lists
Find Best Stocks In Any Market - Bull or Bear Market
Take A Peek At Our Top Ten Stocks Lists: Daily, Weekly, Year-to-Date & Top Trends
Find Best Stocks In Any Market - Bull or Bear Market
Take A Peek At Our Top Ten Stocks Lists: Daily, Weekly, Year-to-Date & Top Trends
Smallcap Stocks With Best Up Trends [0-bearish to 100-bullish]: Twist Bioscience[100], WideOpenWest [100], Joint [100], FTC Solar[100], Origin Materials[100], Alignment Healthcare[100], Clarus [100], IES [100], Emergent BioSolutions[100], Enovix [100], El Pollo[100]
Best Smallcap Stocks Year-to-Date:
Janux [482.74%], Viking [313.59%], Longboard [272.5%], Alpine Immune[239.29%], Bakkt [199.55%], Avidity Biosciences[192.48%], Vera [189.47%], Cullinan Oncology[176.9%], Super Micro[175.35%], Y-mAbs [151.47%], Sana [149.33%] Best Smallcap Stocks This Week:
Emergent BioSolutions[102.6%], Deciphera [73.24%], Origin Materials[66.52%], Eyenovia [60.78%], Cue Biopharma[56.04%], Aspen Aerogels[55.96%], Enovix [54.02%], Luna Innovations[53.77%], Codexis [47.37%], Carvana Co[44.31%], Office Properties[42.79%] Best Smallcap Stocks Daily:
Luna Innovations[36.00%], Twist Bioscience[28.74%], Ardelyx [28.42%], WideOpenWest [28.23%], 2U [26.63%], Joint [25.35%], FTC Solar[25.09%], Origin Materials[22.23%], Alignment Healthcare[21.97%], Clarus [18.67%], Aurora Innovation[18.09%]