
 Login Sign Up


| |||||
 |  | ||||

| 12Stocks.com Market Intelligence |
Best SmallCap Stocks
|
| In a hurry? Small Cap Stock Lists: Performance Trends Table, Stock Charts
Sort Small Cap stocks: Daily, Weekly, Year-to-Date, Market Cap & Trends. Filter Small Cap stocks list by sector: Show all, Tech, Finance, Energy, Staples, Retail, Industrial, Materials, Utilities and HealthCare Filter Small Cap stocks list by size: All Large Medium Small and MicroCap |
| 12Stocks.com Small Cap Stocks Performances & Trends Daily | |||||||||
|
|  The overall Smart Investing & Trading Score is 82 (0-bearish to 100-bullish) which puts Small Cap index in short term bullish trend. The Smart Investing & Trading Score from previous trading session is 49 and hence an improvement of trend.
| ||||||||
Here are the Smart Investing & Trading Scores of the most requested small cap stocks at 12Stocks.com (click stock name for detailed review):
|


| 12Stocks.com: Investing in Smallcap Index with Stocks | |
|
The following table helps investors and traders sort through current performance and trends (as measured by Smart Investing & Trading Score) of various
stocks in the Smallcap Index. Quick View: Move mouse or cursor over stock symbol (ticker) to view short-term technical chart and over stock name to view long term chart. Click on  to add stock symbol to your watchlist and to add stock symbol to your watchlist and  to view watchlist. Click on any ticker or stock name for detailed market intelligence report for that stock. to view watchlist. Click on any ticker or stock name for detailed market intelligence report for that stock. |
12Stocks.com Performance of Stocks in Smallcap Index
| Ticker | Stock Name | Watchlist | Category | Recent Price | Smart Investing & Trading Score | Change % | YTD Change% |
| ACIW | ACI Worldwide |   | Technology | 35.42 | 95 | -0.11% | 15.75% |
| LANC | Lancaster Colony | | Consumer Staples | 192.46 | 32 | 0.24% | 15.67% |
| BTMD | biote | | Health Care | 5.74 | 49 | 2.78% | 15.63% |
| LRN | K12 | | Services & Goods | 68.62 | 83 | 0.45% | 15.58% |
| GVA | Granite Construction | | Industrials | 58.75 | 95 | 2.60% | 15.51% |
| GRND | Grindr | | Technology | 10.35 | 70 | 1.17% | 15.51% |
| MBC | MasterBrand | | Services & Goods | 17.23 | 17 | 1.71% | 15.44% |
| NGVT | Ingevity | | Materials | 54.47 | 100 | -0.60% | 15.35% |
| GES | Guess | | Services & Goods | 26.59 | 58 | 1.22% | 15.31% |
| CMPX | Compass | | Health Care | 1.77 | 74 | 7.27% | 15.31% |
| BASE | Couchbase | | Technology | 26.28 | 57 | 5.71% | 15.31% |
| GMS | GMS | | Industrials | 95.02 | 65 | 0.32% | 15.27% |
| XNCR | Xencor | | Health Care | 24.46 | 100 | 3.51% | 15.21% |
| NHI | National Health | | Financials | 64.27 | 100 | -0.26% | 15.08% |
| RCKY | Rocky Brands | | Consumer Staples | 34.72 | 86 | 2.12% | 15.04% |
| SLG | SL Green | | Financials | 51.95 | 95 | -0.32% | 15.00% |
| OSPN | OneSpan | | Technology | 12.32 | 83 | 12.51% | 14.93% |
| AEO | American Eagle | | Services & Goods | 24.30 | 90 | -0.69% | 14.84% |
| PSFE | Paysafe | | Technology | 14.81 | 42 | 3.35% | 14.81% |
| HMN | Horace Mann | | Financials | 37.52 | 100 | -0.87% | 14.74% |
| BRY | Berry | | Energy | 8.06 | 36 | 0.31% | 14.72% |
| BRP | BRP Group | | Financials | 27.54 | 42 | 0.88% | 14.65% |
| PBH | Prestige Consumer | | Health Care | 70.18 | 68 | -1.52% | 14.64% |
| TNC | Tennant | | Industrials | 106.24 | 44 | -8.18% | 14.62% |
| AAON | AAON | | Industrials | 84.54 | 51 | -6.99% | 14.44% |


| Too many stocks? View smallcap stocks filtered by marketcap & sector |
| Marketcap: All SmallCap Stocks (default-no microcap), Large, Mid-Range, Small |
| Smallcap Sector: Tech, Finance, Energy, Staples, Retail, Industrial, Materials, & Medical |
|
Get the most comprehensive stock market coverage daily at 12Stocks.com ➞ Best Stocks Today ➞ Best Stocks Weekly ➞ Best Stocks Year-to-Date ➞ Best Stocks Trends ➞  Best Stocks Today 12Stocks.com Best Nasdaq Stocks ➞ Best S&P 500 Stocks ➞ Best Tech Stocks ➞ Best Biotech Stocks ➞ |
| Detailed Overview of SmallCap Stocks |
| SmallCap Technical Overview, Leaders & Laggards, Top SmallCap ETF Funds & Detailed SmallCap Stocks List, Charts, Trends & More |
| Smallcap: Technical Analysis, Trends & YTD Performance | |
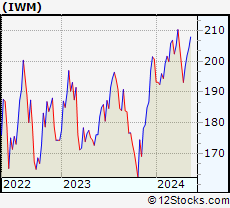
| SmallCap segment as represented by
IWM, an exchange-traded fund [ETF], holds basket of thousands of smallcap stocks from across all major sectors of the US stock market. The smallcap index (contains stocks like Riverbed & Sotheby's) is up by 0.22% and is currently underperforming the overall market by -6.27% year-to-date. Below is a quick view of technical charts and trends: | |
 IWM Weekly Chart |
|
| Long Term Trend: Deteriorating | |
| Medium Term Trend: Very Good | |
 IWM Daily Chart |
|
| Short Term Trend: Very Good | |
| Overall Trend Score: 82 | |
| YTD Performance: 0.22% | |
| **Trend Scores & Views Are Only For Educational Purposes And Not For Investing | |
| 12Stocks.com: Top Performing Small Cap Index Stocks | ||||||||||||||||||||||||||||||||||||||||||||||||
 The top performing Small Cap Index stocks year to date are
Now, more recently, over last week, the top performing Small Cap Index stocks on the move are


|
||||||||||||||||||||||||||||||||||||||||||||||||
| 12Stocks.com: Investing in Smallcap Index using Exchange Traded Funds | |
|
The following table shows list of key exchange traded funds (ETF) that
help investors track Smallcap index. The following list also includes leveraged ETF funds that track twice or thrice the daily returns of Smallcap indices. Short or inverse ETF funds move in the opposite direction to the index they track and are useful during market pullbacks or during bear markets. Quick View: Move mouse or cursor over ETF symbol (ticker) to view short-term technical chart and over ETF name to view long term chart. Click on ticker or stock name for detailed view. Click on to add stock symbol to your watchlist and to view watchlist. |
12Stocks.com List of ETFs that track Smallcap Index
| Ticker | ETF Name | Watchlist | Recent Price | Smart Investing & Trading Score | Change % | Week % | Year-to-date % |
| IWM | iShares Russell 2000 | | 201.15 | 82 | 0.61 | 1.39 | 0.22% |
| IJR | iShares Core S&P Small-Cap | | 106.83 | 50 | 0.47 | 1.12 | -1.31% |
| SDD | ProShares UltraShort SmallCap600 | | 18.35 | 56 | -4.97 | -5.17 | -0.42% |
| SBB | ProShares Short SmallCap600 | | 16.33 | 49 | -0.25 | -0.34 | 2.51% |
| SAA | ProShares Ultra SmallCap600 | | 23.93 | 49 | 4.36 | 3.88 | -4.07% |
| 12Stocks.com: Charts, Trends, Fundamental Data and Performances of SmallCap Stocks | |
|
We now take in-depth look at all SmallCap stocks including charts, multi-period performances and overall trends (as measured by Smart Investing & Trading Score). One can sort SmallCap stocks (click link to choose) by Daily, Weekly and by Year-to-Date performances. Also, one can sort by size of the company or by market capitalization. |
| Select Your Default Chart Type: | |||||
| |||||
| Click on stock symbol or name for detailed view. Click on to add stock symbol to your watchlist and to view watchlist. Quick View: Move mouse or cursor over "Daily" to quickly view daily technical stock chart and over "Weekly" to view weekly technical stock chart. | |||||

 | ACIW ACI Worldwide, Inc. |
| Sector: Technology | |
| SubSector: Technical & System Software | |
| MarketCap: 2645.7 Millions | |
| Recent Price: 35.42 Smart Investing & Trading Score: 95 | |
| Day Percent Change: -0.11% Day Change: -0.04 | |
| Week Change: 6.37% Year-to-date Change: 15.8% | |
| ACIW Links: Profile News Message Board | |
| Charts:- Daily , Weekly | |
| Add ACIW to Watchlist: View: Get Complete ACIW Trend Analysis ➞ | |
 | LANC Lancaster Colony Corporation |
| Sector: Consumer Staples | |
| SubSector: Food - Major Diversified | |
| MarketCap: 4060.83 Millions | |
| Recent Price: 192.46 Smart Investing & Trading Score: 32 | |
| Day Percent Change: 0.24% Day Change: 0.46 | |
| Week Change: 2.9% Year-to-date Change: 15.7% | |
| LANC Links: Profile News Message Board | |
| Charts:- Daily , Weekly | |
| Add LANC to Watchlist: View: Get Complete LANC Trend Analysis ➞ | |
 | BTMD biote Corp. |
| Sector: Health Care | |
| SubSector: Medical Care Facilities | |
| MarketCap: 468 Millions | |
| Recent Price: 5.74 Smart Investing & Trading Score: 49 | |
| Day Percent Change: 2.78% Day Change: 0.16 | |
| Week Change: 3.89% Year-to-date Change: 15.6% | |
| BTMD Links: Profile News Message Board | |
| Charts:- Daily , Weekly | |
| Add BTMD to Watchlist: View: Get Complete BTMD Trend Analysis ➞ | |
 | LRN K12 Inc. |
| Sector: Services & Goods | |
| SubSector: Education & Training Services | |
| MarketCap: 549.606 Millions | |
| Recent Price: 68.62 Smart Investing & Trading Score: 83 | |
| Day Percent Change: 0.45% Day Change: 0.31 | |
| Week Change: 2.3% Year-to-date Change: 15.6% | |
| LRN Links: Profile News Message Board | |
| Charts:- Daily , Weekly | |
| Add LRN to Watchlist: View: Get Complete LRN Trend Analysis ➞ | |
 | GVA Granite Construction Incorporated |
| Sector: Industrials | |
| SubSector: Heavy Construction | |
| MarketCap: 725.895 Millions | |
| Recent Price: 58.75 Smart Investing & Trading Score: 95 | |
| Day Percent Change: 2.60% Day Change: 1.49 | |
| Week Change: 5.8% Year-to-date Change: 15.5% | |
| GVA Links: Profile News Message Board | |
| Charts:- Daily , Weekly | |
| Add GVA to Watchlist: View: Get Complete GVA Trend Analysis ➞ | |
 | GRND Grindr Inc. |
| Sector: Technology | |
| SubSector: Software - Application | |
| MarketCap: 929 Millions | |
| Recent Price: 10.35 Smart Investing & Trading Score: 70 | |
| Day Percent Change: 1.17% Day Change: 0.12 | |
| Week Change: 4.65% Year-to-date Change: 15.5% | |
| GRND Links: Profile News Message Board | |
| Charts:- Daily , Weekly | |
| Add GRND to Watchlist: View: Get Complete GRND Trend Analysis ➞ | |
 | MBC MasterBrand, Inc. |
| Sector: Services & Goods | |
| SubSector: Furnishings, Fixtures & Appliances | |
| MarketCap: 1480 Millions | |
| Recent Price: 17.23 Smart Investing & Trading Score: 17 | |
| Day Percent Change: 1.71% Day Change: 0.29 | |
| Week Change: 1.12% Year-to-date Change: 15.4% | |
| MBC Links: Profile News Message Board | |
| Charts:- Daily , Weekly | |
| Add MBC to Watchlist: View: Get Complete MBC Trend Analysis ➞ | |
 | NGVT Ingevity Corporation |
| Sector: Materials | |
| SubSector: Specialty Chemicals | |
| MarketCap: 1325.47 Millions | |
| Recent Price: 54.47 Smart Investing & Trading Score: 100 | |
| Day Percent Change: -0.60% Day Change: -0.33 | |
| Week Change: 12.29% Year-to-date Change: 15.4% | |
| NGVT Links: Profile News Message Board | |
| Charts:- Daily , Weekly | |
| Add NGVT to Watchlist: View: Get Complete NGVT Trend Analysis ➞ | |
 | GES Guess , Inc. |
| Sector: Services & Goods | |
| SubSector: Apparel Stores | |
| MarketCap: 591.908 Millions | |
| Recent Price: 26.59 Smart Investing & Trading Score: 58 | |
| Day Percent Change: 1.22% Day Change: 0.32 | |
| Week Change: 1.37% Year-to-date Change: 15.3% | |
| GES Links: Profile News Message Board | |
| Charts:- Daily , Weekly | |
| Add GES to Watchlist: View: Get Complete GES Trend Analysis ➞ | |
 | CMPX Compass Therapeutics, Inc. |
| Sector: Health Care | |
| SubSector: Biotechnology | |
| MarketCap: 406 Millions | |
| Recent Price: 1.77 Smart Investing & Trading Score: 74 | |
| Day Percent Change: 7.27% Day Change: 0.12 | |
| Week Change: 22.07% Year-to-date Change: 15.3% | |
| CMPX Links: Profile News Message Board | |
| Charts:- Daily , Weekly | |
| Add CMPX to Watchlist: View: Get Complete CMPX Trend Analysis ➞ | |
 | BASE Couchbase, Inc. |
| Sector: Technology | |
| SubSector: Software - Infrastructure | |
| MarketCap: 724 Millions | |
| Recent Price: 26.28 Smart Investing & Trading Score: 57 | |
| Day Percent Change: 5.71% Day Change: 1.42 | |
| Week Change: 3.18% Year-to-date Change: 15.3% | |
| BASE Links: Profile News Message Board | |
| Charts:- Daily , Weekly | |
| Add BASE to Watchlist: View: Get Complete BASE Trend Analysis ➞ | |
 | GMS GMS Inc. |
| Sector: Industrials | |
| SubSector: General Building Materials | |
| MarketCap: 587.753 Millions | |
| Recent Price: 95.02 Smart Investing & Trading Score: 65 | |
| Day Percent Change: 0.32% Day Change: 0.30 | |
| Week Change: 2.29% Year-to-date Change: 15.3% | |
| GMS Links: Profile News Message Board | |
| Charts:- Daily , Weekly | |
| Add GMS to Watchlist: View: Get Complete GMS Trend Analysis ➞ | |
 | XNCR Xencor, Inc. |
| Sector: Health Care | |
| SubSector: Biotechnology | |
| MarketCap: 1744.35 Millions | |
| Recent Price: 24.46 Smart Investing & Trading Score: 100 | |
| Day Percent Change: 3.51% Day Change: 0.83 | |
| Week Change: 22.42% Year-to-date Change: 15.2% | |
| XNCR Links: Profile News Message Board | |
| Charts:- Daily , Weekly | |
| Add XNCR to Watchlist: View: Get Complete XNCR Trend Analysis ➞ | |
 | NHI National Health Investors, Inc. |
| Sector: Financials | |
| SubSector: REIT - Healthcare Facilities | |
| MarketCap: 2156.54 Millions | |
| Recent Price: 64.27 Smart Investing & Trading Score: 100 | |
| Day Percent Change: -0.26% Day Change: -0.17 | |
| Week Change: 2.19% Year-to-date Change: 15.1% | |
| NHI Links: Profile News Message Board | |
| Charts:- Daily , Weekly | |
| Add NHI to Watchlist: View: Get Complete NHI Trend Analysis ➞ | |
 | RCKY Rocky Brands, Inc. |
| Sector: Consumer Staples | |
| SubSector: Textile - Apparel Footwear & Accessories | |
| MarketCap: 137.47 Millions | |
| Recent Price: 34.72 Smart Investing & Trading Score: 86 | |
| Day Percent Change: 2.12% Day Change: 0.72 | |
| Week Change: 31.07% Year-to-date Change: 15.0% | |
| RCKY Links: Profile News Message Board | |
| Charts:- Daily , Weekly | |
| Add RCKY to Watchlist: View: Get Complete RCKY Trend Analysis ➞ | |
 | SLG SL Green Realty Corp. |
| Sector: Financials | |
| SubSector: REIT - Retail | |
| MarketCap: 4048.14 Millions | |
| Recent Price: 51.95 Smart Investing & Trading Score: 95 | |
| Day Percent Change: -0.32% Day Change: -0.16 | |
| Week Change: 2.64% Year-to-date Change: 15.0% | |
| SLG Links: Profile News Message Board | |
| Charts:- Daily , Weekly | |
| Add SLG to Watchlist: View: Get Complete SLG Trend Analysis ➞ | |
 | OSPN OneSpan Inc. |
| Sector: Technology | |
| SubSector: Application Software | |
| MarketCap: 657.762 Millions | |
| Recent Price: 12.32 Smart Investing & Trading Score: 83 | |
| Day Percent Change: 12.51% Day Change: 1.37 | |
| Week Change: 14.18% Year-to-date Change: 14.9% | |
| OSPN Links: Profile News Message Board | |
| Charts:- Daily , Weekly | |
| Add OSPN to Watchlist: View: Get Complete OSPN Trend Analysis ➞ | |
 | AEO American Eagle Outfitters, Inc. |
| Sector: Services & Goods | |
| SubSector: Apparel Stores | |
| MarketCap: 1577.08 Millions | |
| Recent Price: 24.30 Smart Investing & Trading Score: 90 | |
| Day Percent Change: -0.69% Day Change: -0.17 | |
| Week Change: -0.37% Year-to-date Change: 14.8% | |
| AEO Links: Profile News Message Board | |
| Charts:- Daily , Weekly | |
| Add AEO to Watchlist: View: Get Complete AEO Trend Analysis ➞ | |
 | PSFE Paysafe Limited |
| Sector: Technology | |
| SubSector: Software - Infrastructure | |
| MarketCap: 605 Millions | |
| Recent Price: 14.81 Smart Investing & Trading Score: 42 | |
| Day Percent Change: 3.35% Day Change: 0.48 | |
| Week Change: 2.42% Year-to-date Change: 14.8% | |
| PSFE Links: Profile News Message Board | |
| Charts:- Daily , Weekly | |
| Add PSFE to Watchlist: View: Get Complete PSFE Trend Analysis ➞ | |
 | HMN Horace Mann Educators Corporation |
| Sector: Financials | |
| SubSector: Property & Casualty Insurance | |
| MarketCap: 1545.52 Millions | |
| Recent Price: 37.52 Smart Investing & Trading Score: 100 | |
| Day Percent Change: -0.87% Day Change: -0.33 | |
| Week Change: 2.12% Year-to-date Change: 14.7% | |
| HMN Links: Profile News Message Board | |
| Charts:- Daily , Weekly | |
| Add HMN to Watchlist: View: Get Complete HMN Trend Analysis ➞ | |
 | BRY Berry Corporation |
| Sector: Energy | |
| SubSector: Independent Oil & Gas | |
| MarketCap: 254.793 Millions | |
| Recent Price: 8.06 Smart Investing & Trading Score: 36 | |
| Day Percent Change: 0.31% Day Change: 0.03 | |
| Week Change: -7.72% Year-to-date Change: 14.7% | |
| BRY Links: Profile News Message Board | |
| Charts:- Daily , Weekly | |
| Add BRY to Watchlist: View: Get Complete BRY Trend Analysis ➞ | |
 | BRP BRP Group, Inc. |
| Sector: Financials | |
| SubSector: Real Estate Development | |
| MarketCap: 741.219 Millions | |
| Recent Price: 27.54 Smart Investing & Trading Score: 42 | |
| Day Percent Change: 0.88% Day Change: 0.24 | |
| Week Change: 3.15% Year-to-date Change: 14.7% | |
| BRP Links: Profile News Message Board | |
| Charts:- Daily , Weekly | |
| Add BRP to Watchlist: View: Get Complete BRP Trend Analysis ➞ | |
 | PBH Prestige Consumer Healthcare Inc. |
| Sector: Health Care | |
| SubSector: Medical Appliances & Equipment | |
| MarketCap: 1639.6 Millions | |
| Recent Price: 70.18 Smart Investing & Trading Score: 68 | |
| Day Percent Change: -1.52% Day Change: -1.08 | |
| Week Change: -0.41% Year-to-date Change: 14.6% | |
| PBH Links: Profile News Message Board | |
| Charts:- Daily , Weekly | |
| Add PBH to Watchlist: View: Get Complete PBH Trend Analysis ➞ | |
 | TNC Tennant Company |
| Sector: Industrials | |
| SubSector: Diversified Machinery | |
| MarketCap: 1097.96 Millions | |
| Recent Price: 106.24 Smart Investing & Trading Score: 44 | |
| Day Percent Change: -8.18% Day Change: -9.46 | |
| Week Change: -8.12% Year-to-date Change: 14.6% | |
| TNC Links: Profile News Message Board | |
| Charts:- Daily , Weekly | |
| Add TNC to Watchlist: View: Get Complete TNC Trend Analysis ➞ | |
 | AAON AAON, Inc. |
| Sector: Industrials | |
| SubSector: General Building Materials | |
| MarketCap: 2533.63 Millions | |
| Recent Price: 84.54 Smart Investing & Trading Score: 51 | |
| Day Percent Change: -6.99% Day Change: -6.35 | |
| Week Change: -7.25% Year-to-date Change: 14.4% | |
| AAON Links: Profile News Message Board | |
| Charts:- Daily , Weekly | |
| Add AAON to Watchlist: View: Get Complete AAON Trend Analysis ➞ | |
| Too many stocks? View smallcap stocks filtered by marketcap & sector |
| Marketcap: All SmallCap Stocks (default-no microcap), Large, Mid-Range, Small & MicroCap |
| Sector: Tech, Finance, Energy, Staples, Retail, Industrial, Materials, Utilities & Medical |
|
Best Stocks Today 12Stocks.com |
© 2024 12Stocks.com Terms & Conditions Privacy Contact Us
All Information Provided Only For Education And Not To Be Used For Investing or Trading. See Terms & Conditions


One More Thing ... Get Best Stocks Delivered Daily!
Never Ever Miss A Move With Our Top Ten Stocks Lists
Find Best Stocks In Any Market - Bull or Bear Market
Take A Peek At Our Top Ten Stocks Lists: Daily, Weekly, Year-to-Date & Top Trends
Find Best Stocks In Any Market - Bull or Bear Market
Take A Peek At Our Top Ten Stocks Lists: Daily, Weekly, Year-to-Date & Top Trends
Smallcap Stocks With Best Up Trends [0-bearish to 100-bullish]: Origin Materials[100], Alignment Healthcare[100], Emergent BioSolutions[100], Enovix [100], Clearfield [100], Fluence Energy[100], TPI Composites[100], Janux [100], Conduent [100], Bloom Energy[100], E.W. Scripps[100]
Best Smallcap Stocks Year-to-Date:
Janux [482.74%], Viking [306.72%], Longboard [272.5%], Alpine Immune[239.34%], Bakkt [199.55%], Avidity Biosciences[195.24%], Vera [189.47%], Cullinan Oncology[176.9%], Super Micro[173.85%], Arcutis Bio[169.66%], Y-mAbs [154.69%] Best Smallcap Stocks This Week:
Emergent BioSolutions[102.34%], Deciphera [73.28%], Eyenovia [68.74%], Origin Materials[66.52%], Aspen Aerogels[54.66%], Enovix [51.85%], TPI Composites[41.91%], Codexis [41.73%], Cue Biopharma[41.39%], WideOpenWest [41.07%], Carvana Co[39.19%] Best Smallcap Stocks Daily:
WideOpenWest [29.16%], Ardelyx [28.65%], FTC Solar[25.09%], IES [23.96%], Twist Bioscience[23.18%], Origin Materials[22.23%], Alignment Healthcare[21.97%], Joint [18.43%], Emergent BioSolutions[17.73%], Butterfly [17.42%], Vaxxinity [17.27%]