
 Login Sign Up


| |||||
 |  | ||||

| 12Stocks.com Market Intelligence |
Best SmallCap Stocks
|
| In a hurry? Small Cap Stock Lists: Performance Trends Table, Stock Charts
Sort Small Cap stocks: Daily, Weekly, Year-to-Date, Market Cap & Trends. Filter Small Cap stocks list by sector: Show all, Tech, Finance, Energy, Staples, Retail, Industrial, Materials, Utilities and HealthCare Filter Small Cap stocks list by size: All Large Medium Small and MicroCap |
| 12Stocks.com Small Cap Stocks Performances & Trends Daily | |||||||||
|
|  The overall Smart Investing & Trading Score is 69 (0-bearish to 100-bullish) which puts Small Cap index in short term neutral to bullish trend. The Smart Investing & Trading Score from previous trading session is 49 and hence an improvement of trend.
| ||||||||
Here are the Smart Investing & Trading Scores of the most requested small cap stocks at 12Stocks.com (click stock name for detailed review):
|


| 12Stocks.com: Investing in Smallcap Index with Stocks | |
|
The following table helps investors and traders sort through current performance and trends (as measured by Smart Investing & Trading Score) of various
stocks in the Smallcap Index. Quick View: Move mouse or cursor over stock symbol (ticker) to view short-term technical chart and over stock name to view long term chart. Click on  to add stock symbol to your watchlist and to add stock symbol to your watchlist and  to view watchlist. Click on any ticker or stock name for detailed market intelligence report for that stock. to view watchlist. Click on any ticker or stock name for detailed market intelligence report for that stock. |
12Stocks.com Performance of Stocks in Smallcap Index
| Ticker | Stock Name | Watchlist | Category | Recent Price | Smart Investing & Trading Score | Change % | Weekly Change% |
| HIBB | Hibbett Sports |   | Services & Goods | 86.59 | 83 | 0.12% | 0.51% |
| IOSP | Innospec | | Materials | 121.71 | 32 | 0.01% | 0.49% |
| SONO | Sonos | | Technology | 17.05 | 37 | 0.65% | 0.47% |
| CBZ | CBIZ | | Services & Goods | 73.10 | 32 | 0.76% | 0.47% |
| RRR | Red Rock | | Transports | 54.37 | 32 | 1.59% | 0.46% |
| ORRF | Orrstown Financial | | Financials | 26.60 | 52 | 0.99% | 0.45% |
| BXMT | Blackstone Mortgage | | Financials | 17.99 | 42 | -0.06% | 0.45% |
| LADR | Ladder Capital | | Financials | 11.05 | 85 | 0.18% | 0.45% |
| CHMG | Chemung Financial | | Financials | 43.25 | 67 | 0.58% | 0.44% |
| IMMR | Immersion | | Technology | 7.22 | 36 | -0.55% | 0.42% |
| CARS | Cars.com | | Services & Goods | 17.09 | 57 | 1.12% | 0.41% |
| CNK | Cinemark | | Services & Goods | 17.72 | 71 | 0.74% | 0.40% |
| AGTI | Agiliti | | Health Care | 10.09 | 68 | 0.05% | 0.40% |
| BOH | Bank of Hawaii | | Financials | 58.86 | 69 | 0.63% | 0.39% |
| JBT | John Bean | | Industrials | 91.14 | 32 | 0.84% | 0.37% |
| GATX | GATX | | Transports | 127.98 | 68 | 1.30% | 0.37% |
| VIGL | Vigil Neuroscience | | Health Care | 2.72 | 42 | 4.82% | 0.37% |
| UCTT | Ultra Clean | | Technology | 42.11 | 37 | 2.63% | 0.36% |
| JBLU | JetBlue Airways | | Transports | 5.80 | 37 | 0.52% | 0.35% |
| CHCO | City Holding | | Financials | 104.47 | 83 | -0.28% | 0.35% |
| PRGS | Progress | | Technology | 50.51 | 42 | 0.14% | 0.34% |
| FMAO | Farmers & Merchants Bancorp | | Financials | 21.79 | 100 | -0.59% | 0.32% |
| KREF | KKR Real | | Financials | 9.65 | 67 | -0.21% | 0.31% |
| EXFY | Expensify | | Technology | 1.64 | 52 | 2.51% | 0.31% |
| LZB | La-Z-Boy | | Consumer Staples | 33.21 | 42 | 0.70% | 0.30% |


| Too many stocks? View smallcap stocks filtered by marketcap & sector |
| Marketcap: All SmallCap Stocks (default-no microcap), Large, Mid-Range, Small |
| Smallcap Sector: Tech, Finance, Energy, Staples, Retail, Industrial, Materials, & Medical |
|
Get the most comprehensive stock market coverage daily at 12Stocks.com ➞ Best Stocks Today ➞ Best Stocks Weekly ➞ Best Stocks Year-to-Date ➞ Best Stocks Trends ➞  Best Stocks Today 12Stocks.com Best Nasdaq Stocks ➞ Best S&P 500 Stocks ➞ Best Tech Stocks ➞ Best Biotech Stocks ➞ |
| Detailed Overview of SmallCap Stocks |
| SmallCap Technical Overview, Leaders & Laggards, Top SmallCap ETF Funds & Detailed SmallCap Stocks List, Charts, Trends & More |
| Smallcap: Technical Analysis, Trends & YTD Performance | |
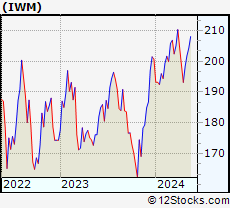
| SmallCap segment as represented by
IWM, an exchange-traded fund [ETF], holds basket of thousands of smallcap stocks from across all major sectors of the US stock market. The smallcap index (contains stocks like Riverbed & Sotheby's) is up by 0.59% and is currently underperforming the overall market by -6.29% year-to-date. Below is a quick view of technical charts and trends: | |
 IWM Weekly Chart |
|
| Long Term Trend: Not Good | |
| Medium Term Trend: Very Good | |
 IWM Daily Chart |
|
| Short Term Trend: Very Good | |
| Overall Trend Score: 69 | |
| YTD Performance: 0.59% | |
| **Trend Scores & Views Are Only For Educational Purposes And Not For Investing | |
| 12Stocks.com: Top Performing Small Cap Index Stocks | ||||||||||||||||||||||||||||||||||||||||||||||||
 The top performing Small Cap Index stocks year to date are
Now, more recently, over last week, the top performing Small Cap Index stocks on the move are


|
||||||||||||||||||||||||||||||||||||||||||||||||
| 12Stocks.com: Investing in Smallcap Index using Exchange Traded Funds | |
|
The following table shows list of key exchange traded funds (ETF) that
help investors track Smallcap index. The following list also includes leveraged ETF funds that track twice or thrice the daily returns of Smallcap indices. Short or inverse ETF funds move in the opposite direction to the index they track and are useful during market pullbacks or during bear markets. Quick View: Move mouse or cursor over ETF symbol (ticker) to view short-term technical chart and over ETF name to view long term chart. Click on ticker or stock name for detailed view. Click on to add stock symbol to your watchlist and to view watchlist. |
12Stocks.com List of ETFs that track Smallcap Index
| Ticker | ETF Name | Watchlist | Recent Price | Smart Investing & Trading Score | Change % | Week % | Year-to-date % |
| IWM | iShares Russell 2000 | | 201.90 | 69 | 0.99 | 1.77 | 0.59% |
| IJR | iShares Core S&P Small-Cap | | 107.13 | 82 | 0.75 | 1.4 | -1.03% |
| VTWO | Vanguard Russell 2000 ETF | | 81.61 | 69 | 0.94 | 1.73 | 0.63% |
| IWN | iShares Russell 2000 Value | | 154.21 | 100 | 0.87 | 2.03 | -0.72% |
| IJS | iShares S&P Small-Cap 600 Value | | 98.72 | 64 | 0.71 | 1.57 | -4.22% |
| IWO | iShares Russell 2000 Growth | | 256.87 | 57 | 0.99 | 1.49 | 1.84% |
| IJT | iShares S&P Small-Cap 600 Growth | | 127.76 | 95 | 0.82 | 1.32 | 2.09% |
| XSLV | PowerShares S&P SmallCap Low Volatil ETF | | 43.22 | 87 | 0.19 | 1.17 | -2.11% |
| SBB | ProShares Short SmallCap600 | | 16.16 | 13 | -1.28 | -1.37 | 1.44% |
| SDD | ProShares UltraShort SmallCap600 | | 18.84 | 23 | -2.41 | -2.61 | 2.27% |
| SAA | ProShares Ultra SmallCap600 | | 23.59 | 69 | 2.86 | 2.39 | -5.45% |
| SMLV | SPDR SSGA US Small Cap Low Volatil ETF | | 109.69 | 87 | 0.78 | 2.01 | -2.52% |
| 12Stocks.com: Charts, Trends, Fundamental Data and Performances of SmallCap Stocks | |
|
We now take in-depth look at all SmallCap stocks including charts, multi-period performances and overall trends (as measured by Smart Investing & Trading Score). One can sort SmallCap stocks (click link to choose) by Daily, Weekly and by Year-to-Date performances. Also, one can sort by size of the company or by market capitalization. |
| Select Your Default Chart Type: | |||||
| |||||
| Click on stock symbol or name for detailed view. Click on to add stock symbol to your watchlist and to view watchlist. Quick View: Move mouse or cursor over "Daily" to quickly view daily technical stock chart and over "Weekly" to view weekly technical stock chart. | |||||

 | HIBB Hibbett Sports, Inc. |
| Sector: Services & Goods | |
| SubSector: Sporting Goods Stores | |
| MarketCap: 183 Millions | |
| Recent Price: 86.59 Smart Investing & Trading Score: 83 | |
| Day Percent Change: 0.12% Day Change: 0.10 | |
| Week Change: 0.51% Year-to-date Change: 20.2% | |
| HIBB Links: Profile News Message Board | |
| Charts:- Daily , Weekly | |
| Add HIBB to Watchlist: View: Get Complete HIBB Trend Analysis ➞ | |
 | IOSP Innospec Inc. |
| Sector: Materials | |
| SubSector: Specialty Chemicals | |
| MarketCap: 1665.57 Millions | |
| Recent Price: 121.71 Smart Investing & Trading Score: 32 | |
| Day Percent Change: 0.01% Day Change: 0.01 | |
| Week Change: 0.49% Year-to-date Change: -1.2% | |
| IOSP Links: Profile News Message Board | |
| Charts:- Daily , Weekly | |
| Add IOSP to Watchlist: View: Get Complete IOSP Trend Analysis ➞ | |
 | SONO Sonos, Inc. |
| Sector: Technology | |
| SubSector: Diversified Electronics | |
| MarketCap: 1047.96 Millions | |
| Recent Price: 17.05 Smart Investing & Trading Score: 37 | |
| Day Percent Change: 0.65% Day Change: 0.11 | |
| Week Change: 0.47% Year-to-date Change: -0.5% | |
| SONO Links: Profile News Message Board | |
| Charts:- Daily , Weekly | |
| Add SONO to Watchlist: View: Get Complete SONO Trend Analysis ➞ | |
 | CBZ CBIZ, Inc. |
| Sector: Services & Goods | |
| SubSector: Business Services | |
| MarketCap: 1121.32 Millions | |
| Recent Price: 73.10 Smart Investing & Trading Score: 32 | |
| Day Percent Change: 0.76% Day Change: 0.55 | |
| Week Change: 0.47% Year-to-date Change: 16.8% | |
| CBZ Links: Profile News Message Board | |
| Charts:- Daily , Weekly | |
| Add CBZ to Watchlist: View: Get Complete CBZ Trend Analysis ➞ | |
 | RRR Red Rock Resorts, Inc. |
| Sector: Transports | |
| SubSector: Rental & Leasing Services | |
| MarketCap: 1144.04 Millions | |
| Recent Price: 54.37 Smart Investing & Trading Score: 32 | |
| Day Percent Change: 1.59% Day Change: 0.85 | |
| Week Change: 0.46% Year-to-date Change: 2.0% | |
| RRR Links: Profile News Message Board | |
| Charts:- Daily , Weekly | |
| Add RRR to Watchlist: View: Get Complete RRR Trend Analysis ➞ | |
 | ORRF Orrstown Financial Services, Inc. |
| Sector: Financials | |
| SubSector: Regional - Northeast Banks | |
| MarketCap: 159.999 Millions | |
| Recent Price: 26.60 Smart Investing & Trading Score: 52 | |
| Day Percent Change: 0.99% Day Change: 0.26 | |
| Week Change: 0.45% Year-to-date Change: -9.8% | |
| ORRF Links: Profile News Message Board | |
| Charts:- Daily , Weekly | |
| Add ORRF to Watchlist: View: Get Complete ORRF Trend Analysis ➞ | |
 | BXMT Blackstone Mortgage Trust, Inc. |
| Sector: Financials | |
| SubSector: Mortgage Investment | |
| MarketCap: 2820.69 Millions | |
| Recent Price: 17.99 Smart Investing & Trading Score: 42 | |
| Day Percent Change: -0.06% Day Change: -0.01 | |
| Week Change: 0.45% Year-to-date Change: -15.4% | |
| BXMT Links: Profile News Message Board | |
| Charts:- Daily , Weekly | |
| Add BXMT to Watchlist: View: Get Complete BXMT Trend Analysis ➞ | |
 | LADR Ladder Capital Corp |
| Sector: Financials | |
| SubSector: Mortgage Investment | |
| MarketCap: 660.039 Millions | |
| Recent Price: 11.05 Smart Investing & Trading Score: 85 | |
| Day Percent Change: 0.18% Day Change: 0.02 | |
| Week Change: 0.45% Year-to-date Change: -4.0% | |
| LADR Links: Profile News Message Board | |
| Charts:- Daily , Weekly | |
| Add LADR to Watchlist: View: Get Complete LADR Trend Analysis ➞ | |
 | CHMG Chemung Financial Corporation |
| Sector: Financials | |
| SubSector: Regional - Pacific Banks | |
| MarketCap: 142.229 Millions | |
| Recent Price: 43.25 Smart Investing & Trading Score: 67 | |
| Day Percent Change: 0.58% Day Change: 0.25 | |
| Week Change: 0.44% Year-to-date Change: -13.2% | |
| CHMG Links: Profile News Message Board | |
| Charts:- Daily , Weekly | |
| Add CHMG to Watchlist: View: Get Complete CHMG Trend Analysis ➞ | |
 | IMMR Immersion Corporation |
| Sector: Technology | |
| SubSector: Application Software | |
| MarketCap: 173.462 Millions | |
| Recent Price: 7.22 Smart Investing & Trading Score: 36 | |
| Day Percent Change: -0.55% Day Change: -0.04 | |
| Week Change: 0.42% Year-to-date Change: 2.3% | |
| IMMR Links: Profile News Message Board | |
| Charts:- Daily , Weekly | |
| Add IMMR to Watchlist: View: Get Complete IMMR Trend Analysis ➞ | |
 | CARS Cars.com Inc. |
| Sector: Services & Goods | |
| SubSector: Auto Dealerships | |
| MarketCap: 290.321 Millions | |
| Recent Price: 17.09 Smart Investing & Trading Score: 57 | |
| Day Percent Change: 1.12% Day Change: 0.19 | |
| Week Change: 0.41% Year-to-date Change: -9.9% | |
| CARS Links: Profile News Message Board | |
| Charts:- Daily , Weekly | |
| Add CARS to Watchlist: View: Get Complete CARS Trend Analysis ➞ | |
 | CNK Cinemark Holdings, Inc. |
| Sector: Services & Goods | |
| SubSector: Movie Production, Theaters | |
| MarketCap: 1776.29 Millions | |
| Recent Price: 17.72 Smart Investing & Trading Score: 71 | |
| Day Percent Change: 0.74% Day Change: 0.13 | |
| Week Change: 0.4% Year-to-date Change: 25.8% | |
| CNK Links: Profile News Message Board | |
| Charts:- Daily , Weekly | |
| Add CNK to Watchlist: View: Get Complete CNK Trend Analysis ➞ | |
 | AGTI Agiliti, Inc. |
| Sector: Health Care | |
| SubSector: Health Information Services | |
| MarketCap: 2270 Millions | |
| Recent Price: 10.09 Smart Investing & Trading Score: 68 | |
| Day Percent Change: 0.05% Day Change: 0.00 | |
| Week Change: 0.4% Year-to-date Change: 28.1% | |
| AGTI Links: Profile News Message Board | |
| Charts:- Daily , Weekly | |
| Add AGTI to Watchlist: View: Get Complete AGTI Trend Analysis ➞ | |
 | BOH Bank of Hawaii Corporation |
| Sector: Financials | |
| SubSector: Regional - Pacific Banks | |
| MarketCap: 2305.19 Millions | |
| Recent Price: 58.86 Smart Investing & Trading Score: 69 | |
| Day Percent Change: 0.63% Day Change: 0.37 | |
| Week Change: 0.39% Year-to-date Change: -18.8% | |
| BOH Links: Profile News Message Board | |
| Charts:- Daily , Weekly | |
| Add BOH to Watchlist: View: Get Complete BOH Trend Analysis ➞ | |
 | JBT John Bean Technologies Corporation |
| Sector: Industrials | |
| SubSector: Diversified Machinery | |
| MarketCap: 2197.36 Millions | |
| Recent Price: 91.14 Smart Investing & Trading Score: 32 | |
| Day Percent Change: 0.84% Day Change: 0.76 | |
| Week Change: 0.37% Year-to-date Change: -8.4% | |
| JBT Links: Profile News Message Board | |
| Charts:- Daily , Weekly | |
| Add JBT to Watchlist: View: Get Complete JBT Trend Analysis ➞ | |
 | GATX GATX Corporation |
| Sector: Transports | |
| SubSector: Rental & Leasing Services | |
| MarketCap: 2080.34 Millions | |
| Recent Price: 127.98 Smart Investing & Trading Score: 68 | |
| Day Percent Change: 1.30% Day Change: 1.64 | |
| Week Change: 0.37% Year-to-date Change: 6.5% | |
| GATX Links: Profile News Message Board | |
| Charts:- Daily , Weekly | |
| Add GATX to Watchlist: View: Get Complete GATX Trend Analysis ➞ | |
 | VIGL Vigil Neuroscience, Inc. |
| Sector: Health Care | |
| SubSector: Biotechnology | |
| MarketCap: 339 Millions | |
| Recent Price: 2.72 Smart Investing & Trading Score: 42 | |
| Day Percent Change: 4.82% Day Change: 0.13 | |
| Week Change: 0.37% Year-to-date Change: -20.7% | |
| VIGL Links: Profile News Message Board | |
| Charts:- Daily , Weekly | |
| Add VIGL to Watchlist: View: Get Complete VIGL Trend Analysis ➞ | |
 | UCTT Ultra Clean Holdings, Inc. |
| Sector: Technology | |
| SubSector: Semiconductor Equipment & Materials | |
| MarketCap: 528.518 Millions | |
| Recent Price: 42.11 Smart Investing & Trading Score: 37 | |
| Day Percent Change: 2.63% Day Change: 1.08 | |
| Week Change: 0.36% Year-to-date Change: 23.4% | |
| UCTT Links: Profile News Message Board | |
| Charts:- Daily , Weekly | |
| Add UCTT to Watchlist: View: Get Complete UCTT Trend Analysis ➞ | |
 | JBLU JetBlue Airways Corporation |
| Sector: Transports | |
| SubSector: Regional Airlines | |
| MarketCap: 2383.1 Millions | |
| Recent Price: 5.80 Smart Investing & Trading Score: 37 | |
| Day Percent Change: 0.52% Day Change: 0.03 | |
| Week Change: 0.35% Year-to-date Change: 4.5% | |
| JBLU Links: Profile News Message Board | |
| Charts:- Daily , Weekly | |
| Add JBLU to Watchlist: View: Get Complete JBLU Trend Analysis ➞ | |
 | CHCO City Holding Company |
| Sector: Financials | |
| SubSector: Regional - Mid-Atlantic Banks | |
| MarketCap: 1059.59 Millions | |
| Recent Price: 104.47 Smart Investing & Trading Score: 83 | |
| Day Percent Change: -0.28% Day Change: -0.29 | |
| Week Change: 0.35% Year-to-date Change: -5.3% | |
| CHCO Links: Profile News Message Board | |
| Charts:- Daily , Weekly | |
| Add CHCO to Watchlist: View: Get Complete CHCO Trend Analysis ➞ | |
 | PRGS Progress Software Corporation |
| Sector: Technology | |
| SubSector: Application Software | |
| MarketCap: 1407.22 Millions | |
| Recent Price: 50.51 Smart Investing & Trading Score: 42 | |
| Day Percent Change: 0.14% Day Change: 0.07 | |
| Week Change: 0.34% Year-to-date Change: -7.0% | |
| PRGS Links: Profile News Message Board | |
| Charts:- Daily , Weekly | |
| Add PRGS to Watchlist: View: Get Complete PRGS Trend Analysis ➞ | |
 | FMAO Farmers & Merchants Bancorp, Inc. |
| Sector: Financials | |
| SubSector: Regional - Midwest Banks | |
| MarketCap: 280.27 Millions | |
| Recent Price: 21.79 Smart Investing & Trading Score: 100 | |
| Day Percent Change: -0.59% Day Change: -0.13 | |
| Week Change: 0.32% Year-to-date Change: -12.1% | |
| FMAO Links: Profile News Message Board | |
| Charts:- Daily , Weekly | |
| Add FMAO to Watchlist: View: Get Complete FMAO Trend Analysis ➞ | |
 | KREF KKR Real Estate Finance Trust Inc. |
| Sector: Financials | |
| SubSector: Mortgage Investment | |
| MarketCap: 645.939 Millions | |
| Recent Price: 9.65 Smart Investing & Trading Score: 67 | |
| Day Percent Change: -0.21% Day Change: -0.02 | |
| Week Change: 0.31% Year-to-date Change: -27.1% | |
| KREF Links: Profile News Message Board | |
| Charts:- Daily , Weekly | |
| Add KREF to Watchlist: View: Get Complete KREF Trend Analysis ➞ | |
 | EXFY Expensify, Inc. |
| Sector: Technology | |
| SubSector: Software - Application | |
| MarketCap: 678 Millions | |
| Recent Price: 1.64 Smart Investing & Trading Score: 52 | |
| Day Percent Change: 2.51% Day Change: 0.04 | |
| Week Change: 0.31% Year-to-date Change: -35.1% | |
| EXFY Links: Profile News Message Board | |
| Charts:- Daily , Weekly | |
| Add EXFY to Watchlist: View: Get Complete EXFY Trend Analysis ➞ | |
 | LZB La-Z-Boy Incorporated |
| Sector: Consumer Staples | |
| SubSector: Home Furnishings & Fixtures | |
| MarketCap: 951.635 Millions | |
| Recent Price: 33.21 Smart Investing & Trading Score: 42 | |
| Day Percent Change: 0.70% Day Change: 0.23 | |
| Week Change: 0.3% Year-to-date Change: -10.1% | |
| LZB Links: Profile News Message Board | |
| Charts:- Daily , Weekly | |
| Add LZB to Watchlist: View: Get Complete LZB Trend Analysis ➞ | |
| Too many stocks? View smallcap stocks filtered by marketcap & sector |
| Marketcap: All SmallCap Stocks (default-no microcap), Large, Mid-Range, Small & MicroCap |
| Sector: Tech, Finance, Energy, Staples, Retail, Industrial, Materials, Utilities & Medical |
|
Best Stocks Today 12Stocks.com |
© 2024 12Stocks.com Terms & Conditions Privacy Contact Us
All Information Provided Only For Education And Not To Be Used For Investing or Trading. See Terms & Conditions


One More Thing ... Get Best Stocks Delivered Daily!
Never Ever Miss A Move With Our Top Ten Stocks Lists
Find Best Stocks In Any Market - Bull or Bear Market
Take A Peek At Our Top Ten Stocks Lists: Daily, Weekly, Year-to-Date & Top Trends
Find Best Stocks In Any Market - Bull or Bear Market
Take A Peek At Our Top Ten Stocks Lists: Daily, Weekly, Year-to-Date & Top Trends
Smallcap Stocks With Best Up Trends [0-bearish to 100-bullish]: Twist Bioscience[100], WideOpenWest [100], Joint [100], FTC Solar[100], Origin Materials[100], Alignment Healthcare[100], Clarus [100], IES [100], Emergent BioSolutions[100], Enovix [100], El Pollo[100]
Best Smallcap Stocks Year-to-Date:
Janux [482.74%], Viking [313.59%], Longboard [272.5%], Alpine Immune[239.29%], Bakkt [199.55%], Avidity Biosciences[192.48%], Vera [189.47%], Cullinan Oncology[176.9%], Super Micro[175.35%], Y-mAbs [151.47%], Sana [149.33%] Best Smallcap Stocks This Week:
Emergent BioSolutions[102.6%], Deciphera [73.24%], Origin Materials[66.52%], Eyenovia [60.78%], Cue Biopharma[56.04%], Aspen Aerogels[55.96%], Enovix [54.02%], Luna Innovations[53.77%], Codexis [47.37%], Carvana Co[44.31%], Office Properties[42.79%] Best Smallcap Stocks Daily:
Luna Innovations[36.00%], Twist Bioscience[28.74%], Ardelyx [28.42%], WideOpenWest [28.23%], 2U [26.63%], Joint [25.35%], FTC Solar[25.09%], Origin Materials[22.23%], Alignment Healthcare[21.97%], Clarus [18.67%], Aurora Innovation[18.09%]