
 Login Sign Up


| |||||
 |  | ||||

| 12Stocks.com Market Intelligence |
Best SmallCap Stocks
|
| In a hurry? Small Cap Stock Lists: Performance Trends Table, Stock Charts
Sort Small Cap stocks: Daily, Weekly, Year-to-Date, Market Cap & Trends. Filter Small Cap stocks list by sector: Show all, Tech, Finance, Energy, Staples, Retail, Industrial, Materials, Utilities and HealthCare Filter Small Cap stocks list by size: All Large Medium Small and MicroCap |
| 12Stocks.com Small Cap Stocks Performances & Trends Daily | |||||||||
|
|  The overall Smart Investing & Trading Score is 65 (0-bearish to 100-bullish) which puts Small Cap index in short term neutral to bullish trend. The Smart Investing & Trading Score from previous trading session is 93 and hence a deterioration of trend.
| ||||||||
Here are the Smart Investing & Trading Scores of the most requested small cap stocks at 12Stocks.com (click stock name for detailed review):
|


| 12Stocks.com: Investing in Smallcap Index with Stocks | |
|
The following table helps investors and traders sort through current performance and trends (as measured by Smart Investing & Trading Score) of various
stocks in the Smallcap Index. Quick View: Move mouse or cursor over stock symbol (ticker) to view short-term technical chart and over stock name to view long term chart. Click on  to add stock symbol to your watchlist and to add stock symbol to your watchlist and  to view watchlist. Click on any ticker or stock name for detailed market intelligence report for that stock. to view watchlist. Click on any ticker or stock name for detailed market intelligence report for that stock. |
12Stocks.com Performance of Stocks in Smallcap Index
| Ticker | Stock Name | Watchlist | Category | Recent Price | Smart Investing & Trading Score | Change % | Weekly Change% |
| ALLK | Allakos |   | Health Care | 1.20 | 37 | -6.98% | 3.45% |
| FRME | First Merchants | | Financials | 35.88 | 76 | -0.36% | 3.43% |
| APPF | AppFolio | | Technology | 247.31 | 63 | 0.82% | 3.43% |
| ZUO | Zuora | | Technology | 10.43 | 68 | -0.86% | 3.42% |
| MGY | Magnolia Oil | | Energy | 25.97 | 83 | -1.89% | 3.42% |
| FELE | Franklin Electric | | Industrials | 102.27 | 50 | 0.20% | 3.41% |
| PWOD | Penns Woods | | Financials | 19.10 | 87 | -0.68% | 3.41% |
| EVBN | Evans Bancorp | | Financials | 26.42 | 57 | 0.80% | 3.41% |
| SENEA | Seneca Foods | | Consumer Staples | 59.83 | 93 | -1.76% | 3.40% |
| CNOB | ConnectOne Bancorp | | Financials | 20.15 | 95 | 0.70% | 3.39% |
| HAIN | Hain Celestial | | Consumer Staples | 7.03 | 69 | 0.00% | 3.38% |
| PATK | Patrick Industries | | Industrials | 114.88 | 40 | -0.12% | 3.37% |
| PIPR | Piper Sandler | | Financials | 213.09 | 95 | -0.23% | 3.37% |
| ESGR | Enstar Group | | Financials | 308.77 | 82 | 0.92% | 3.36% |
| TIPT | Tiptree | | Financials | 17.21 | 64 | 0.17% | 3.36% |
| BBIO | BridgeBio Pharma | | Health Care | 28.77 | 54 | 0.19% | 3.36% |
| QCRH | QCR | | Financials | 59.21 | 100 | -0.30% | 3.35% |
| RILY | B. Riley | | Financials | 32.14 | 78 | -0.65% | 3.34% |
| SPCE | Virgin Galactic | | Industrials | 0.98 | 44 | -4.88% | 3.34% |
| CATY | Cathay General | | Financials | 37.66 | 69 | 0.05% | 3.32% |
| EXLS | ExlService | | Technology | 30.63 | 57 | 0.29% | 3.31% |
| SSB | South State | | Financials | 81.16 | 47 | 0.66% | 3.30% |
| SILK | Silk Road | | Health Care | 20.95 | 70 | 4.80% | 3.30% |
| TH | Target Hospitality | | Industrials | 11.57 | 88 | -0.77% | 3.30% |
| HLX | Helix Energy | | Energy | 11.31 | 93 | -2.16% | 3.29% |


| Too many stocks? View smallcap stocks filtered by marketcap & sector |
| Marketcap: All SmallCap Stocks (default-no microcap), Large, Mid-Range, Small |
| Smallcap Sector: Tech, Finance, Energy, Staples, Retail, Industrial, Materials, & Medical |
|
Get the most comprehensive stock market coverage daily at 12Stocks.com ➞ Best Stocks Today ➞ Best Stocks Weekly ➞ Best Stocks Year-to-Date ➞ Best Stocks Trends ➞  Best Stocks Today 12Stocks.com Best Nasdaq Stocks ➞ Best S&P 500 Stocks ➞ Best Tech Stocks ➞ Best Biotech Stocks ➞ |
| Detailed Overview of SmallCap Stocks |
| SmallCap Technical Overview, Leaders & Laggards, Top SmallCap ETF Funds & Detailed SmallCap Stocks List, Charts, Trends & More |
| Smallcap: Technical Analysis, Trends & YTD Performance | |
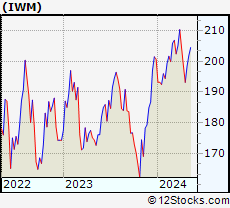
| SmallCap segment as represented by
IWM, an exchange-traded fund [ETF], holds basket of thousands of smallcap stocks from across all major sectors of the US stock market. The smallcap index (contains stocks like Riverbed & Sotheby's) is up by 1.79% and is currently underperforming the overall market by -6.99% year-to-date. Below is a quick view of technical charts and trends: | |
 IWM Weekly Chart |
|
| Long Term Trend: Very Good | |
| Medium Term Trend: Very Good | |
 IWM Daily Chart |
|
| Short Term Trend: Not Good | |
| Overall Trend Score: 65 | |
| YTD Performance: 1.79% | |
| **Trend Scores & Views Are Only For Educational Purposes And Not For Investing | |
| 12Stocks.com: Top Performing Small Cap Index Stocks | ||||||||||||||||||||||||||||||||||||||||||||||||
 The top performing Small Cap Index stocks year to date are
Now, more recently, over last week, the top performing Small Cap Index stocks on the move are


|
||||||||||||||||||||||||||||||||||||||||||||||||
| 12Stocks.com: Investing in Smallcap Index using Exchange Traded Funds | |
|
The following table shows list of key exchange traded funds (ETF) that
help investors track Smallcap index. The following list also includes leveraged ETF funds that track twice or thrice the daily returns of Smallcap indices. Short or inverse ETF funds move in the opposite direction to the index they track and are useful during market pullbacks or during bear markets. Quick View: Move mouse or cursor over ETF symbol (ticker) to view short-term technical chart and over ETF name to view long term chart. Click on ticker or stock name for detailed view. Click on to add stock symbol to your watchlist and to view watchlist. |
12Stocks.com List of ETFs that track Smallcap Index
| Ticker | ETF Name | Watchlist | Recent Price | Smart Investing & Trading Score | Change % | Week % | Year-to-date % |
| IWM | iShares Russell 2000 | | 204.31 | 65 | -0.75 | 1.19 | 1.79% |
| IJR | iShares Core S&P Small-Cap | | 108.98 | 88 | -0.53 | 1.73 | 0.67% |
| IWN | iShares Russell 2000 Value | | 156.19 | 88 | -0.61 | 1.28 | 0.55% |
| VTWO | Vanguard Russell 2000 ETF | | 82.63 | 58 | -0.68 | 1.24 | 1.88% |
| IWO | iShares Russell 2000 Growth | | 259.92 | 57 | -0.76 | 1.19 | 3.05% |
| IJS | iShares S&P Small-Cap 600 Value | | 100.52 | 60 | -0.46 | 1.82 | -2.47% |
| IJT | iShares S&P Small-Cap 600 Growth | | 129.86 | 76 | -0.51 | 1.64 | 3.77% |
| XSLV | PowerShares S&P SmallCap Low Volatil ETF | | 44.23 | 83 | -0.47 | 2.34 | 0.18% |
| SBB | ProShares Short SmallCap600 | | 15.96 | 18 | 0.47 | -1.27 | 0.16% |
| SMLV | SPDR SSGA US Small Cap Low Volatil ETF | | 111.22 | 95 | -0.48 | 1.4 | -1.16% |
| SDD | ProShares UltraShort SmallCap600 | | 18.28 | 28 | 0.19 | -3 | -0.8% |
| SAA | ProShares Ultra SmallCap600 | | 24.35 | 90 | -0.40 | 3.22 | -2.4% |
| 12Stocks.com: Charts, Trends, Fundamental Data and Performances of SmallCap Stocks | |
|
We now take in-depth look at all SmallCap stocks including charts, multi-period performances and overall trends (as measured by Smart Investing & Trading Score). One can sort SmallCap stocks (click link to choose) by Daily, Weekly and by Year-to-Date performances. Also, one can sort by size of the company or by market capitalization. |
| Select Your Default Chart Type: | |||||
| |||||
| Click on stock symbol or name for detailed view. Click on to add stock symbol to your watchlist and to view watchlist. Quick View: Move mouse or cursor over "Daily" to quickly view daily technical stock chart and over "Weekly" to view weekly technical stock chart. | |||||

 | ALLK Allakos Inc. |
| Sector: Health Care | |
| SubSector: Biotechnology | |
| MarketCap: 3233.55 Millions | |
| Recent Price: 1.20 Smart Investing & Trading Score: 37 | |
| Day Percent Change: -6.98% Day Change: -0.09 | |
| Week Change: 3.45% Year-to-date Change: -56.0% | |
| ALLK Links: Profile News Message Board | |
| Charts:- Daily , Weekly | |
| Add ALLK to Watchlist: View: Get Complete ALLK Trend Analysis ➞ | |
 | FRME First Merchants Corporation |
| Sector: Financials | |
| SubSector: Regional - Midwest Banks | |
| MarketCap: 1490.4 Millions | |
| Recent Price: 35.88 Smart Investing & Trading Score: 76 | |
| Day Percent Change: -0.36% Day Change: -0.13 | |
| Week Change: 3.43% Year-to-date Change: -3.2% | |
| FRME Links: Profile News Message Board | |
| Charts:- Daily , Weekly | |
| Add FRME to Watchlist: View: Get Complete FRME Trend Analysis ➞ | |
 | APPF AppFolio, Inc. |
| Sector: Technology | |
| SubSector: Application Software | |
| MarketCap: 3412.02 Millions | |
| Recent Price: 247.31 Smart Investing & Trading Score: 63 | |
| Day Percent Change: 0.82% Day Change: 2.01 | |
| Week Change: 3.43% Year-to-date Change: 42.8% | |
| APPF Links: Profile News Message Board | |
| Charts:- Daily , Weekly | |
| Add APPF to Watchlist: View: Get Complete APPF Trend Analysis ➞ | |
 | ZUO Zuora, Inc. |
| Sector: Technology | |
| SubSector: Application Software | |
| MarketCap: 1063.22 Millions | |
| Recent Price: 10.43 Smart Investing & Trading Score: 68 | |
| Day Percent Change: -0.86% Day Change: -0.09 | |
| Week Change: 3.42% Year-to-date Change: 10.9% | |
| ZUO Links: Profile News Message Board | |
| Charts:- Daily , Weekly | |
| Add ZUO to Watchlist: View: Get Complete ZUO Trend Analysis ➞ | |
 | MGY Magnolia Oil & Gas Corporation |
| Sector: Energy | |
| SubSector: Independent Oil & Gas | |
| MarketCap: 1088.93 Millions | |
| Recent Price: 25.97 Smart Investing & Trading Score: 83 | |
| Day Percent Change: -1.89% Day Change: -0.50 | |
| Week Change: 3.42% Year-to-date Change: 22.0% | |
| MGY Links: Profile News Message Board | |
| Charts:- Daily , Weekly | |
| Add MGY to Watchlist: View: Get Complete MGY Trend Analysis ➞ | |
 | FELE Franklin Electric Co., Inc. |
| Sector: Industrials | |
| SubSector: Industrial Electrical Equipment | |
| MarketCap: 2397.89 Millions | |
| Recent Price: 102.27 Smart Investing & Trading Score: 50 | |
| Day Percent Change: 0.20% Day Change: 0.20 | |
| Week Change: 3.41% Year-to-date Change: 5.8% | |
| FELE Links: Profile News Message Board | |
| Charts:- Daily , Weekly | |
| Add FELE to Watchlist: View: Get Complete FELE Trend Analysis ➞ | |
 | PWOD Penns Woods Bancorp, Inc. |
| Sector: Financials | |
| SubSector: Regional - Mid-Atlantic Banks | |
| MarketCap: 152.559 Millions | |
| Recent Price: 19.10 Smart Investing & Trading Score: 87 | |
| Day Percent Change: -0.68% Day Change: -0.13 | |
| Week Change: 3.41% Year-to-date Change: -15.2% | |
| PWOD Links: Profile News Message Board | |
| Charts:- Daily , Weekly | |
| Add PWOD to Watchlist: View: Get Complete PWOD Trend Analysis ➞ | |
 | EVBN Evans Bancorp, Inc. |
| Sector: Financials | |
| SubSector: Regional - Northeast Banks | |
| MarketCap: 124.899 Millions | |
| Recent Price: 26.42 Smart Investing & Trading Score: 57 | |
| Day Percent Change: 0.80% Day Change: 0.21 | |
| Week Change: 3.41% Year-to-date Change: -16.2% | |
| EVBN Links: Profile News Message Board | |
| Charts:- Daily , Weekly | |
| Add EVBN to Watchlist: View: Get Complete EVBN Trend Analysis ➞ | |
 | SENEA Seneca Foods Corporation |
| Sector: Consumer Staples | |
| SubSector: Processed & Packaged Goods | |
| MarketCap: 326.348 Millions | |
| Recent Price: 59.83 Smart Investing & Trading Score: 93 | |
| Day Percent Change: -1.76% Day Change: -1.07 | |
| Week Change: 3.4% Year-to-date Change: 14.1% | |
| SENEA Links: Profile News Message Board | |
| Charts:- Daily , Weekly | |
| Add SENEA to Watchlist: View: Get Complete SENEA Trend Analysis ➞ | |
 | CNOB ConnectOne Bancorp, Inc. |
| Sector: Financials | |
| SubSector: Regional - Northeast Banks | |
| MarketCap: 491.899 Millions | |
| Recent Price: 20.15 Smart Investing & Trading Score: 95 | |
| Day Percent Change: 0.70% Day Change: 0.14 | |
| Week Change: 3.39% Year-to-date Change: -12.1% | |
| CNOB Links: Profile News Message Board | |
| Charts:- Daily , Weekly | |
| Add CNOB to Watchlist: View: Get Complete CNOB Trend Analysis ➞ | |
 | HAIN The Hain Celestial Group, Inc. |
| Sector: Consumer Staples | |
| SubSector: Food Wholesale | |
| MarketCap: 2684.69 Millions | |
| Recent Price: 7.03 Smart Investing & Trading Score: 69 | |
| Day Percent Change: 0.00% Day Change: 0.00 | |
| Week Change: 3.38% Year-to-date Change: -35.8% | |
| HAIN Links: Profile News Message Board | |
| Charts:- Daily , Weekly | |
| Add HAIN to Watchlist: View: Get Complete HAIN Trend Analysis ➞ | |
 | PATK Patrick Industries, Inc. |
| Sector: Industrials | |
| SubSector: Lumber, Wood Production | |
| MarketCap: 565.838 Millions | |
| Recent Price: 114.88 Smart Investing & Trading Score: 40 | |
| Day Percent Change: -0.12% Day Change: -0.14 | |
| Week Change: 3.37% Year-to-date Change: 14.5% | |
| PATK Links: Profile News Message Board | |
| Charts:- Daily , Weekly | |
| Add PATK to Watchlist: View: Get Complete PATK Trend Analysis ➞ | |
 | PIPR Piper Sandler Companies |
| Sector: Financials | |
| SubSector: Asset Management | |
| MarketCap: 759.603 Millions | |
| Recent Price: 213.09 Smart Investing & Trading Score: 95 | |
| Day Percent Change: -0.23% Day Change: -0.49 | |
| Week Change: 3.37% Year-to-date Change: 21.9% | |
| PIPR Links: Profile News Message Board | |
| Charts:- Daily , Weekly | |
| Add PIPR to Watchlist: View: Get Complete PIPR Trend Analysis ➞ | |
 | ESGR Enstar Group Limited |
| Sector: Financials | |
| SubSector: Property & Casualty Insurance | |
| MarketCap: 2886.02 Millions | |
| Recent Price: 308.77 Smart Investing & Trading Score: 82 | |
| Day Percent Change: 0.92% Day Change: 2.81 | |
| Week Change: 3.36% Year-to-date Change: 4.9% | |
| ESGR Links: Profile News Message Board | |
| Charts:- Daily , Weekly | |
| Add ESGR to Watchlist: View: Get Complete ESGR Trend Analysis ➞ | |
 | TIPT Tiptree Inc. |
| Sector: Financials | |
| SubSector: Life Insurance | |
| MarketCap: 183.486 Millions | |
| Recent Price: 17.21 Smart Investing & Trading Score: 64 | |
| Day Percent Change: 0.17% Day Change: 0.03 | |
| Week Change: 3.36% Year-to-date Change: -9.2% | |
| TIPT Links: Profile News Message Board | |
| Charts:- Daily , Weekly | |
| Add TIPT to Watchlist: View: Get Complete TIPT Trend Analysis ➞ | |
 | BBIO BridgeBio Pharma, Inc. |
| Sector: Health Care | |
| SubSector: Biotechnology | |
| MarketCap: 3879.35 Millions | |
| Recent Price: 28.77 Smart Investing & Trading Score: 54 | |
| Day Percent Change: 0.19% Day Change: 0.05 | |
| Week Change: 3.36% Year-to-date Change: -28.8% | |
| BBIO Links: Profile News Message Board | |
| Charts:- Daily , Weekly | |
| Add BBIO to Watchlist: View: Get Complete BBIO Trend Analysis ➞ | |
 | QCRH QCR Holdings, Inc. |
| Sector: Financials | |
| SubSector: Regional - Southwest Banks | |
| MarketCap: 465.765 Millions | |
| Recent Price: 59.21 Smart Investing & Trading Score: 100 | |
| Day Percent Change: -0.30% Day Change: -0.18 | |
| Week Change: 3.35% Year-to-date Change: 1.4% | |
| QCRH Links: Profile News Message Board | |
| Charts:- Daily , Weekly | |
| Add QCRH to Watchlist: View: Get Complete QCRH Trend Analysis ➞ | |
 | RILY B. Riley Financial, Inc. |
| Sector: Financials | |
| SubSector: Asset Management | |
| MarketCap: 443.703 Millions | |
| Recent Price: 32.14 Smart Investing & Trading Score: 78 | |
| Day Percent Change: -0.65% Day Change: -0.21 | |
| Week Change: 3.34% Year-to-date Change: 53.1% | |
| RILY Links: Profile News Message Board | |
| Charts:- Daily , Weekly | |
| Add RILY to Watchlist: View: Get Complete RILY Trend Analysis ➞ | |
 | SPCE Virgin Galactic Holdings, Inc. |
| Sector: Industrials | |
| SubSector: Conglomerates | |
| MarketCap: 2612.48 Millions | |
| Recent Price: 0.98 Smart Investing & Trading Score: 44 | |
| Day Percent Change: -4.88% Day Change: -0.05 | |
| Week Change: 3.34% Year-to-date Change: -60.0% | |
| SPCE Links: Profile News Message Board | |
| Charts:- Daily , Weekly | |
| Add SPCE to Watchlist: View: Get Complete SPCE Trend Analysis ➞ | |
 | CATY Cathay General Bancorp |
| Sector: Financials | |
| SubSector: Regional - Pacific Banks | |
| MarketCap: 1781.99 Millions | |
| Recent Price: 37.66 Smart Investing & Trading Score: 69 | |
| Day Percent Change: 0.05% Day Change: 0.02 | |
| Week Change: 3.32% Year-to-date Change: -15.5% | |
| CATY Links: Profile News Message Board | |
| Charts:- Daily , Weekly | |
| Add CATY to Watchlist: View: Get Complete CATY Trend Analysis ➞ | |
 | EXLS ExlService Holdings, Inc. |
| Sector: Technology | |
| SubSector: Information Technology Services | |
| MarketCap: 1781.78 Millions | |
| Recent Price: 30.63 Smart Investing & Trading Score: 57 | |
| Day Percent Change: 0.29% Day Change: 0.09 | |
| Week Change: 3.31% Year-to-date Change: -0.7% | |
| EXLS Links: Profile News Message Board | |
| Charts:- Daily , Weekly | |
| Add EXLS to Watchlist: View: Get Complete EXLS Trend Analysis ➞ | |
 | SSB South State Corporation |
| Sector: Financials | |
| SubSector: Regional - Mid-Atlantic Banks | |
| MarketCap: 2113.49 Millions | |
| Recent Price: 81.16 Smart Investing & Trading Score: 47 | |
| Day Percent Change: 0.66% Day Change: 0.53 | |
| Week Change: 3.3% Year-to-date Change: -3.9% | |
| SSB Links: Profile News Message Board | |
| Charts:- Daily , Weekly | |
| Add SSB to Watchlist: View: Get Complete SSB Trend Analysis ➞ | |
 | SILK Silk Road Medical, Inc |
| Sector: Health Care | |
| SubSector: Medical Appliances & Equipment | |
| MarketCap: 881.78 Millions | |
| Recent Price: 20.95 Smart Investing & Trading Score: 70 | |
| Day Percent Change: 4.80% Day Change: 0.96 | |
| Week Change: 3.3% Year-to-date Change: 70.7% | |
| SILK Links: Profile News Message Board | |
| Charts:- Daily , Weekly | |
| Add SILK to Watchlist: View: Get Complete SILK Trend Analysis ➞ | |
 | TH Target Hospitality Corp. |
| Sector: Industrials | |
| SubSector: Conglomerates | |
| MarketCap: 218.048 Millions | |
| Recent Price: 11.57 Smart Investing & Trading Score: 88 | |
| Day Percent Change: -0.77% Day Change: -0.09 | |
| Week Change: 3.3% Year-to-date Change: 18.9% | |
| TH Links: Profile News Message Board | |
| Charts:- Daily , Weekly | |
| Add TH to Watchlist: View: Get Complete TH Trend Analysis ➞ | |
 | HLX Helix Energy Solutions Group, Inc. |
| Sector: Energy | |
| SubSector: Oil & Gas Equipment & Services | |
| MarketCap: 341.661 Millions | |
| Recent Price: 11.31 Smart Investing & Trading Score: 93 | |
| Day Percent Change: -2.16% Day Change: -0.25 | |
| Week Change: 3.29% Year-to-date Change: 10.0% | |
| HLX Links: Profile News Message Board | |
| Charts:- Daily , Weekly | |
| Add HLX to Watchlist: View: Get Complete HLX Trend Analysis ➞ | |
| Too many stocks? View smallcap stocks filtered by marketcap & sector |
| Marketcap: All SmallCap Stocks (default-no microcap), Large, Mid-Range, Small & MicroCap |
| Sector: Tech, Finance, Energy, Staples, Retail, Industrial, Materials, Utilities & Medical |
|
Best Stocks Today 12Stocks.com |
© 2024 12Stocks.com Terms & Conditions Privacy Contact Us
All Information Provided Only For Education And Not To Be Used For Investing or Trading. See Terms & Conditions


One More Thing ... Get Best Stocks Delivered Daily!
Never Ever Miss A Move With Our Top Ten Stocks Lists
Find Best Stocks In Any Market - Bull or Bear Market
Take A Peek At Our Top Ten Stocks Lists: Daily, Weekly, Year-to-Date & Top Trends
Find Best Stocks In Any Market - Bull or Bear Market
Take A Peek At Our Top Ten Stocks Lists: Daily, Weekly, Year-to-Date & Top Trends
Smallcap Stocks With Best Up Trends [0-bearish to 100-bullish]: iTeos [100], CareDx [100], ADMA Biologics[100], Guardant Health[100], Nelnet [100], RE/MAX [100], BioLife Solutions[100], ProKidney [100], MRC Global[100], Redwire [100], Consensus Cloud[100]
Best Smallcap Stocks Year-to-Date:
CareMax [516.49%], Janux [355.28%], Bakkt [341.26%], Viking [295.78%], Alpine Immune[241.07%], Longboard [229.3%], Avidity Biosciences[187.17%], Super Micro[180.9%], Sweetgreen [176.46%], Vera [166.93%], Cullinan Oncology[160.62%] Best Smallcap Stocks This Week:
Novavax [80.12%], Innodata [61.16%], DASAN Zhone[59.62%], Consensus Cloud[53.8%], Perficient [52.98%], CareDx [52.57%], iTeos [49.76%], Bakkt [47.31%], Sweetgreen [41.36%], Children s[41.26%], Telephone and[40.25%] Best Smallcap Stocks Daily:
Novavax [98.66%], iTeos [43.07%], CareDx [34.09%], Organogenesis [32.89%], Sweetgreen [30.79%], ADMA Biologics[27.13%], TELA Bio[16.80%], SkyWater [14.89%], Integral Ad[13.72%], Sharecare [12.94%], Harrow Health[12.73%]