
 Login Sign Up


| |||||
 |  | ||||

| 12Stocks.com Market Intelligence |
Best SmallCap Stocks
|
| In a hurry? Small Cap Stock Lists: Performance Trends Table, Stock Charts
Sort Small Cap stocks: Daily, Weekly, Year-to-Date, Market Cap & Trends. Filter Small Cap stocks list by sector: Show all, Tech, Finance, Energy, Staples, Retail, Industrial, Materials, Utilities and HealthCare Filter Small Cap stocks list by size: All Large Medium Small and MicroCap |
| 12Stocks.com Small Cap Stocks Performances & Trends Daily | |||||||||
|
|  The overall Smart Investing & Trading Score is 58 (0-bearish to 100-bullish) which puts Small Cap index in short term neutral trend. The Smart Investing & Trading Score from previous trading session is 63 and hence a deterioration of trend.
| ||||||||
Here are the Smart Investing & Trading Scores of the most requested small cap stocks at 12Stocks.com (click stock name for detailed review):
|


| 12Stocks.com: Investing in Smallcap Index with Stocks | |
|
The following table helps investors and traders sort through current performance and trends (as measured by Smart Investing & Trading Score) of various
stocks in the Smallcap Index. Quick View: Move mouse or cursor over stock symbol (ticker) to view short-term technical chart and over stock name to view long term chart. Click on  to add stock symbol to your watchlist and to add stock symbol to your watchlist and  to view watchlist. Click on any ticker or stock name for detailed market intelligence report for that stock. to view watchlist. Click on any ticker or stock name for detailed market intelligence report for that stock. |
12Stocks.com Performance of Stocks in Smallcap Index
| Ticker | Stock Name | Watchlist | Category | Recent Price | Smart Investing & Trading Score | Change % | Weekly Change% |
| BLBD | Blue Bird |   | Consumer Staples | 34.99 | 63 | -3.58% | 3.09% |
| RLAY | Relay | | Health Care | 6.34 | 7 | 7.46% | 3.09% |
| STAA | STAAR Surgical | | Health Care | 47.82 | 81 | -0.77% | 3.08% |
| OSIS | OSI Systems | | Industrials | 139.71 | 70 | -0.79% | 3.08% |
| FSS | Federal Signal | | Industrials | 83.33 | 63 | -0.51% | 3.08% |
| UNTY | Unity Bancorp | | Financials | 27.74 | 64 | 0.84% | 3.08% |
| ARR | ARMOUR Residential | | Financials | 18.73 | 49 | -1.37% | 3.08% |
| RLJ | RLJ Lodging | | Financials | 11.38 | 47 | -0.18% | 3.08% |
| BLFY | Blue Foundry | | Financials | 8.69 | 59 | 0.58% | 3.08% |
| WD | Walker & Dunlop | | Financials | 94.04 | 59 | 0.10% | 3.07% |
| PZZA | Papa John | | Services & Goods | 64.41 | 64 | 0.23% | 3.06% |
| HLNE | Hamilton Lane | | Financials | 113.34 | 25 | -0.13% | 3.06% |
| NVEC | NVE | | Technology | 80.38 | 45 | 1.97% | 3.05% |
| SLDP | Solid Power | | Industrials | 1.69 | 68 | -0.88% | 3.05% |
| COCO | Vita Coco | | Consumer Staples | 24.09 | 51 | 1.86% | 3.04% |
| CHCO | City Holding | | Financials | 106.14 | 93 | 2.21% | 3.04% |
| LILAK | Liberty Latin | | Technology | 7.48 | 93 | 0.47% | 3.03% |
| ADMA | ADMA Biologics | | Health Care | 6.46 | 90 | -1.22% | 3.03% |
| JBGS | JBG SMITH | | Financials | 15.29 | 55 | 0.92% | 3.03% |
| CRS | Carpenter | | Industrials | 80.40 | 100 | -0.14% | 3.02% |
| FFBC | First Financial | | Financials | 22.55 | 87 | -0.22% | 3.02% |
| CSTL | Castle Biosciences | | Health Care | 19.86 | 47 | -1.00% | 3.01% |
| KAR | KAR Auction | | Services & Goods | 17.50 | 90 | -0.34% | 3.00% |
| ASUR | Asure | | Technology | 7.20 | 32 | 2.42% | 3.00% |
| TRNS | Transcat | | Technology | 111.27 | 100 | -3.23% | 2.99% |


| Too many stocks? View smallcap stocks filtered by marketcap & sector |
| Marketcap: All SmallCap Stocks (default-no microcap), Large, Mid-Range, Small |
| Smallcap Sector: Tech, Finance, Energy, Staples, Retail, Industrial, Materials, & Medical |
|
Get the most comprehensive stock market coverage daily at 12Stocks.com ➞ Best Stocks Today ➞ Best Stocks Weekly ➞ Best Stocks Year-to-Date ➞ Best Stocks Trends ➞  Best Stocks Today 12Stocks.com Best Nasdaq Stocks ➞ Best S&P 500 Stocks ➞ Best Tech Stocks ➞ Best Biotech Stocks ➞ |
| Detailed Overview of SmallCap Stocks |
| SmallCap Technical Overview, Leaders & Laggards, Top SmallCap ETF Funds & Detailed SmallCap Stocks List, Charts, Trends & More |
| Smallcap: Technical Analysis, Trends & YTD Performance | |
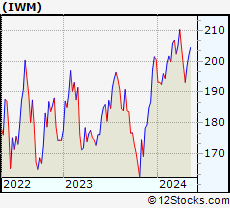
| SmallCap segment as represented by
IWM, an exchange-traded fund [ETF], holds basket of thousands of smallcap stocks from across all major sectors of the US stock market. The smallcap index (contains stocks like Riverbed & Sotheby's) is down by -1.51% and is currently underperforming the overall market by -7.17% year-to-date. Below is a quick view of technical charts and trends: | |
 IWM Weekly Chart |
|
| Long Term Trend: Good | |
| Medium Term Trend: Not Good | |
 IWM Daily Chart |
|
| Short Term Trend: Very Good | |
| Overall Trend Score: 58 | |
| YTD Performance: -1.51% | |
| **Trend Scores & Views Are Only For Educational Purposes And Not For Investing | |
| 12Stocks.com: Top Performing Small Cap Index Stocks | ||||||||||||||||||||||||||||||||||||||||||||||||
 The top performing Small Cap Index stocks year to date are
Now, more recently, over last week, the top performing Small Cap Index stocks on the move are


|
||||||||||||||||||||||||||||||||||||||||||||||||
| 12Stocks.com: Investing in Smallcap Index using Exchange Traded Funds | |
|
The following table shows list of key exchange traded funds (ETF) that
help investors track Smallcap index. The following list also includes leveraged ETF funds that track twice or thrice the daily returns of Smallcap indices. Short or inverse ETF funds move in the opposite direction to the index they track and are useful during market pullbacks or during bear markets. Quick View: Move mouse or cursor over ETF symbol (ticker) to view short-term technical chart and over ETF name to view long term chart. Click on ticker or stock name for detailed view. Click on to add stock symbol to your watchlist and to view watchlist. |
12Stocks.com List of ETFs that track Smallcap Index
| Ticker | ETF Name | Watchlist | Recent Price | Smart Investing & Trading Score | Change % | Week % | Year-to-date % |
| IWM | iShares Russell 2000 | | 197.68 | 58 | -0.45 | 2.35 | -1.51% |
| IJR | iShares Core S&P Small-Cap | | 105.71 | 85 | -0.24 | 2.41 | -2.35% |
| VTWO | Vanguard Russell 2000 ETF | | 79.93 | 63 | -0.45 | 2.37 | -1.44% |
| IWN | iShares Russell 2000 Value | | 151.28 | 75 | -0.30 | 2.37 | -2.61% |
| IWO | iShares Russell 2000 Growth | | 251.27 | 58 | -0.44 | 2.44 | -0.38% |
| IJS | iShares S&P Small-Cap 600 Value | | 97.71 | 60 | -0.43 | 2.2 | -5.2% |
| IJT | iShares S&P Small-Cap 600 Growth | | 125.37 | 70 | -0.28 | 2.59 | 0.18% |
| XSLV | PowerShares S&P SmallCap Low Volatil ETF | | 42.94 | 73 | -0.26 | 1.8 | -2.74% |
| SBB | ProShares Short SmallCap600 | | 16.37 | 33 | -0.02 | -2.79 | 2.76% |
| SMLV | SPDR SSGA US Small Cap Low Volatil ETF | | 108.43 | 73 | -0.31 | 2.21 | -3.63% |
| SAA | ProShares Ultra SmallCap600 | | 23.01 | 58 | -0.60 | 5.55 | -7.78% |
| SDD | ProShares UltraShort SmallCap600 | | 19.49 | 42 | 1.35 | -4.18 | 5.77% |
| 12Stocks.com: Charts, Trends, Fundamental Data and Performances of SmallCap Stocks | |
|
We now take in-depth look at all SmallCap stocks including charts, multi-period performances and overall trends (as measured by Smart Investing & Trading Score). One can sort SmallCap stocks (click link to choose) by Daily, Weekly and by Year-to-Date performances. Also, one can sort by size of the company or by market capitalization. |
| Select Your Default Chart Type: | |||||
| |||||
| Click on stock symbol or name for detailed view. Click on to add stock symbol to your watchlist and to view watchlist. Quick View: Move mouse or cursor over "Daily" to quickly view daily technical stock chart and over "Weekly" to view weekly technical stock chart. | |||||

 | BLBD Blue Bird Corporation |
| Sector: Consumer Staples | |
| SubSector: Auto Manufacturers - Major | |
| MarketCap: 345.371 Millions | |
| Recent Price: 34.99 Smart Investing & Trading Score: 63 | |
| Day Percent Change: -3.58% Day Change: -1.30 | |
| Week Change: 3.09% Year-to-date Change: 29.8% | |
| BLBD Links: Profile News Message Board | |
| Charts:- Daily , Weekly | |
| Add BLBD to Watchlist: View: Get Complete BLBD Trend Analysis ➞ | |
 | RLAY Relay Therapeutics, Inc. |
| Sector: Health Care | |
| SubSector: Biotechnology | |
| MarketCap: 45887 Millions | |
| Recent Price: 6.34 Smart Investing & Trading Score: 7 | |
| Day Percent Change: 7.46% Day Change: 0.44 | |
| Week Change: 3.09% Year-to-date Change: -42.4% | |
| RLAY Links: Profile News Message Board | |
| Charts:- Daily , Weekly | |
| Add RLAY to Watchlist: View: Get Complete RLAY Trend Analysis ➞ | |
 | STAA STAAR Surgical Company |
| Sector: Health Care | |
| SubSector: Medical Instruments & Supplies | |
| MarketCap: 1334.6 Millions | |
| Recent Price: 47.82 Smart Investing & Trading Score: 81 | |
| Day Percent Change: -0.77% Day Change: -0.37 | |
| Week Change: 3.08% Year-to-date Change: 53.2% | |
| STAA Links: Profile News Message Board | |
| Charts:- Daily , Weekly | |
| Add STAA to Watchlist: View: Get Complete STAA Trend Analysis ➞ | |
 | OSIS OSI Systems, Inc. |
| Sector: Industrials | |
| SubSector: Industrial Electrical Equipment | |
| MarketCap: 1100.39 Millions | |
| Recent Price: 139.71 Smart Investing & Trading Score: 70 | |
| Day Percent Change: -0.79% Day Change: -1.11 | |
| Week Change: 3.08% Year-to-date Change: 8.3% | |
| OSIS Links: Profile News Message Board | |
| Charts:- Daily , Weekly | |
| Add OSIS to Watchlist: View: Get Complete OSIS Trend Analysis ➞ | |
 | FSS Federal Signal Corporation |
| Sector: Industrials | |
| SubSector: Pollution & Treatment Controls | |
| MarketCap: 1694.05 Millions | |
| Recent Price: 83.33 Smart Investing & Trading Score: 63 | |
| Day Percent Change: -0.51% Day Change: -0.43 | |
| Week Change: 3.08% Year-to-date Change: 8.6% | |
| FSS Links: Profile News Message Board | |
| Charts:- Daily , Weekly | |
| Add FSS to Watchlist: View: Get Complete FSS Trend Analysis ➞ | |
 | UNTY Unity Bancorp, Inc. |
| Sector: Financials | |
| SubSector: Money Center Banks | |
| MarketCap: 149.099 Millions | |
| Recent Price: 27.74 Smart Investing & Trading Score: 64 | |
| Day Percent Change: 0.84% Day Change: 0.23 | |
| Week Change: 3.08% Year-to-date Change: -6.3% | |
| UNTY Links: Profile News Message Board | |
| Charts:- Daily , Weekly | |
| Add UNTY to Watchlist: View: Get Complete UNTY Trend Analysis ➞ | |
 | ARR ARMOUR Residential REIT, Inc. |
| Sector: Financials | |
| SubSector: Mortgage Investment | |
| MarketCap: 578.739 Millions | |
| Recent Price: 18.73 Smart Investing & Trading Score: 49 | |
| Day Percent Change: -1.37% Day Change: -0.26 | |
| Week Change: 3.08% Year-to-date Change: -3.1% | |
| ARR Links: Profile News Message Board | |
| Charts:- Daily , Weekly | |
| Add ARR to Watchlist: View: Get Complete ARR Trend Analysis ➞ | |
 | RLJ RLJ Lodging Trust |
| Sector: Financials | |
| SubSector: REIT - Hotel/Motel | |
| MarketCap: 1019.34 Millions | |
| Recent Price: 11.38 Smart Investing & Trading Score: 47 | |
| Day Percent Change: -0.18% Day Change: -0.02 | |
| Week Change: 3.08% Year-to-date Change: -2.9% | |
| RLJ Links: Profile News Message Board | |
| Charts:- Daily , Weekly | |
| Add RLJ to Watchlist: View: Get Complete RLJ Trend Analysis ➞ | |
 | BLFY Blue Foundry Bancorp |
| Sector: Financials | |
| SubSector: Banks - Regional | |
| MarketCap: 264 Millions | |
| Recent Price: 8.69 Smart Investing & Trading Score: 59 | |
| Day Percent Change: 0.58% Day Change: 0.05 | |
| Week Change: 3.08% Year-to-date Change: -9.8% | |
| BLFY Links: Profile News Message Board | |
| Charts:- Daily , Weekly | |
| Add BLFY to Watchlist: View: Get Complete BLFY Trend Analysis ➞ | |
 | WD Walker & Dunlop, Inc. |
| Sector: Financials | |
| SubSector: Mortgage Investment | |
| MarketCap: 1312.99 Millions | |
| Recent Price: 94.04 Smart Investing & Trading Score: 59 | |
| Day Percent Change: 0.10% Day Change: 0.09 | |
| Week Change: 3.07% Year-to-date Change: -15.3% | |
| WD Links: Profile News Message Board | |
| Charts:- Daily , Weekly | |
| Add WD to Watchlist: View: Get Complete WD Trend Analysis ➞ | |
 | PZZA Papa John s International, Inc. |
| Sector: Services & Goods | |
| SubSector: Specialty Eateries | |
| MarketCap: 1925.27 Millions | |
| Recent Price: 64.41 Smart Investing & Trading Score: 64 | |
| Day Percent Change: 0.23% Day Change: 0.15 | |
| Week Change: 3.06% Year-to-date Change: -15.5% | |
| PZZA Links: Profile News Message Board | |
| Charts:- Daily , Weekly | |
| Add PZZA to Watchlist: View: Get Complete PZZA Trend Analysis ➞ | |
 | HLNE Hamilton Lane Incorporated |
| Sector: Financials | |
| SubSector: Asset Management | |
| MarketCap: 2484.13 Millions | |
| Recent Price: 113.34 Smart Investing & Trading Score: 25 | |
| Day Percent Change: -0.13% Day Change: -0.15 | |
| Week Change: 3.06% Year-to-date Change: -0.1% | |
| HLNE Links: Profile News Message Board | |
| Charts:- Daily , Weekly | |
| Add HLNE to Watchlist: View: Get Complete HLNE Trend Analysis ➞ | |
 | NVEC NVE Corporation |
| Sector: Technology | |
| SubSector: Semiconductor - Specialized | |
| MarketCap: 231.26 Millions | |
| Recent Price: 80.38 Smart Investing & Trading Score: 45 | |
| Day Percent Change: 1.97% Day Change: 1.55 | |
| Week Change: 3.05% Year-to-date Change: 2.5% | |
| NVEC Links: Profile News Message Board | |
| Charts:- Daily , Weekly | |
| Add NVEC to Watchlist: View: Get Complete NVEC Trend Analysis ➞ | |
 | SLDP Solid Power, Inc. |
| Sector: Industrials | |
| SubSector: Electrical Equipment & Parts | |
| MarketCap: 445 Millions | |
| Recent Price: 1.69 Smart Investing & Trading Score: 68 | |
| Day Percent Change: -0.88% Day Change: -0.02 | |
| Week Change: 3.05% Year-to-date Change: 18.6% | |
| SLDP Links: Profile News Message Board | |
| Charts:- Daily , Weekly | |
| Add SLDP to Watchlist: View: Get Complete SLDP Trend Analysis ➞ | |
 | COCO The Vita Coco Company, Inc. |
| Sector: Consumer Staples | |
| SubSector: Beverages - Non-Alcoholic | |
| MarketCap: 1510 Millions | |
| Recent Price: 24.09 Smart Investing & Trading Score: 51 | |
| Day Percent Change: 1.86% Day Change: 0.44 | |
| Week Change: 3.04% Year-to-date Change: -6.5% | |
| COCO Links: Profile News Message Board | |
| Charts:- Daily , Weekly | |
| Add COCO to Watchlist: View: Get Complete COCO Trend Analysis ➞ | |
 | CHCO City Holding Company |
| Sector: Financials | |
| SubSector: Regional - Mid-Atlantic Banks | |
| MarketCap: 1059.59 Millions | |
| Recent Price: 106.14 Smart Investing & Trading Score: 93 | |
| Day Percent Change: 2.21% Day Change: 2.29 | |
| Week Change: 3.04% Year-to-date Change: -3.7% | |
| CHCO Links: Profile News Message Board | |
| Charts:- Daily , Weekly | |
| Add CHCO to Watchlist: View: Get Complete CHCO Trend Analysis ➞ | |
 | LILAK Liberty Latin America Ltd. |
| Sector: Technology | |
| SubSector: CATV Systems | |
| MarketCap: 1210.32 Millions | |
| Recent Price: 7.48 Smart Investing & Trading Score: 93 | |
| Day Percent Change: 0.47% Day Change: 0.04 | |
| Week Change: 3.03% Year-to-date Change: 1.9% | |
| LILAK Links: Profile News Message Board | |
| Charts:- Daily , Weekly | |
| Add LILAK to Watchlist: View: Get Complete LILAK Trend Analysis ➞ | |
 | ADMA ADMA Biologics, Inc. |
| Sector: Health Care | |
| SubSector: Biotechnology | |
| MarketCap: 204.985 Millions | |
| Recent Price: 6.46 Smart Investing & Trading Score: 90 | |
| Day Percent Change: -1.22% Day Change: -0.08 | |
| Week Change: 3.03% Year-to-date Change: 42.9% | |
| ADMA Links: Profile News Message Board | |
| Charts:- Daily , Weekly | |
| Add ADMA to Watchlist: View: Get Complete ADMA Trend Analysis ➞ | |
 | JBGS JBG SMITH Properties |
| Sector: Financials | |
| SubSector: Property Management | |
| MarketCap: 4335.32 Millions | |
| Recent Price: 15.29 Smart Investing & Trading Score: 55 | |
| Day Percent Change: 0.92% Day Change: 0.14 | |
| Week Change: 3.03% Year-to-date Change: -10.1% | |
| JBGS Links: Profile News Message Board | |
| Charts:- Daily , Weekly | |
| Add JBGS to Watchlist: View: Get Complete JBGS Trend Analysis ➞ | |
 | CRS Carpenter Technology Corporation |
| Sector: Industrials | |
| SubSector: Metal Fabrication | |
| MarketCap: 853.35 Millions | |
| Recent Price: 80.40 Smart Investing & Trading Score: 100 | |
| Day Percent Change: -0.14% Day Change: -0.11 | |
| Week Change: 3.02% Year-to-date Change: 13.6% | |
| CRS Links: Profile News Message Board | |
| Charts:- Daily , Weekly | |
| Add CRS to Watchlist: View: Get Complete CRS Trend Analysis ➞ | |
 | FFBC First Financial Bancorp. |
| Sector: Financials | |
| SubSector: Regional - Midwest Banks | |
| MarketCap: 1363.7 Millions | |
| Recent Price: 22.55 Smart Investing & Trading Score: 87 | |
| Day Percent Change: -0.22% Day Change: -0.05 | |
| Week Change: 3.02% Year-to-date Change: -5.1% | |
| FFBC Links: Profile News Message Board | |
| Charts:- Daily , Weekly | |
| Add FFBC to Watchlist: View: Get Complete FFBC Trend Analysis ➞ | |
 | CSTL Castle Biosciences, Inc. |
| Sector: Health Care | |
| SubSector: Medical Laboratories & Research | |
| MarketCap: 545 Millions | |
| Recent Price: 19.86 Smart Investing & Trading Score: 47 | |
| Day Percent Change: -1.00% Day Change: -0.20 | |
| Week Change: 3.01% Year-to-date Change: -8.0% | |
| CSTL Links: Profile News Message Board | |
| Charts:- Daily , Weekly | |
| Add CSTL to Watchlist: View: Get Complete CSTL Trend Analysis ➞ | |
 | KAR KAR Auction Services, Inc. |
| Sector: Services & Goods | |
| SubSector: Specialty Retail, Other | |
| MarketCap: 1709.54 Millions | |
| Recent Price: 17.50 Smart Investing & Trading Score: 90 | |
| Day Percent Change: -0.34% Day Change: -0.06 | |
| Week Change: 3% Year-to-date Change: 18.2% | |
| KAR Links: Profile News Message Board | |
| Charts:- Daily , Weekly | |
| Add KAR to Watchlist: View: Get Complete KAR Trend Analysis ➞ | |
 | ASUR Asure Software, Inc. |
| Sector: Technology | |
| SubSector: Business Software & Services | |
| MarketCap: 103.758 Millions | |
| Recent Price: 7.20 Smart Investing & Trading Score: 32 | |
| Day Percent Change: 2.42% Day Change: 0.17 | |
| Week Change: 3% Year-to-date Change: -24.4% | |
| ASUR Links: Profile News Message Board | |
| Charts:- Daily , Weekly | |
| Add ASUR to Watchlist: View: Get Complete ASUR Trend Analysis ➞ | |
 | TRNS Transcat, Inc. |
| Sector: Technology | |
| SubSector: Scientific & Technical Instruments | |
| MarketCap: 216.653 Millions | |
| Recent Price: 111.27 Smart Investing & Trading Score: 100 | |
| Day Percent Change: -3.23% Day Change: -3.71 | |
| Week Change: 2.99% Year-to-date Change: 1.8% | |
| TRNS Links: Profile News Message Board | |
| Charts:- Daily , Weekly | |
| Add TRNS to Watchlist: View: Get Complete TRNS Trend Analysis ➞ | |
| Too many stocks? View smallcap stocks filtered by marketcap & sector |
| Marketcap: All SmallCap Stocks (default-no microcap), Large, Mid-Range, Small & MicroCap |
| Sector: Tech, Finance, Energy, Staples, Retail, Industrial, Materials, Utilities & Medical |
|
Best Stocks Today 12Stocks.com |
© 2024 12Stocks.com Terms & Conditions Privacy Contact Us
All Information Provided Only For Education And Not To Be Used For Investing or Trading. See Terms & Conditions


One More Thing ... Get Best Stocks Delivered Daily!
Never Ever Miss A Move With Our Top Ten Stocks Lists
Find Best Stocks In Any Market - Bull or Bear Market
Take A Peek At Our Top Ten Stocks Lists: Daily, Weekly, Year-to-Date & Top Trends
Find Best Stocks In Any Market - Bull or Bear Market
Take A Peek At Our Top Ten Stocks Lists: Daily, Weekly, Year-to-Date & Top Trends
Smallcap Stocks With Best Up Trends [0-bearish to 100-bullish]: B. Riley[100], Ribbon [100], Group 1[100], Trustmark [100], MBIA [100], Integer [100], EchoStar [100], Comstock Resources[100], Vishay Inter[100], First Ban[100], Jamf Holding[100]
Best Smallcap Stocks Year-to-Date:
CareMax [574.23%], Janux [352.07%], Viking [249.65%], Alpine Immune[239.13%], Longboard [223.4%], Avidity Biosciences[177.71%], Arcutis Bio[170.9%], Super Micro[165.5%], Vera [149.61%], Hippo [130.79%], Y-mAbs [124.19%] Best Smallcap Stocks This Week:
Matterport [166.09%], B. Riley[48.82%], Seres [30.29%], Riot Blockchain[30.12%], CareMax [27.24%], Ribbon [25.97%], ProKidney [23.28%], SoundHound AI[22.54%], Cipher Mining[22.14%], Hibbett Sports[21.61%], Cullinan Oncology[20.69%] Best Smallcap Stocks Daily:
B. Riley[36.97%], Ribbon [26.46%], Babcock & Wilcox Enterprises[15.57%], Cullinan Oncology[13.55%], Amneal [12.04%], Comtech Tele[10.76%], Innodata [10.28%], Gritstone Oncology[10.06%], Navitas Semiconductor[8.83%], Eyenovia [8.68%], K12 [8.64%]