
 Login Sign Up


| |||||
 |  | ||||

| 12Stocks.com Market Intelligence |
Best SmallCap Stocks
|
| In a hurry? Small Cap Stock Lists: Performance Trends Table, Stock Charts
Sort Small Cap stocks: Daily, Weekly, Year-to-Date, Market Cap & Trends. Filter Small Cap stocks list by sector: Show all, Tech, Finance, Energy, Staples, Retail, Industrial, Materials, Utilities and HealthCare Filter Small Cap stocks list by size: All Large Medium Small and MicroCap |
| 12Stocks.com Small Cap Stocks Performances & Trends Daily | |||||||||
|
|  The overall Smart Investing & Trading Score is 58 (0-bearish to 100-bullish) which puts Small Cap index in short term neutral trend. The Smart Investing & Trading Score from previous trading session is 63 and hence a deterioration of trend.
| ||||||||
Here are the Smart Investing & Trading Scores of the most requested small cap stocks at 12Stocks.com (click stock name for detailed review):
|


| 12Stocks.com: Investing in Smallcap Index with Stocks | |
|
The following table helps investors and traders sort through current performance and trends (as measured by Smart Investing & Trading Score) of various
stocks in the Smallcap Index. Quick View: Move mouse or cursor over stock symbol (ticker) to view short-term technical chart and over stock name to view long term chart. Click on  to add stock symbol to your watchlist and to add stock symbol to your watchlist and  to view watchlist. Click on any ticker or stock name for detailed market intelligence report for that stock. to view watchlist. Click on any ticker or stock name for detailed market intelligence report for that stock. |
12Stocks.com Performance of Stocks in Smallcap Index
| Ticker | Stock Name | Watchlist | Category | Recent Price | Smart Investing & Trading Score | Change % | Weekly Change% |
| WSR | Whitestone REIT |   | Financials | 11.38 | 42 | -1.04% | 1.43% |
| RWT | Redwood Trust | | Financials | 5.76 | 49 | -1.71% | 1.41% |
| ATNI | ATN | | Technology | 28.72 | 49 | 1.63% | 1.41% |
| PUMP | ProPetro Holding | | Energy | 8.66 | 28 | 0.23% | 1.41% |
| EMBC | Embecta | | Health Care | 10.77 | 52 | -1.10% | 1.41% |
| HNI | HNI | | Consumer Staples | 42.73 | 58 | -1.48% | 1.40% |
| B | Barnes Group | | Industrials | 36.26 | 76 | 0.00% | 1.40% |
| TTGT | TechTarget | | Technology | 27.55 | 35 | 1.03% | 1.40% |
| INVA | Innoviva | | Health Care | 15.16 | 64 | -0.07% | 1.40% |
| FPI | Farmland Partners | | Financials | 10.90 | 60 | 0.46% | 1.40% |
| FELE | Franklin Electric | | Industrials | 102.85 | 83 | -0.74% | 1.39% |
| CASH | Meta Financial | | Financials | 51.09 | 62 | 0.67% | 1.39% |
| FTDR | frontdoor | | Services & Goods | 30.92 | 37 | -0.42% | 1.39% |
| CRSR | Corsair Gaming | | Technology | 10.94 | 25 | -0.64% | 1.39% |
| KAI | Kadant | | Industrials | 285.89 | 45 | -1.25% | 1.38% |
| TRST | TrustCo Bank | | Financials | 27.30 | 47 | -2.15% | 1.37% |
| BUSE | First Busey | | Financials | 23.12 | 35 | -0.64% | 1.36% |
| ONTF | ON24 | | Technology | 6.72 | 40 | 0.00% | 1.36% |
| CMPX | Compass | | Health Care | 1.49 | 46 | -1.32% | 1.36% |
| LTC | LTC Properties | | Financials | 32.23 | 93 | 0.34% | 1.35% |
| NPO | EnPro Industries | | Industrials | 151.03 | 58 | -0.19% | 1.35% |
| LEGH | Legacy Housing | | Industrials | 20.21 | 28 | 0.80% | 1.35% |
| SCS | Steelcase | | Consumer Staples | 12.10 | 42 | -2.58% | 1.34% |
| PX | P10 | | Financials | 7.59 | 53 | 0.00% | 1.34% |
| ESNT | Essent Group | | Financials | 54.17 | 39 | 0.04% | 1.33% |


| Too many stocks? View smallcap stocks filtered by marketcap & sector |
| Marketcap: All SmallCap Stocks (default-no microcap), Large, Mid-Range, Small |
| Smallcap Sector: Tech, Finance, Energy, Staples, Retail, Industrial, Materials, & Medical |
|
Get the most comprehensive stock market coverage daily at 12Stocks.com ➞ Best Stocks Today ➞ Best Stocks Weekly ➞ Best Stocks Year-to-Date ➞ Best Stocks Trends ➞  Best Stocks Today 12Stocks.com Best Nasdaq Stocks ➞ Best S&P 500 Stocks ➞ Best Tech Stocks ➞ Best Biotech Stocks ➞ |
| Detailed Overview of SmallCap Stocks |
| SmallCap Technical Overview, Leaders & Laggards, Top SmallCap ETF Funds & Detailed SmallCap Stocks List, Charts, Trends & More |
| Smallcap: Technical Analysis, Trends & YTD Performance | |
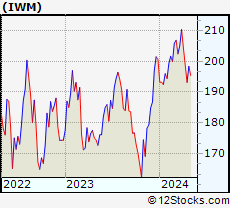
| SmallCap segment as represented by
IWM, an exchange-traded fund [ETF], holds basket of thousands of smallcap stocks from across all major sectors of the US stock market. The smallcap index (contains stocks like Riverbed & Sotheby's) is down by -1.51% and is currently underperforming the overall market by -7.17% year-to-date. Below is a quick view of technical charts and trends: | |
 IWM Weekly Chart |
|
| Long Term Trend: Good | |
| Medium Term Trend: Not Good | |
 IWM Daily Chart |
|
| Short Term Trend: Very Good | |
| Overall Trend Score: 58 | |
| YTD Performance: -1.51% | |
| **Trend Scores & Views Are Only For Educational Purposes And Not For Investing | |
| 12Stocks.com: Top Performing Small Cap Index Stocks | ||||||||||||||||||||||||||||||||||||||||||||||||
 The top performing Small Cap Index stocks year to date are
Now, more recently, over last week, the top performing Small Cap Index stocks on the move are


|
||||||||||||||||||||||||||||||||||||||||||||||||
| 12Stocks.com: Investing in Smallcap Index using Exchange Traded Funds | |
|
The following table shows list of key exchange traded funds (ETF) that
help investors track Smallcap index. The following list also includes leveraged ETF funds that track twice or thrice the daily returns of Smallcap indices. Short or inverse ETF funds move in the opposite direction to the index they track and are useful during market pullbacks or during bear markets. Quick View: Move mouse or cursor over ETF symbol (ticker) to view short-term technical chart and over ETF name to view long term chart. Click on ticker or stock name for detailed view. Click on to add stock symbol to your watchlist and to view watchlist. |
12Stocks.com List of ETFs that track Smallcap Index
| Ticker | ETF Name | Watchlist | Recent Price | Smart Investing & Trading Score | Change % | Week % | Year-to-date % |
| IWM | iShares Russell 2000 | | 197.68 | 58 | -0.45 | 2.35 | -1.51% |
| IJR | iShares Core S&P Small-Cap | | 105.71 | 85 | -0.24 | 2.41 | -2.35% |
| VTWO | Vanguard Russell 2000 ETF | | 79.93 | 63 | -0.45 | 2.37 | -1.44% |
| IWN | iShares Russell 2000 Value | | 151.28 | 75 | -0.30 | 2.37 | -2.61% |
| IWO | iShares Russell 2000 Growth | | 251.27 | 58 | -0.44 | 2.44 | -0.38% |
| IJS | iShares S&P Small-Cap 600 Value | | 97.71 | 60 | -0.43 | 2.2 | -5.2% |
| IJT | iShares S&P Small-Cap 600 Growth | | 125.37 | 70 | -0.28 | 2.59 | 0.18% |
| XSLV | PowerShares S&P SmallCap Low Volatil ETF | | 42.94 | 73 | -0.26 | 1.8 | -2.74% |
| SBB | ProShares Short SmallCap600 | | 16.37 | 33 | -0.02 | -2.79 | 2.76% |
| SMLV | SPDR SSGA US Small Cap Low Volatil ETF | | 108.43 | 73 | -0.31 | 2.21 | -3.63% |
| SAA | ProShares Ultra SmallCap600 | | 23.01 | 58 | -0.60 | 5.55 | -7.78% |
| SDD | ProShares UltraShort SmallCap600 | | 19.49 | 42 | 1.35 | -4.18 | 5.77% |
| 12Stocks.com: Charts, Trends, Fundamental Data and Performances of SmallCap Stocks | |
|
We now take in-depth look at all SmallCap stocks including charts, multi-period performances and overall trends (as measured by Smart Investing & Trading Score). One can sort SmallCap stocks (click link to choose) by Daily, Weekly and by Year-to-Date performances. Also, one can sort by size of the company or by market capitalization. |
| Select Your Default Chart Type: | |||||
| |||||
| Click on stock symbol or name for detailed view. Click on to add stock symbol to your watchlist and to view watchlist. Quick View: Move mouse or cursor over "Daily" to quickly view daily technical stock chart and over "Weekly" to view weekly technical stock chart. | |||||

 | WSR Whitestone REIT |
| Sector: Financials | |
| SubSector: REIT - Retail | |
| MarketCap: 316.114 Millions | |
| Recent Price: 11.38 Smart Investing & Trading Score: 42 | |
| Day Percent Change: -1.04% Day Change: -0.12 | |
| Week Change: 1.43% Year-to-date Change: -7.4% | |
| WSR Links: Profile News Message Board | |
| Charts:- Daily , Weekly | |
| Add WSR to Watchlist: View: Get Complete WSR Trend Analysis ➞ | |
 | RWT Redwood Trust, Inc. |
| Sector: Financials | |
| SubSector: Mortgage Investment | |
| MarketCap: 674.739 Millions | |
| Recent Price: 5.76 Smart Investing & Trading Score: 49 | |
| Day Percent Change: -1.71% Day Change: -0.10 | |
| Week Change: 1.41% Year-to-date Change: -22.3% | |
| RWT Links: Profile News Message Board | |
| Charts:- Daily , Weekly | |
| Add RWT to Watchlist: View: Get Complete RWT Trend Analysis ➞ | |
 | ATNI ATN International, Inc. |
| Sector: Technology | |
| SubSector: Telecom Services - Domestic | |
| MarketCap: 1014.77 Millions | |
| Recent Price: 28.72 Smart Investing & Trading Score: 49 | |
| Day Percent Change: 1.63% Day Change: 0.46 | |
| Week Change: 1.41% Year-to-date Change: -26.3% | |
| ATNI Links: Profile News Message Board | |
| Charts:- Daily , Weekly | |
| Add ATNI to Watchlist: View: Get Complete ATNI Trend Analysis ➞ | |
 | PUMP ProPetro Holding Corp. |
| Sector: Energy | |
| SubSector: Oil & Gas Equipment & Services | |
| MarketCap: 181.261 Millions | |
| Recent Price: 8.66 Smart Investing & Trading Score: 28 | |
| Day Percent Change: 0.23% Day Change: 0.02 | |
| Week Change: 1.41% Year-to-date Change: 3.3% | |
| PUMP Links: Profile News Message Board | |
| Charts:- Daily , Weekly | |
| Add PUMP to Watchlist: View: Get Complete PUMP Trend Analysis ➞ | |
 | EMBC Embecta Corp. |
| Sector: Health Care | |
| SubSector: Medical Instruments & Supplies | |
| MarketCap: 1260 Millions | |
| Recent Price: 10.77 Smart Investing & Trading Score: 52 | |
| Day Percent Change: -1.10% Day Change: -0.12 | |
| Week Change: 1.41% Year-to-date Change: -43.6% | |
| EMBC Links: Profile News Message Board | |
| Charts:- Daily , Weekly | |
| Add EMBC to Watchlist: View: Get Complete EMBC Trend Analysis ➞ | |
 | HNI HNI Corporation |
| Sector: Consumer Staples | |
| SubSector: Business Equipment | |
| MarketCap: 1053.67 Millions | |
| Recent Price: 42.73 Smart Investing & Trading Score: 58 | |
| Day Percent Change: -1.48% Day Change: -0.64 | |
| Week Change: 1.4% Year-to-date Change: 2.2% | |
| HNI Links: Profile News Message Board | |
| Charts:- Daily , Weekly | |
| Add HNI to Watchlist: View: Get Complete HNI Trend Analysis ➞ | |
 | B Barnes Group Inc. |
| Sector: Industrials | |
| SubSector: Industrial Equipment & Components | |
| MarketCap: 2189.79 Millions | |
| Recent Price: 36.26 Smart Investing & Trading Score: 76 | |
| Day Percent Change: 0.00% Day Change: 0.00 | |
| Week Change: 1.4% Year-to-date Change: 11.1% | |
| B Links: Profile News Message Board | |
| Charts:- Daily , Weekly | |
| Add B to Watchlist: View: Get Complete B Trend Analysis ➞ | |
 | TTGT TechTarget, Inc. |
| Sector: Technology | |
| SubSector: Internet Information Providers | |
| MarketCap: 560.78 Millions | |
| Recent Price: 27.55 Smart Investing & Trading Score: 35 | |
| Day Percent Change: 1.03% Day Change: 0.28 | |
| Week Change: 1.4% Year-to-date Change: -21.0% | |
| TTGT Links: Profile News Message Board | |
| Charts:- Daily , Weekly | |
| Add TTGT to Watchlist: View: Get Complete TTGT Trend Analysis ➞ | |
 | INVA Innoviva, Inc. |
| Sector: Health Care | |
| SubSector: Biotechnology | |
| MarketCap: 1023.15 Millions | |
| Recent Price: 15.16 Smart Investing & Trading Score: 64 | |
| Day Percent Change: -0.07% Day Change: -0.01 | |
| Week Change: 1.4% Year-to-date Change: -5.5% | |
| INVA Links: Profile News Message Board | |
| Charts:- Daily , Weekly | |
| Add INVA to Watchlist: View: Get Complete INVA Trend Analysis ➞ | |
 | FPI Farmland Partners Inc. |
| Sector: Financials | |
| SubSector: REIT - Diversified | |
| MarketCap: 182.653 Millions | |
| Recent Price: 10.90 Smart Investing & Trading Score: 60 | |
| Day Percent Change: 0.46% Day Change: 0.05 | |
| Week Change: 1.4% Year-to-date Change: -12.7% | |
| FPI Links: Profile News Message Board | |
| Charts:- Daily , Weekly | |
| Add FPI to Watchlist: View: Get Complete FPI Trend Analysis ➞ | |
 | FELE Franklin Electric Co., Inc. |
| Sector: Industrials | |
| SubSector: Industrial Electrical Equipment | |
| MarketCap: 2397.89 Millions | |
| Recent Price: 102.85 Smart Investing & Trading Score: 83 | |
| Day Percent Change: -0.74% Day Change: -0.77 | |
| Week Change: 1.39% Year-to-date Change: 6.4% | |
| FELE Links: Profile News Message Board | |
| Charts:- Daily , Weekly | |
| Add FELE to Watchlist: View: Get Complete FELE Trend Analysis ➞ | |
 | CASH Meta Financial Group, Inc. |
| Sector: Financials | |
| SubSector: Savings & Loans | |
| MarketCap: 849.33 Millions | |
| Recent Price: 51.09 Smart Investing & Trading Score: 62 | |
| Day Percent Change: 0.67% Day Change: 0.34 | |
| Week Change: 1.39% Year-to-date Change: -3.5% | |
| CASH Links: Profile News Message Board | |
| Charts:- Daily , Weekly | |
| Add CASH to Watchlist: View: Get Complete CASH Trend Analysis ➞ | |
 | FTDR frontdoor, inc. |
| Sector: Services & Goods | |
| SubSector: Business Services | |
| MarketCap: 2974.22 Millions | |
| Recent Price: 30.92 Smart Investing & Trading Score: 37 | |
| Day Percent Change: -0.42% Day Change: -0.13 | |
| Week Change: 1.39% Year-to-date Change: -12.2% | |
| FTDR Links: Profile News Message Board | |
| Charts:- Daily , Weekly | |
| Add FTDR to Watchlist: View: Get Complete FTDR Trend Analysis ➞ | |
 | CRSR Corsair Gaming, Inc. |
| Sector: Technology | |
| SubSector: Computer Hardware | |
| MarketCap: 32187 Millions | |
| Recent Price: 10.94 Smart Investing & Trading Score: 25 | |
| Day Percent Change: -0.64% Day Change: -0.07 | |
| Week Change: 1.39% Year-to-date Change: -22.5% | |
| CRSR Links: Profile News Message Board | |
| Charts:- Daily , Weekly | |
| Add CRSR to Watchlist: View: Get Complete CRSR Trend Analysis ➞ | |
 | KAI Kadant Inc. |
| Sector: Industrials | |
| SubSector: Diversified Machinery | |
| MarketCap: 787.116 Millions | |
| Recent Price: 285.89 Smart Investing & Trading Score: 45 | |
| Day Percent Change: -1.25% Day Change: -3.61 | |
| Week Change: 1.38% Year-to-date Change: 2.0% | |
| KAI Links: Profile News Message Board | |
| Charts:- Daily , Weekly | |
| Add KAI to Watchlist: View: Get Complete KAI Trend Analysis ➞ | |
 | TRST TrustCo Bank Corp NY |
| Sector: Financials | |
| SubSector: Regional - Northeast Banks | |
| MarketCap: 543.999 Millions | |
| Recent Price: 27.30 Smart Investing & Trading Score: 47 | |
| Day Percent Change: -2.15% Day Change: -0.60 | |
| Week Change: 1.37% Year-to-date Change: -12.1% | |
| TRST Links: Profile News Message Board | |
| Charts:- Daily , Weekly | |
| Add TRST to Watchlist: View: Get Complete TRST Trend Analysis ➞ | |
 | BUSE First Busey Corporation |
| Sector: Financials | |
| SubSector: Regional - Midwest Banks | |
| MarketCap: 876.97 Millions | |
| Recent Price: 23.12 Smart Investing & Trading Score: 35 | |
| Day Percent Change: -0.64% Day Change: -0.15 | |
| Week Change: 1.36% Year-to-date Change: -6.9% | |
| BUSE Links: Profile News Message Board | |
| Charts:- Daily , Weekly | |
| Add BUSE to Watchlist: View: Get Complete BUSE Trend Analysis ➞ | |
 | ONTF ON24, Inc. |
| Sector: Technology | |
| SubSector: Software - Application | |
| MarketCap: 386 Millions | |
| Recent Price: 6.72 Smart Investing & Trading Score: 40 | |
| Day Percent Change: 0.00% Day Change: 0.00 | |
| Week Change: 1.36% Year-to-date Change: -14.8% | |
| ONTF Links: Profile News Message Board | |
| Charts:- Daily , Weekly | |
| Add ONTF to Watchlist: View: Get Complete ONTF Trend Analysis ➞ | |
 | CMPX Compass Therapeutics, Inc. |
| Sector: Health Care | |
| SubSector: Biotechnology | |
| MarketCap: 406 Millions | |
| Recent Price: 1.49 Smart Investing & Trading Score: 46 | |
| Day Percent Change: -1.32% Day Change: -0.02 | |
| Week Change: 1.36% Year-to-date Change: -2.9% | |
| CMPX Links: Profile News Message Board | |
| Charts:- Daily , Weekly | |
| Add CMPX to Watchlist: View: Get Complete CMPX Trend Analysis ➞ | |
 | LTC LTC Properties, Inc. |
| Sector: Financials | |
| SubSector: REIT - Healthcare Facilities | |
| MarketCap: 1369.24 Millions | |
| Recent Price: 32.23 Smart Investing & Trading Score: 93 | |
| Day Percent Change: 0.34% Day Change: 0.11 | |
| Week Change: 1.35% Year-to-date Change: 0.3% | |
| LTC Links: Profile News Message Board | |
| Charts:- Daily , Weekly | |
| Add LTC to Watchlist: View: Get Complete LTC Trend Analysis ➞ | |
 | NPO EnPro Industries, Inc. |
| Sector: Industrials | |
| SubSector: Industrial Equipment & Components | |
| MarketCap: 734.309 Millions | |
| Recent Price: 151.03 Smart Investing & Trading Score: 58 | |
| Day Percent Change: -0.19% Day Change: -0.28 | |
| Week Change: 1.35% Year-to-date Change: -3.6% | |
| NPO Links: Profile News Message Board | |
| Charts:- Daily , Weekly | |
| Add NPO to Watchlist: View: Get Complete NPO Trend Analysis ➞ | |
 | LEGH Legacy Housing Corporation |
| Sector: Industrials | |
| SubSector: Residential Construction | |
| MarketCap: 298.006 Millions | |
| Recent Price: 20.21 Smart Investing & Trading Score: 28 | |
| Day Percent Change: 0.80% Day Change: 0.16 | |
| Week Change: 1.35% Year-to-date Change: -19.9% | |
| LEGH Links: Profile News Message Board | |
| Charts:- Daily , Weekly | |
| Add LEGH to Watchlist: View: Get Complete LEGH Trend Analysis ➞ | |
 | SCS Steelcase Inc. |
| Sector: Consumer Staples | |
| SubSector: Business Equipment | |
| MarketCap: 1310.77 Millions | |
| Recent Price: 12.10 Smart Investing & Trading Score: 42 | |
| Day Percent Change: -2.58% Day Change: -0.32 | |
| Week Change: 1.34% Year-to-date Change: -10.5% | |
| SCS Links: Profile News Message Board | |
| Charts:- Daily , Weekly | |
| Add SCS to Watchlist: View: Get Complete SCS Trend Analysis ➞ | |
 | PX P10, Inc. |
| Sector: Financials | |
| SubSector: Asset Management | |
| MarketCap: 1300 Millions | |
| Recent Price: 7.59 Smart Investing & Trading Score: 53 | |
| Day Percent Change: 0.00% Day Change: 0.00 | |
| Week Change: 1.34% Year-to-date Change: -25.7% | |
| PX Links: Profile News Message Board | |
| Charts:- Daily , Weekly | |
| Add PX to Watchlist: View: Get Complete PX Trend Analysis ➞ | |
 | ESNT Essent Group Ltd. |
| Sector: Financials | |
| SubSector: Mortgage Investment | |
| MarketCap: 2806.19 Millions | |
| Recent Price: 54.17 Smart Investing & Trading Score: 39 | |
| Day Percent Change: 0.04% Day Change: 0.02 | |
| Week Change: 1.33% Year-to-date Change: 2.7% | |
| ESNT Links: Profile News Message Board | |
| Charts:- Daily , Weekly | |
| Add ESNT to Watchlist: View: Get Complete ESNT Trend Analysis ➞ | |
| Too many stocks? View smallcap stocks filtered by marketcap & sector |
| Marketcap: All SmallCap Stocks (default-no microcap), Large, Mid-Range, Small & MicroCap |
| Sector: Tech, Finance, Energy, Staples, Retail, Industrial, Materials, Utilities & Medical |
|
Best Stocks Today 12Stocks.com |
© 2024 12Stocks.com Terms & Conditions Privacy Contact Us
All Information Provided Only For Education And Not To Be Used For Investing or Trading. See Terms & Conditions


One More Thing ... Get Best Stocks Delivered Daily!
Never Ever Miss A Move With Our Top Ten Stocks Lists
Find Best Stocks In Any Market - Bull or Bear Market
Take A Peek At Our Top Ten Stocks Lists: Daily, Weekly, Year-to-Date & Top Trends
Find Best Stocks In Any Market - Bull or Bear Market
Take A Peek At Our Top Ten Stocks Lists: Daily, Weekly, Year-to-Date & Top Trends
Smallcap Stocks With Best Up Trends [0-bearish to 100-bullish]: B. Riley[100], Ribbon [100], Group 1[100], Trustmark [100], MBIA [100], Integer [100], EchoStar [100], Comstock Resources[100], Vishay Inter[100], First Ban[100], Jamf Holding[100]
Best Smallcap Stocks Year-to-Date:
CareMax [574.23%], Janux [352.07%], Viking [249.65%], Alpine Immune[239.13%], Longboard [223.4%], Avidity Biosciences[177.71%], Arcutis Bio[170.9%], Super Micro[165.5%], Vera [149.61%], Hippo [130.79%], Y-mAbs [124.19%] Best Smallcap Stocks This Week:
Matterport [166.09%], B. Riley[48.82%], Seres [30.29%], Riot Blockchain[30.12%], CareMax [27.24%], Ribbon [25.97%], ProKidney [23.28%], SoundHound AI[22.54%], Cipher Mining[22.14%], Hibbett Sports[21.61%], Cullinan Oncology[20.69%] Best Smallcap Stocks Daily:
B. Riley[36.97%], Ribbon [26.46%], Babcock & Wilcox Enterprises[15.57%], Cullinan Oncology[13.55%], Amneal [12.04%], Comtech Tele[10.76%], Innodata [10.28%], Gritstone Oncology[10.06%], Navitas Semiconductor[8.83%], Eyenovia [8.68%], K12 [8.64%]