
 Login Sign Up


| |||||
 |  | ||||

| 12Stocks.com Market Intelligence |
Best SmallCap Stocks
|
| In a hurry? Small Cap Stock Lists: Performance Trends Table, Stock Charts
Sort Small Cap stocks: Daily, Weekly, Year-to-Date, Market Cap & Trends. Filter Small Cap stocks list by sector: Show all, Tech, Finance, Energy, Staples, Retail, Industrial, Materials, Utilities and HealthCare Filter Small Cap stocks list by size: All Large Medium Small and MicroCap |
| 12Stocks.com Small Cap Stocks Performances & Trends Daily | |||||||||
|
|  The overall Smart Investing & Trading Score is 23 (0-bearish to 100-bullish) which puts Small Cap index in short term bearish to neutral trend. The Smart Investing & Trading Score from previous trading session is 13 and hence an improvement of trend.
| ||||||||
Here are the Smart Investing & Trading Scores of the most requested small cap stocks at 12Stocks.com (click stock name for detailed review):
|


| 12Stocks.com: Investing in Smallcap Index with Stocks | |
|
The following table helps investors and traders sort through current performance and trends (as measured by Smart Investing & Trading Score) of various
stocks in the Smallcap Index. Quick View: Move mouse or cursor over stock symbol (ticker) to view short-term technical chart and over stock name to view long term chart. Click on  to add stock symbol to your watchlist and to add stock symbol to your watchlist and  to view watchlist. Click on any ticker or stock name for detailed market intelligence report for that stock. to view watchlist. Click on any ticker or stock name for detailed market intelligence report for that stock. |
12Stocks.com Performance of Stocks in Smallcap Index
| Ticker | Stock Name | Watchlist | Category | Recent Price | Smart Investing & Trading Score | Change % | Weekly Change% |
| AEL | American Equity |   | Financials | 55.14 | 31 | -0.20% | 0.07% |
| SANM | Sanmina | | Technology | 58.22 | 18 | -0.22% | 0.07% |
| HRT | HireRight | | Industrials | 14.25 | 68 | 0.07% | 0.07% |
| NWE | NorthWestern | | Utilities | 48.93 | 68 | 0.85% | 0.06% |
| EVBG | Everbridge | | Technology | 34.88 | 75 | 0.00% | 0.06% |
| MMS | MAXIMUS | | Services & Goods | 80.04 | 18 | 0.33% | 0.05% |
| PDCO | Patterson | | Services & Goods | 25.47 | 18 | -1.01% | 0.04% |
| GTY | Getty Realty | | Financials | 26.50 | 40 | 1.42% | 0.04% |
| ATNI | ATN | | Technology | 27.34 | 27 | 0.63% | 0.04% |
| PRK | Park National | | Financials | 125.27 | 28 | 0.42% | 0.03% |
| DIN | Dine Brands | | Services & Goods | 42.83 | 20 | 0.94% | 0.02% |
| UBSI | United Bankshares | | Financials | 33.12 | 35 | 1.69% | 0.00% |
| BRKL | Brookline Bancorp | | Financials | 9.06 | 17 | 1.00% | 0.00% |
| GSBC | Great Southern | | Financials | 50.91 | 35 | 1.64% | 0.00% |
| CRAI | CRA | | Services & Goods | 143.44 | 53 | 1.44% | 0.00% |
| RRGB | Red Robin | | Services & Goods | 6.00 | 42 | 0.84% | 0.00% |
| OPK | OPKO Health | | Health Care | 1.23 | 63 | -1.60% | 0.00% |
| DAN | Dana | | Consumer Staples | 12.01 | 45 | 1.09% | 0.00% |
| HQY | HealthEquity | | Technology | 79.85 | 49 | -0.03% | 0.00% |
| ZVIA | Zevia PBC | | Consumer Staples | 1.03 | 45 | 1.98% | 0.00% |
| METCB | Ramaco Resources | | Materials | 11.41 | 32 | 0.04% | 0.00% |
| BLKB | Blackbaud | | Technology | 76.71 | 42 | -1.04% | -0.01% |
| CXM | Sprinklr | | Technology | 11.55 | 32 | 1.63% | -0.04% |
| JJSF | J & J Snack Foods | | Consumer Staples | 134.50 | 35 | 0.21% | -0.06% |
| SMP | Standard Motor | | Consumer Staples | 32.10 | 28 | 0.60% | -0.06% |


| Too many stocks? View smallcap stocks filtered by marketcap & sector |
| Marketcap: All SmallCap Stocks (default-no microcap), Large, Mid-Range, Small |
| Smallcap Sector: Tech, Finance, Energy, Staples, Retail, Industrial, Materials, & Medical |
|
Get the most comprehensive stock market coverage daily at 12Stocks.com ➞ Best Stocks Today ➞ Best Stocks Weekly ➞ Best Stocks Year-to-Date ➞ Best Stocks Trends ➞  Best Stocks Today 12Stocks.com Best Nasdaq Stocks ➞ Best S&P 500 Stocks ➞ Best Tech Stocks ➞ Best Biotech Stocks ➞ |
| Detailed Overview of SmallCap Stocks |
| SmallCap Technical Overview, Leaders & Laggards, Top SmallCap ETF Funds & Detailed SmallCap Stocks List, Charts, Trends & More |
| Smallcap: Technical Analysis, Trends & YTD Performance | |
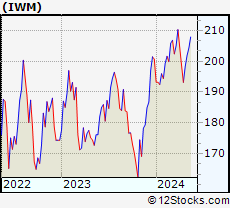
| SmallCap segment as represented by
IWM, an exchange-traded fund [ETF], holds basket of thousands of smallcap stocks from across all major sectors of the US stock market. The smallcap index (contains stocks like Riverbed & Sotheby's) is down by -3.92% and is currently underperforming the overall market by -8.11% year-to-date. Below is a quick view of technical charts and trends: | |
 IWM Weekly Chart |
|
| Long Term Trend: Not Good | |
| Medium Term Trend: Not Good | |
 IWM Daily Chart |
|
| Short Term Trend: Not Good | |
| Overall Trend Score: 23 | |
| YTD Performance: -3.92% | |
| **Trend Scores & Views Are Only For Educational Purposes And Not For Investing | |
| 12Stocks.com: Top Performing Small Cap Index Stocks | ||||||||||||||||||||||||||||||||||||||||||||||||
 The top performing Small Cap Index stocks year to date are
Now, more recently, over last week, the top performing Small Cap Index stocks on the move are


|
||||||||||||||||||||||||||||||||||||||||||||||||
| 12Stocks.com: Investing in Smallcap Index using Exchange Traded Funds | |
|
The following table shows list of key exchange traded funds (ETF) that
help investors track Smallcap index. The following list also includes leveraged ETF funds that track twice or thrice the daily returns of Smallcap indices. Short or inverse ETF funds move in the opposite direction to the index they track and are useful during market pullbacks or during bear markets. Quick View: Move mouse or cursor over ETF symbol (ticker) to view short-term technical chart and over ETF name to view long term chart. Click on ticker or stock name for detailed view. Click on to add stock symbol to your watchlist and to view watchlist. |
12Stocks.com List of ETFs that track Smallcap Index
| Ticker | ETF Name | Watchlist | Recent Price | Smart Investing & Trading Score | Change % | Week % | Year-to-date % |
| IWM | iShares Russell 2000 | | 192.84 | 23 | -0.08 | -2.94 | -3.92% |
| IJR | iShares Core S&P Small-Cap | | 102.34 | 10 | 0.21 | -2.08 | -5.46% |
| VTWO | Vanguard Russell 2000 ETF | | 77.95 | 23 | -0.13 | -2.95 | -3.88% |
| IWN | iShares Russell 2000 Value | | 146.33 | 10 | 0.21 | -2.69 | -5.79% |
| IJS | iShares S&P Small-Cap 600 Value | | 94.51 | 18 | 0.41 | -1.73 | -8.31% |
| IWO | iShares Russell 2000 Growth | | 246.94 | 36 | -0.44 | -3.3 | -2.09% |
| IJT | iShares S&P Small-Cap 600 Growth | | 121.57 | 13 | -0.22 | -2.57 | -2.85% |
| XSLV | PowerShares S&P SmallCap Low Volatil ETF | | 41.65 | 25 | 0.56 | -1.05 | -5.66% |
| SAA | ProShares Ultra SmallCap600 | | 21.62 | 10 | -0.18 | -4.17 | -13.35% |
| SMLV | SPDR SSGA US Small Cap Low Volatil ETF | | 103.83 | 10 | 0.16 | -1.13 | -7.72% |
| SBB | ProShares Short SmallCap600 | | 16.98 | 100 | 0.77 | 2.62 | 6.59% |
| SDD | ProShares UltraShort SmallCap600 | | 20.69 | 95 | 0.44 | 4.33 | 12.28% |
| 12Stocks.com: Charts, Trends, Fundamental Data and Performances of SmallCap Stocks | |
|
We now take in-depth look at all SmallCap stocks including charts, multi-period performances and overall trends (as measured by Smart Investing & Trading Score). One can sort SmallCap stocks (click link to choose) by Daily, Weekly and by Year-to-Date performances. Also, one can sort by size of the company or by market capitalization. |
| Select Your Default Chart Type: | |||||
| |||||
| Click on stock symbol or name for detailed view. Click on to add stock symbol to your watchlist and to view watchlist. Quick View: Move mouse or cursor over "Daily" to quickly view daily technical stock chart and over "Weekly" to view weekly technical stock chart. | |||||

 | AEL American Equity Investment Life Holding Company |
| Sector: Financials | |
| SubSector: Life Insurance | |
| MarketCap: 1304.46 Millions | |
| Recent Price: 55.14 Smart Investing & Trading Score: 31 | |
| Day Percent Change: -0.20% Day Change: -0.11 | |
| Week Change: 0.07% Year-to-date Change: -1.2% | |
| AEL Links: Profile News Message Board | |
| Charts:- Daily , Weekly | |
| Add AEL to Watchlist: View: Get Complete AEL Trend Analysis ➞ | |
 | SANM Sanmina Corporation |
| Sector: Technology | |
| SubSector: Diversified Electronics | |
| MarketCap: 1790.36 Millions | |
| Recent Price: 58.22 Smart Investing & Trading Score: 18 | |
| Day Percent Change: -0.22% Day Change: -0.13 | |
| Week Change: 0.07% Year-to-date Change: 13.3% | |
| SANM Links: Profile News Message Board | |
| Charts:- Daily , Weekly | |
| Add SANM to Watchlist: View: Get Complete SANM Trend Analysis ➞ | |
 | HRT HireRight Holdings Corporation |
| Sector: Industrials | |
| SubSector: Staffing & Employment Services | |
| MarketCap: 823 Millions | |
| Recent Price: 14.25 Smart Investing & Trading Score: 68 | |
| Day Percent Change: 0.07% Day Change: 0.01 | |
| Week Change: 0.07% Year-to-date Change: 6.0% | |
| HRT Links: Profile News Message Board | |
| Charts:- Daily , Weekly | |
| Add HRT to Watchlist: View: Get Complete HRT Trend Analysis ➞ | |
 | NWE NorthWestern Corporation |
| Sector: Utilities | |
| SubSector: Diversified Utilities | |
| MarketCap: 2801.8 Millions | |
| Recent Price: 48.93 Smart Investing & Trading Score: 68 | |
| Day Percent Change: 0.85% Day Change: 0.41 | |
| Week Change: 0.06% Year-to-date Change: -3.9% | |
| NWE Links: Profile News Message Board | |
| Charts:- Daily , Weekly | |
| Add NWE to Watchlist: View: Get Complete NWE Trend Analysis ➞ | |
 | EVBG Everbridge, Inc. |
| Sector: Technology | |
| SubSector: Application Software | |
| MarketCap: 3697.92 Millions | |
| Recent Price: 34.88 Smart Investing & Trading Score: 75 | |
| Day Percent Change: 0.00% Day Change: 0.00 | |
| Week Change: 0.06% Year-to-date Change: 43.5% | |
| EVBG Links: Profile News Message Board | |
| Charts:- Daily , Weekly | |
| Add EVBG to Watchlist: View: Get Complete EVBG Trend Analysis ➞ | |
 | MMS MAXIMUS, Inc. |
| Sector: Services & Goods | |
| SubSector: Business Services | |
| MarketCap: 3833.02 Millions | |
| Recent Price: 80.04 Smart Investing & Trading Score: 18 | |
| Day Percent Change: 0.33% Day Change: 0.26 | |
| Week Change: 0.05% Year-to-date Change: -4.6% | |
| MMS Links: Profile News Message Board | |
| Charts:- Daily , Weekly | |
| Add MMS to Watchlist: View: Get Complete MMS Trend Analysis ➞ | |
 | PDCO Patterson Companies, Inc. |
| Sector: Services & Goods | |
| SubSector: Medical Equipment Wholesale | |
| MarketCap: 1672.2 Millions | |
| Recent Price: 25.47 Smart Investing & Trading Score: 18 | |
| Day Percent Change: -1.01% Day Change: -0.26 | |
| Week Change: 0.04% Year-to-date Change: -10.5% | |
| PDCO Links: Profile News Message Board | |
| Charts:- Daily , Weekly | |
| Add PDCO to Watchlist: View: Get Complete PDCO Trend Analysis ➞ | |
 | GTY Getty Realty Corp. |
| Sector: Financials | |
| SubSector: REIT - Retail | |
| MarketCap: 926.114 Millions | |
| Recent Price: 26.50 Smart Investing & Trading Score: 40 | |
| Day Percent Change: 1.42% Day Change: 0.37 | |
| Week Change: 0.04% Year-to-date Change: -9.3% | |
| GTY Links: Profile News Message Board | |
| Charts:- Daily , Weekly | |
| Add GTY to Watchlist: View: Get Complete GTY Trend Analysis ➞ | |
 | ATNI ATN International, Inc. |
| Sector: Technology | |
| SubSector: Telecom Services - Domestic | |
| MarketCap: 1014.77 Millions | |
| Recent Price: 27.34 Smart Investing & Trading Score: 27 | |
| Day Percent Change: 0.63% Day Change: 0.17 | |
| Week Change: 0.04% Year-to-date Change: -29.8% | |
| ATNI Links: Profile News Message Board | |
| Charts:- Daily , Weekly | |
| Add ATNI to Watchlist: View: Get Complete ATNI Trend Analysis ➞ | |
 | PRK Park National Corporation |
| Sector: Financials | |
| SubSector: Regional - Midwest Banks | |
| MarketCap: 1416.6 Millions | |
| Recent Price: 125.27 Smart Investing & Trading Score: 28 | |
| Day Percent Change: 0.42% Day Change: 0.52 | |
| Week Change: 0.03% Year-to-date Change: -5.7% | |
| PRK Links: Profile News Message Board | |
| Charts:- Daily , Weekly | |
| Add PRK to Watchlist: View: Get Complete PRK Trend Analysis ➞ | |
 | DIN Dine Brands Global, Inc. |
| Sector: Services & Goods | |
| SubSector: Restaurants | |
| MarketCap: 421.17 Millions | |
| Recent Price: 42.83 Smart Investing & Trading Score: 20 | |
| Day Percent Change: 0.94% Day Change: 0.40 | |
| Week Change: 0.02% Year-to-date Change: -13.7% | |
| DIN Links: Profile News Message Board | |
| Charts:- Daily , Weekly | |
| Add DIN to Watchlist: View: Get Complete DIN Trend Analysis ➞ | |
 | UBSI United Bankshares, Inc. |
| Sector: Financials | |
| SubSector: Regional - Mid-Atlantic Banks | |
| MarketCap: 2286.79 Millions | |
| Recent Price: 33.12 Smart Investing & Trading Score: 35 | |
| Day Percent Change: 1.69% Day Change: 0.55 | |
| Week Change: 0% Year-to-date Change: -11.8% | |
| UBSI Links: Profile News Message Board | |
| Charts:- Daily , Weekly | |
| Add UBSI to Watchlist: View: Get Complete UBSI Trend Analysis ➞ | |
 | BRKL Brookline Bancorp, Inc. |
| Sector: Financials | |
| SubSector: Savings & Loans | |
| MarketCap: 894.43 Millions | |
| Recent Price: 9.06 Smart Investing & Trading Score: 17 | |
| Day Percent Change: 1.00% Day Change: 0.09 | |
| Week Change: 0% Year-to-date Change: -17.0% | |
| BRKL Links: Profile News Message Board | |
| Charts:- Daily , Weekly | |
| Add BRKL to Watchlist: View: Get Complete BRKL Trend Analysis ➞ | |
 | GSBC Great Southern Bancorp, Inc. |
| Sector: Financials | |
| SubSector: Regional - Southwest Banks | |
| MarketCap: 524.765 Millions | |
| Recent Price: 50.91 Smart Investing & Trading Score: 35 | |
| Day Percent Change: 1.64% Day Change: 0.82 | |
| Week Change: 0% Year-to-date Change: -14.2% | |
| GSBC Links: Profile News Message Board | |
| Charts:- Daily , Weekly | |
| Add GSBC to Watchlist: View: Get Complete GSBC Trend Analysis ➞ | |
 | CRAI CRA International, Inc. |
| Sector: Services & Goods | |
| SubSector: Management Services | |
| MarketCap: 209.645 Millions | |
| Recent Price: 143.44 Smart Investing & Trading Score: 53 | |
| Day Percent Change: 1.44% Day Change: 2.04 | |
| Week Change: 0% Year-to-date Change: 45.1% | |
| CRAI Links: Profile News Message Board | |
| Charts:- Daily , Weekly | |
| Add CRAI to Watchlist: View: Get Complete CRAI Trend Analysis ➞ | |
 | RRGB Red Robin Gourmet Burgers, Inc. |
| Sector: Services & Goods | |
| SubSector: Restaurants | |
| MarketCap: 121.57 Millions | |
| Recent Price: 6.00 Smart Investing & Trading Score: 42 | |
| Day Percent Change: 0.84% Day Change: 0.05 | |
| Week Change: 0% Year-to-date Change: -51.9% | |
| RRGB Links: Profile News Message Board | |
| Charts:- Daily , Weekly | |
| Add RRGB to Watchlist: View: Get Complete RRGB Trend Analysis ➞ | |
 | OPK OPKO Health, Inc. |
| Sector: Health Care | |
| SubSector: Biotechnology | |
| MarketCap: 1116.05 Millions | |
| Recent Price: 1.23 Smart Investing & Trading Score: 63 | |
| Day Percent Change: -1.60% Day Change: -0.02 | |
| Week Change: 0% Year-to-date Change: -18.5% | |
| OPK Links: Profile News Message Board | |
| Charts:- Daily , Weekly | |
| Add OPK to Watchlist: View: Get Complete OPK Trend Analysis ➞ | |
 | DAN Dana Incorporated |
| Sector: Consumer Staples | |
| SubSector: Auto Parts | |
| MarketCap: 1052.59 Millions | |
| Recent Price: 12.01 Smart Investing & Trading Score: 45 | |
| Day Percent Change: 1.09% Day Change: 0.13 | |
| Week Change: 0% Year-to-date Change: -17.8% | |
| DAN Links: Profile News Message Board | |
| Charts:- Daily , Weekly | |
| Add DAN to Watchlist: View: Get Complete DAN Trend Analysis ➞ | |
 | HQY HealthEquity, Inc. |
| Sector: Technology | |
| SubSector: Healthcare Information Services | |
| MarketCap: 3369.75 Millions | |
| Recent Price: 79.85 Smart Investing & Trading Score: 49 | |
| Day Percent Change: -0.03% Day Change: -0.02 | |
| Week Change: 0% Year-to-date Change: 20.4% | |
| HQY Links: Profile News Message Board | |
| Charts:- Daily , Weekly | |
| Add HQY to Watchlist: View: Get Complete HQY Trend Analysis ➞ | |
 | ZVIA Zevia PBC |
| Sector: Consumer Staples | |
| SubSector: Beverages - Non-Alcoholic | |
| MarketCap: 303 Millions | |
| Recent Price: 1.03 Smart Investing & Trading Score: 45 | |
| Day Percent Change: 1.98% Day Change: 0.02 | |
| Week Change: 0% Year-to-date Change: -49.0% | |
| ZVIA Links: Profile News Message Board | |
| Charts:- Daily , Weekly | |
| Add ZVIA to Watchlist: View: Get Complete ZVIA Trend Analysis ➞ | |
 | METCB Ramaco Resources, Inc. |
| Sector: Materials | |
| SubSector: Coking Coal | |
| MarketCap: 469 Millions | |
| Recent Price: 11.41 Smart Investing & Trading Score: 32 | |
| Day Percent Change: 0.04% Day Change: 0.01 | |
| Week Change: 0% Year-to-date Change: -13.9% | |
| METCB Links: Profile News Message Board | |
| Charts:- Daily , Weekly | |
| Add METCB to Watchlist: View: Get Complete METCB Trend Analysis ➞ | |
 | BLKB Blackbaud, Inc. |
| Sector: Technology | |
| SubSector: Business Software & Services | |
| MarketCap: 2838.48 Millions | |
| Recent Price: 76.71 Smart Investing & Trading Score: 42 | |
| Day Percent Change: -1.04% Day Change: -0.81 | |
| Week Change: -0.01% Year-to-date Change: -11.5% | |
| BLKB Links: Profile News Message Board | |
| Charts:- Daily , Weekly | |
| Add BLKB to Watchlist: View: Get Complete BLKB Trend Analysis ➞ | |
 | CXM Sprinklr, Inc. |
| Sector: Technology | |
| SubSector: Software - Application | |
| MarketCap: 3700 Millions | |
| Recent Price: 11.55 Smart Investing & Trading Score: 32 | |
| Day Percent Change: 1.63% Day Change: 0.19 | |
| Week Change: -0.04% Year-to-date Change: -4.5% | |
| CXM Links: Profile News Message Board | |
| Charts:- Daily , Weekly | |
| Add CXM to Watchlist: View: Get Complete CXM Trend Analysis ➞ | |
 | JJSF J & J Snack Foods Corp. |
| Sector: Consumer Staples | |
| SubSector: Processed & Packaged Goods | |
| MarketCap: 2706.28 Millions | |
| Recent Price: 134.50 Smart Investing & Trading Score: 35 | |
| Day Percent Change: 0.21% Day Change: 0.28 | |
| Week Change: -0.06% Year-to-date Change: -19.5% | |
| JJSF Links: Profile News Message Board | |
| Charts:- Daily , Weekly | |
| Add JJSF to Watchlist: View: Get Complete JJSF Trend Analysis ➞ | |
 | SMP Standard Motor Products, Inc. |
| Sector: Consumer Staples | |
| SubSector: Auto Parts | |
| MarketCap: 909.939 Millions | |
| Recent Price: 32.10 Smart Investing & Trading Score: 28 | |
| Day Percent Change: 0.60% Day Change: 0.19 | |
| Week Change: -0.06% Year-to-date Change: -19.4% | |
| SMP Links: Profile News Message Board | |
| Charts:- Daily , Weekly | |
| Add SMP to Watchlist: View: Get Complete SMP Trend Analysis ➞ | |
| Too many stocks? View smallcap stocks filtered by marketcap & sector |
| Marketcap: All SmallCap Stocks (default-no microcap), Large, Mid-Range, Small & MicroCap |
| Sector: Tech, Finance, Energy, Staples, Retail, Industrial, Materials, Utilities & Medical |
|
Best Stocks Today 12Stocks.com |
© 2024 12Stocks.com Terms & Conditions Privacy Contact Us
All Information Provided Only For Education And Not To Be Used For Investing or Trading. See Terms & Conditions


One More Thing ... Get Best Stocks Delivered Daily!
Never Ever Miss A Move With Our Top Ten Stocks Lists
Find Best Stocks In Any Market - Bull or Bear Market
Take A Peek At Our Top Ten Stocks Lists: Daily, Weekly, Year-to-Date & Top Trends
Find Best Stocks In Any Market - Bull or Bear Market
Take A Peek At Our Top Ten Stocks Lists: Daily, Weekly, Year-to-Date & Top Trends
Smallcap Stocks With Best Up Trends [0-bearish to 100-bullish]: Badger Meter[100], Cullinan Oncology[100], Oscar Health[100], NextNav [100], EchoStar [100], Victory Capital[100], Macatawa Bank[100], IMAX [100], Envestnet [100], ALX Oncology[100], Argan [95]
Best Smallcap Stocks Year-to-Date:
Agenus [500.31%], CareMax [417.53%], Janux [348.12%], Viking [247.5%], Alpine Immune[238.5%], Super Micro[226.63%], Longboard [194.76%], Arcutis Bio[192.57%], Vera [161.3%], Avidity Biosciences[154.87%], Hippo [128.32%] Best Smallcap Stocks This Week:
Macatawa Bank[44.42%], 23andMe Holding[33.3%], ProKidney [32%], Snap One[29.73%], Vertex Energy[25.96%], ALX Oncology[20.64%], Vanda [20.63%], Expensify [18.37%], Badger Meter[16.72%], ContextLogic [15%], Cullinan Oncology[13.89%] Best Smallcap Stocks Daily:
23andMe Holding[65.91%], Vertex Energy[33.78%], Zura Bio[17.20%], Badger Meter[16.65%], ContextLogic [15.81%], Expensify [15.23%], Montrose Environmental[12.84%], Vaxxinity [10.05%], Cipher Mining[8.65%], FiscalNote [8.61%], Vuzix [8.15%]