
 Login Sign Up


| |||||
 |  | ||||

| 12Stocks.com Market Intelligence |
Best SmallCap Stocks
|
| In a hurry? Small Cap Stock Lists: Performance Trends Table, Stock Charts
Sort Small Cap stocks: Daily, Weekly, Year-to-Date, Market Cap & Trends. Filter Small Cap stocks list by sector: Show all, Tech, Finance, Energy, Staples, Retail, Industrial, Materials, Utilities and HealthCare Filter Small Cap stocks list by size: All Large Medium Small and MicroCap |
| 12Stocks.com Small Cap Stocks Performances & Trends Daily | |||||||||
|
|  The overall Smart Investing & Trading Score is 23 (0-bearish to 100-bullish) which puts Small Cap index in short term bearish to neutral trend. The Smart Investing & Trading Score from previous trading session is 13 and an improvement of trend continues.
| ||||||||
Here are the Smart Investing & Trading Scores of the most requested small cap stocks at 12Stocks.com (click stock name for detailed review):
|


| 12Stocks.com: Investing in Smallcap Index with Stocks | |
|
The following table helps investors and traders sort through current performance and trends (as measured by Smart Investing & Trading Score) of various
stocks in the Smallcap Index. Quick View: Move mouse or cursor over stock symbol (ticker) to view short-term technical chart and over stock name to view long term chart. Click on  to add stock symbol to your watchlist and to add stock symbol to your watchlist and  to view watchlist. Click on any ticker or stock name for detailed market intelligence report for that stock. to view watchlist. Click on any ticker or stock name for detailed market intelligence report for that stock. |
12Stocks.com Performance of Stocks in Smallcap Index
| Ticker | Stock Name | Watchlist | Category | Recent Price | Smart Investing & Trading Score | Change % | Weekly Change% |
| DH | Definitive Healthcare |   | Health Care | 7.02 | 5 | -3.44% | -4.49% |
| STNE | StoneCo | | Technology | 15.40 | 18 | 0.88% | -4.50% |
| GSAT | Globalstar | | Technology | 1.27 | 10 | 1.60% | -4.51% |
| ZYME | Zymeworks | | Health Care | 8.83 | 17 | 1.85% | -4.54% |
| USPH | U.S. Physical | | Health Care | 98.03 | 43 | 0.55% | -4.55% |
| RLJ | RLJ Lodging | | Financials | 11.01 | 10 | 0.87% | -4.55% |
| EVER | EverQuote | | Financials | 18.48 | 36 | 1.99% | -4.55% |
| AMBC | Ambac Financial | | Financials | 14.27 | 25 | 1.86% | -4.55% |
| ENFN | Enfusion | | Technology | 9.13 | 36 | -1.30% | -4.55% |
| OSW | OneSpaWorld | | Services & Goods | 12.27 | 25 | -0.12% | -4.59% |
| HY | Hyster-Yale Materials | | Consumer Staples | 59.02 | 0 | 0.57% | -4.61% |
| CCS | Century Communities | | Industrials | 79.42 | 10 | 0.82% | -4.62% |
| THR | Thermon Group | | Industrials | 29.50 | 10 | -0.51% | -4.62% |
| RDVT | Red Violet | | Technology | 17.80 | 20 | 0.03% | -4.64% |
| VMD | Viemed Healthcare | | Health Care | 7.80 | 10 | 0.00% | -4.65% |
| LGIH | LGI Homes | | Financials | 93.77 | 10 | 0.36% | -4.66% |
| RAMP | LiveRamp | | Technology | 32.12 | 25 | -0.19% | -4.66% |
| URBN | Urban Outfitters | | Services & Goods | 36.96 | 17 | -0.16% | -4.67% |
| UUUU | Energy Fuels | | Materials | 5.91 | 35 | 1.03% | -4.68% |
| DRH | DiamondRock Hospitality | | Financials | 8.85 | 10 | 0.74% | -4.69% |
| LUNG | Pulmonx | | Health Care | 7.52 | 42 | 0.27% | -4.69% |
| MAC | Macerich | | Financials | 15.32 | 10 | 1.02% | -4.70% |
| OMI | Owens & Minor | | Services & Goods | 24.38 | 53 | 1.31% | -4.71% |
| UNIT | Uniti Group | | Financials | 5.34 | 56 | 0.66% | -4.72% |
| MDXG | MiMedx Group | | Health Care | 6.13 | 15 | -0.41% | -4.74% |
| For chart view version of above stock list: Chart View ➞ 0 - 25 , 25 - 50 , 50 - 75 , 75 - 100 , 100 - 125 , 125 - 150 , 150 - 175 , 175 - 200 , 200 - 225 , 225 - 250 , 250 - 275 , 275 - 300 , 300 - 325 , 325 - 350 , 350 - 375 , 375 - 400 , 400 - 425 , 425 - 450 , 450 - 475 , 475 - 500 , 500 - 525 , 525 - 550 , 550 - 575 , 575 - 600 , 600 - 625 , 625 - 650 , 650 - 675 , 675 - 700 , 700 - 725 , 725 - 750 , 750 - 775 , 775 - 800 , 800 - 825 , 825 - 850 , 850 - 875 , 875 - 900 , 900 - 925 , 925 - 950 , 950 - 975 , 975 - 1000 , 1000 - 1025 , 1025 - 1050 , 1050 - 1075 , 1075 - 1100 , 1100 - 1125 , 1125 - 1150 , 1150 - 1175 , 1175 - 1200 , 1200 - 1225 , 1225 - 1250 , 1250 - 1275 , 1275 - 1300 , 1300 - 1325 , 1325 - 1350 , 1350 - 1375 , 1375 - 1400 , 1400 - 1425 , 1425 - 1450 , 1450 - 1475 , 1475 - 1500 , 1500 - 1525 , 1525 - 1550 , 1550 - 1575 , 1575 - 1600 , 1600 - 1625 | ||
 | Click To Change The Sort Order: By Market Cap or Company Size Performance: Year-to-date, Week and Day |  |
| Too many stocks? View smallcap stocks filtered by marketcap & sector |
| Marketcap: All SmallCap Stocks (default-no microcap), Large, Mid-Range, Small |
| Smallcap Sector: Tech, Finance, Energy, Staples, Retail, Industrial, Materials, & Medical |
|
Get the most comprehensive stock market coverage daily at 12Stocks.com ➞ Best Stocks Today ➞ Best Stocks Weekly ➞ Best Stocks Year-to-Date ➞ Best Stocks Trends ➞  Best Stocks Today 12Stocks.com Best Nasdaq Stocks ➞ Best S&P 500 Stocks ➞ Best Tech Stocks ➞ Best Biotech Stocks ➞ |
| Detailed Overview of SmallCap Stocks |
| SmallCap Technical Overview, Leaders & Laggards, Top SmallCap ETF Funds & Detailed SmallCap Stocks List, Charts, Trends & More |
| Smallcap: Technical Analysis, Trends & YTD Performance | |
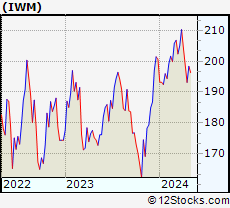
| SmallCap segment as represented by
IWM, an exchange-traded fund [ETF], holds basket of thousands of smallcap stocks from across all major sectors of the US stock market. The smallcap index (contains stocks like Riverbed & Sotheby's) is down by -3.67% and is currently underperforming the overall market by -7.75% year-to-date. Below is a quick view of technical charts and trends: | |
 IWM Weekly Chart |
|
| Long Term Trend: Good | |
| Medium Term Trend: Not Good | |
 IWM Daily Chart |
|
| Short Term Trend: Deteriorating | |
| Overall Trend Score: 23 | |
| YTD Performance: -3.67% | |
| **Trend Scores & Views Are Only For Educational Purposes And Not For Investing | |
| 12Stocks.com: Top Performing Small Cap Index Stocks | ||||||||||||||||||||||||||||||||||||||||||||||||
 The top performing Small Cap Index stocks year to date are
Now, more recently, over last week, the top performing Small Cap Index stocks on the move are


|
||||||||||||||||||||||||||||||||||||||||||||||||
| 12Stocks.com: Investing in Smallcap Index using Exchange Traded Funds | |
|
The following table shows list of key exchange traded funds (ETF) that
help investors track Smallcap index. The following list also includes leveraged ETF funds that track twice or thrice the daily returns of Smallcap indices. Short or inverse ETF funds move in the opposite direction to the index they track and are useful during market pullbacks or during bear markets. Quick View: Move mouse or cursor over ETF symbol (ticker) to view short-term technical chart and over ETF name to view long term chart. Click on ticker or stock name for detailed view. Click on to add stock symbol to your watchlist and to view watchlist. |
12Stocks.com List of ETFs that track Smallcap Index
| Ticker | ETF Name | Watchlist | Recent Price | Smart Investing & Trading Score | Change % | Week % | Year-to-date % |
| IWM | iShares Russell 2000 | | 193.34 | 23 | 0.26 | -2.69 | -3.67% |
| SAA | ProShares Ultra SmallCap600 | | 21.83 | 18 | 0.97 | -3.24 | -12.51% |
| SDD | ProShares UltraShort SmallCap600 | | 20.42 | 76 | -1.30 | 2.97 | 10.82% |
| SMLV | SPDR SSGA US Small Cap Low Volatil ETF | | 105.38 | 32 | 1.49 | 0.35 | -6.35% |
| SBB | ProShares Short SmallCap600 | | 16.80 | 76 | -1.08 | 1.51 | 5.44% |
| 12Stocks.com: Charts, Trends, Fundamental Data and Performances of SmallCap Stocks | |
|
We now take in-depth look at all SmallCap stocks including charts, multi-period performances and overall trends (as measured by Smart Investing & Trading Score). One can sort SmallCap stocks (click link to choose) by Daily, Weekly and by Year-to-Date performances. Also, one can sort by size of the company or by market capitalization. |
| Select Your Default Chart Type: | |||||
| |||||
| Click on stock symbol or name for detailed view. Click on to add stock symbol to your watchlist and to view watchlist. Quick View: Move mouse or cursor over "Daily" to quickly view daily technical stock chart and over "Weekly" to view weekly technical stock chart. | |||||

 | DH Definitive Healthcare Corp. |
| Sector: Health Care | |
| SubSector: Health Information Services | |
| MarketCap: 1690 Millions | |
| Recent Price: 7.02 Smart Investing & Trading Score: 5 | |
| Day Percent Change: -3.44% Day Change: -0.25 | |
| Week Change: -4.49% Year-to-date Change: -30.3% | |
| DH Links: Profile News Message Board | |
| Charts:- Daily , Weekly | |
| Add DH to Watchlist: View: Get Complete DH Trend Analysis ➞ | |
 | STNE StoneCo Ltd. |
| Sector: Technology | |
| SubSector: Application Software | |
| MarketCap: 7347.82 Millions | |
| Recent Price: 15.40 Smart Investing & Trading Score: 18 | |
| Day Percent Change: 0.88% Day Change: 0.13 | |
| Week Change: -4.5% Year-to-date Change: -14.6% | |
| STNE Links: Profile News Message Board | |
| Charts:- Daily , Weekly | |
| Add STNE to Watchlist: View: Get Complete STNE Trend Analysis ➞ | |
 | GSAT Globalstar, Inc. |
| Sector: Technology | |
| SubSector: Wireless Communications | |
| MarketCap: 485.127 Millions | |
| Recent Price: 1.27 Smart Investing & Trading Score: 10 | |
| Day Percent Change: 1.60% Day Change: 0.02 | |
| Week Change: -4.51% Year-to-date Change: -34.5% | |
| GSAT Links: Profile News Message Board | |
| Charts:- Daily , Weekly | |
| Add GSAT to Watchlist: View: Get Complete GSAT Trend Analysis ➞ | |
 | ZYME Zymeworks Inc. |
| Sector: Health Care | |
| SubSector: Biotechnology | |
| MarketCap: 1373.55 Millions | |
| Recent Price: 8.83 Smart Investing & Trading Score: 17 | |
| Day Percent Change: 1.85% Day Change: 0.16 | |
| Week Change: -4.54% Year-to-date Change: -15.0% | |
| ZYME Links: Profile News Message Board | |
| Charts:- Daily , Weekly | |
| Add ZYME to Watchlist: View: Get Complete ZYME Trend Analysis ➞ | |
 | USPH U.S. Physical Therapy, Inc. |
| Sector: Health Care | |
| SubSector: Specialized Health Services | |
| MarketCap: 793.556 Millions | |
| Recent Price: 98.03 Smart Investing & Trading Score: 43 | |
| Day Percent Change: 0.55% Day Change: 0.54 | |
| Week Change: -4.55% Year-to-date Change: 5.3% | |
| USPH Links: Profile News Message Board | |
| Charts:- Daily , Weekly | |
| Add USPH to Watchlist: View: Get Complete USPH Trend Analysis ➞ | |
 | RLJ RLJ Lodging Trust |
| Sector: Financials | |
| SubSector: REIT - Hotel/Motel | |
| MarketCap: 1019.34 Millions | |
| Recent Price: 11.01 Smart Investing & Trading Score: 10 | |
| Day Percent Change: 0.87% Day Change: 0.10 | |
| Week Change: -4.55% Year-to-date Change: -6.1% | |
| RLJ Links: Profile News Message Board | |
| Charts:- Daily , Weekly | |
| Add RLJ to Watchlist: View: Get Complete RLJ Trend Analysis ➞ | |
 | EVER EverQuote, Inc. |
| Sector: Financials | |
| SubSector: Regional - Southeast Banks | |
| MarketCap: 767.135 Millions | |
| Recent Price: 18.48 Smart Investing & Trading Score: 36 | |
| Day Percent Change: 1.99% Day Change: 0.36 | |
| Week Change: -4.55% Year-to-date Change: 51.0% | |
| EVER Links: Profile News Message Board | |
| Charts:- Daily , Weekly | |
| Add EVER to Watchlist: View: Get Complete EVER Trend Analysis ➞ | |
 | AMBC Ambac Financial Group, Inc. |
| Sector: Financials | |
| SubSector: Surety & Title Insurance | |
| MarketCap: 587.818 Millions | |
| Recent Price: 14.27 Smart Investing & Trading Score: 25 | |
| Day Percent Change: 1.86% Day Change: 0.26 | |
| Week Change: -4.55% Year-to-date Change: -13.4% | |
| AMBC Links: Profile News Message Board | |
| Charts:- Daily , Weekly | |
| Add AMBC to Watchlist: View: Get Complete AMBC Trend Analysis ➞ | |
 | ENFN Enfusion, Inc. |
| Sector: Technology | |
| SubSector: Software - Application | |
| MarketCap: 1290 Millions | |
| Recent Price: 9.13 Smart Investing & Trading Score: 36 | |
| Day Percent Change: -1.30% Day Change: -0.12 | |
| Week Change: -4.55% Year-to-date Change: -7.3% | |
| ENFN Links: Profile News Message Board | |
| Charts:- Daily , Weekly | |
| Add ENFN to Watchlist: View: Get Complete ENFN Trend Analysis ➞ | |
 | OSW OneSpaWorld Holdings Limited |
| Sector: Services & Goods | |
| SubSector: Resorts & Casinos | |
| MarketCap: 228.394 Millions | |
| Recent Price: 12.27 Smart Investing & Trading Score: 25 | |
| Day Percent Change: -0.12% Day Change: -0.02 | |
| Week Change: -4.59% Year-to-date Change: -13.0% | |
| OSW Links: Profile News Message Board | |
| Charts:- Daily , Weekly | |
| Add OSW to Watchlist: View: Get Complete OSW Trend Analysis ➞ | |
 | HY Hyster-Yale Materials Handling, Inc. |
| Sector: Consumer Staples | |
| SubSector: Trucks & Other Vehicles | |
| MarketCap: 660 Millions | |
| Recent Price: 59.02 Smart Investing & Trading Score: 0 | |
| Day Percent Change: 0.57% Day Change: 0.34 | |
| Week Change: -4.61% Year-to-date Change: -5.1% | |
| HY Links: Profile News Message Board | |
| Charts:- Daily , Weekly | |
| Add HY to Watchlist: View: Get Complete HY Trend Analysis ➞ | |
 | CCS Century Communities, Inc. |
| Sector: Industrials | |
| SubSector: Residential Construction | |
| MarketCap: 459.206 Millions | |
| Recent Price: 79.42 Smart Investing & Trading Score: 10 | |
| Day Percent Change: 0.82% Day Change: 0.64 | |
| Week Change: -4.62% Year-to-date Change: -12.9% | |
| CCS Links: Profile News Message Board | |
| Charts:- Daily , Weekly | |
| Add CCS to Watchlist: View: Get Complete CCS Trend Analysis ➞ | |
 | THR Thermon Group Holdings, Inc. |
| Sector: Industrials | |
| SubSector: Diversified Machinery | |
| MarketCap: 492.816 Millions | |
| Recent Price: 29.50 Smart Investing & Trading Score: 10 | |
| Day Percent Change: -0.51% Day Change: -0.15 | |
| Week Change: -4.62% Year-to-date Change: -9.4% | |
| THR Links: Profile News Message Board | |
| Charts:- Daily , Weekly | |
| Add THR to Watchlist: View: Get Complete THR Trend Analysis ➞ | |
 | RDVT Red Violet, Inc. |
| Sector: Technology | |
| SubSector: Application Software | |
| MarketCap: 215.162 Millions | |
| Recent Price: 17.80 Smart Investing & Trading Score: 20 | |
| Day Percent Change: 0.03% Day Change: 0.01 | |
| Week Change: -4.64% Year-to-date Change: -10.9% | |
| RDVT Links: Profile News Message Board | |
| Charts:- Daily , Weekly | |
| Add RDVT to Watchlist: View: Get Complete RDVT Trend Analysis ➞ | |
 | VMD Viemed Healthcare, Inc. |
| Sector: Health Care | |
| SubSector: Medical Appliances & Equipment | |
| MarketCap: 177.28 Millions | |
| Recent Price: 7.80 Smart Investing & Trading Score: 10 | |
| Day Percent Change: 0.00% Day Change: 0.00 | |
| Week Change: -4.65% Year-to-date Change: -0.6% | |
| VMD Links: Profile News Message Board | |
| Charts:- Daily , Weekly | |
| Add VMD to Watchlist: View: Get Complete VMD Trend Analysis ➞ | |
 | LGIH LGI Homes, Inc. |
| Sector: Financials | |
| SubSector: Real Estate Development | |
| MarketCap: 1316.49 Millions | |
| Recent Price: 93.77 Smart Investing & Trading Score: 10 | |
| Day Percent Change: 0.36% Day Change: 0.34 | |
| Week Change: -4.66% Year-to-date Change: -29.6% | |
| LGIH Links: Profile News Message Board | |
| Charts:- Daily , Weekly | |
| Add LGIH to Watchlist: View: Get Complete LGIH Trend Analysis ➞ | |
 | RAMP LiveRamp Holdings, Inc. |
| Sector: Technology | |
| SubSector: Information Technology Services | |
| MarketCap: 2124.38 Millions | |
| Recent Price: 32.12 Smart Investing & Trading Score: 25 | |
| Day Percent Change: -0.19% Day Change: -0.06 | |
| Week Change: -4.66% Year-to-date Change: -15.2% | |
| RAMP Links: Profile News Message Board | |
| Charts:- Daily , Weekly | |
| Add RAMP to Watchlist: View: Get Complete RAMP Trend Analysis ➞ | |
 | URBN Urban Outfitters, Inc. |
| Sector: Services & Goods | |
| SubSector: Apparel Stores | |
| MarketCap: 1638.08 Millions | |
| Recent Price: 36.96 Smart Investing & Trading Score: 17 | |
| Day Percent Change: -0.16% Day Change: -0.06 | |
| Week Change: -4.67% Year-to-date Change: 3.6% | |
| URBN Links: Profile News Message Board | |
| Charts:- Daily , Weekly | |
| Add URBN to Watchlist: View: Get Complete URBN Trend Analysis ➞ | |
 | UUUU Energy Fuels Inc. |
| Sector: Materials | |
| SubSector: Industrial Metals & Minerals | |
| MarketCap: 107.61 Millions | |
| Recent Price: 5.91 Smart Investing & Trading Score: 35 | |
| Day Percent Change: 1.03% Day Change: 0.06 | |
| Week Change: -4.68% Year-to-date Change: -17.8% | |
| UUUU Links: Profile News Message Board | |
| Charts:- Daily , Weekly | |
| Add UUUU to Watchlist: View: Get Complete UUUU Trend Analysis ➞ | |
 | DRH DiamondRock Hospitality Company |
| Sector: Financials | |
| SubSector: REIT - Hotel/Motel | |
| MarketCap: 964 Millions | |
| Recent Price: 8.85 Smart Investing & Trading Score: 10 | |
| Day Percent Change: 0.74% Day Change: 0.07 | |
| Week Change: -4.69% Year-to-date Change: -5.8% | |
| DRH Links: Profile News Message Board | |
| Charts:- Daily , Weekly | |
| Add DRH to Watchlist: View: Get Complete DRH Trend Analysis ➞ | |
 | LUNG Pulmonx Corporation |
| Sector: Health Care | |
| SubSector: Medical Devices | |
| MarketCap: 18187 Millions | |
| Recent Price: 7.52 Smart Investing & Trading Score: 42 | |
| Day Percent Change: 0.27% Day Change: 0.02 | |
| Week Change: -4.69% Year-to-date Change: -41.0% | |
| LUNG Links: Profile News Message Board | |
| Charts:- Daily , Weekly | |
| Add LUNG to Watchlist: View: Get Complete LUNG Trend Analysis ➞ | |
 | MAC The Macerich Company |
| Sector: Financials | |
| SubSector: REIT - Retail | |
| MarketCap: 1172.54 Millions | |
| Recent Price: 15.32 Smart Investing & Trading Score: 10 | |
| Day Percent Change: 1.02% Day Change: 0.15 | |
| Week Change: -4.7% Year-to-date Change: -0.7% | |
| MAC Links: Profile News Message Board | |
| Charts:- Daily , Weekly | |
| Add MAC to Watchlist: View: Get Complete MAC Trend Analysis ➞ | |
 | OMI Owens & Minor, Inc. |
| Sector: Services & Goods | |
| SubSector: Medical Equipment Wholesale | |
| MarketCap: 403.92 Millions | |
| Recent Price: 24.38 Smart Investing & Trading Score: 53 | |
| Day Percent Change: 1.31% Day Change: 0.32 | |
| Week Change: -4.71% Year-to-date Change: 26.5% | |
| OMI Links: Profile News Message Board | |
| Charts:- Daily , Weekly | |
| Add OMI to Watchlist: View: Get Complete OMI Trend Analysis ➞ | |
 | UNIT Uniti Group Inc. |
| Sector: Financials | |
| SubSector: REIT - Industrial | |
| MarketCap: 1363.09 Millions | |
| Recent Price: 5.34 Smart Investing & Trading Score: 56 | |
| Day Percent Change: 0.66% Day Change: 0.04 | |
| Week Change: -4.72% Year-to-date Change: -7.5% | |
| UNIT Links: Profile News Message Board | |
| Charts:- Daily , Weekly | |
| Add UNIT to Watchlist: View: Get Complete UNIT Trend Analysis ➞ | |
 | MDXG MiMedx Group, Inc. |
| Sector: Health Care | |
| SubSector: Medical Appliances & Equipment | |
| MarketCap: 371.08 Millions | |
| Recent Price: 6.13 Smart Investing & Trading Score: 15 | |
| Day Percent Change: -0.41% Day Change: -0.03 | |
| Week Change: -4.74% Year-to-date Change: -30.1% | |
| MDXG Links: Profile News Message Board | |
| Charts:- Daily , Weekly | |
| Add MDXG to Watchlist: View: Get Complete MDXG Trend Analysis ➞ | |
| Too many stocks? View smallcap stocks filtered by marketcap & sector |
| Marketcap: All SmallCap Stocks (default-no microcap), Large, Mid-Range, Small & MicroCap |
| Sector: Tech, Finance, Energy, Staples, Retail, Industrial, Materials, Utilities & Medical |
|
Best Stocks Today 12Stocks.com |
© 2024 12Stocks.com Terms & Conditions Privacy Contact Us
All Information Provided Only For Education And Not To Be Used For Investing or Trading. See Terms & Conditions


One More Thing ... Get Best Stocks Delivered Daily!
Never Ever Miss A Move With Our Top Ten Stocks Lists
Find Best Stocks In Any Market - Bull or Bear Market
Take A Peek At Our Top Ten Stocks Lists: Daily, Weekly, Year-to-Date & Top Trends
Find Best Stocks In Any Market - Bull or Bear Market
Take A Peek At Our Top Ten Stocks Lists: Daily, Weekly, Year-to-Date & Top Trends
Smallcap Stocks With Best Up Trends [0-bearish to 100-bullish]: Humacyte [100], Victory Capital[100], Century Aluminum[100], Oscar Health[100], Mercury General[100], United Fire[100], Gannett Co[100], Old Second[100], Portland General[100], Lantheus [100], Target Hospitality[100]
Best Smallcap Stocks Year-to-Date:
Agenus [581.24%], CareMax [456.7%], Janux [343.37%], Alpine Immune[238.42%], Longboard [194.11%], Arcutis Bio[184.06%], Super Micro[176.22%], Avidity Biosciences[153.65%], Vera [147.87%], Hippo [123.38%], Stoke [121.48%] Best Smallcap Stocks This Week:
Macatawa Bank[44.89%], Humacyte [39.24%], ProKidney [37.43%], Snap One[29.79%], ALX Oncology[22.49%], 23andMe Holding[22.09%], Vanda [21.12%], ContextLogic [20%], Badger Meter[17.13%], Oscar Health[15.4%], Accolade [13.45%] Best Smallcap Stocks Daily:
Humacyte [23.57%], Metropolitan Bank[17.73%], Agenus [13.48%], Origin Materials[11.12%], Chemung Financial[9.48%], Pacific Biosciences[8.56%], Cohen & Steers[8.35%], Urban One[8.21%], Riot Blockchain[7.84%], Bar Harbor[7.71%], CareMax [7.57%]