
 Login Sign Up


| |||||
 |  | ||||

| 12Stocks.com Market Intelligence |
Best SmallCap Stocks
|
| In a hurry? Small Cap Stock Lists: Performance Trends Table, Stock Charts
Sort Small Cap stocks: Daily, Weekly, Year-to-Date, Market Cap & Trends. Filter Small Cap stocks list by sector: Show all, Tech, Finance, Energy, Staples, Retail, Industrial, Materials, Utilities and HealthCare Filter Small Cap stocks list by size: All Large Medium Small and MicroCap |
| 12Stocks.com Small Cap Stocks Performances & Trends Daily | |||||||||
|
|  The overall Smart Investing & Trading Score is 58 (0-bearish to 100-bullish) which puts Small Cap index in short term neutral trend. The Smart Investing & Trading Score from previous trading session is 63 and hence a deterioration of trend.
| ||||||||
Here are the Smart Investing & Trading Scores of the most requested small cap stocks at 12Stocks.com (click stock name for detailed review):
|


| 12Stocks.com: Investing in Smallcap Index with Stocks | |
|
The following table helps investors and traders sort through current performance and trends (as measured by Smart Investing & Trading Score) of various
stocks in the Smallcap Index. Quick View: Move mouse or cursor over stock symbol (ticker) to view short-term technical chart and over stock name to view long term chart. Click on  to add stock symbol to your watchlist and to add stock symbol to your watchlist and  to view watchlist. Click on any ticker or stock name for detailed market intelligence report for that stock. to view watchlist. Click on any ticker or stock name for detailed market intelligence report for that stock. |
12Stocks.com Performance of Stocks in Smallcap Index
| Ticker | Stock Name | Watchlist | Category | Recent Price | Smart Investing & Trading Score | Change % | Weekly Change% |
| RYAM | Rayonier Advanced |   | Materials | 4.12 | 10 | 1.48% | -4.19% |
| RDVT | Red Violet | | Technology | 17.01 | 10 | 0.06% | -4.22% |
| ALLK | Allakos | | Health Care | 1.02 | 20 | -2.86% | -4.23% |
| EXFY | Expensify | | Technology | 1.57 | 17 | 1.95% | -4.27% |
| LCTX | Lineage Cell | | Health Care | 1.10 | 46 | -3.51% | -4.35% |
| MGTX | MeiraGTx | | Health Care | 4.86 | 10 | -1.42% | -4.52% |
| NKTX | Nkarta | | Health Care | 7.16 | 10 | -5.29% | -4.53% |
| STRO | Sutro Biopharma | | Health Care | 3.47 | 20 | -6.72% | -4.54% |
| PLSE | Pulse Biosciences | | Health Care | 6.86 | 0 | 0.00% | -4.59% |
| RUSHA | Rush Enterprises | | Services & Goods | 46.44 | 36 | -5.67% | -4.66% |
| DNUT | Krispy Kreme | | Consumer Staples | 13.01 | 0 | -1.40% | -4.66% |
| EGY | VAALCO Energy | | Energy | 6.45 | 36 | 0.31% | -4.73% |
| MYPS | PLAYSTUDIOS | | Services & Goods | 2.20 | 46 | -3.93% | -4.76% |
| UNFI | United Natural | | Consumer Staples | 8.82 | 20 | -0.90% | -4.85% |
| BEAM | Beam | | Health Care | 22.74 | 10 | -3.11% | -4.85% |
| TCI | Transcontinental Realty | | Financials | 30.29 | 10 | -3.50% | -4.93% |
| OOMA | Ooma | | Technology | 6.71 | 20 | -3.80% | -4.96% |
| TRVI | Trevi | | Health Care | 2.68 | 43 | -5.96% | -4.96% |
| BCRX | BioCryst | | Health Care | 4.21 | 10 | -3.88% | -4.97% |
| FOSL | Fossil Group | | Consumer Staples | 0.81 | 20 | -3.42% | -4.98% |
| CMP | Compass Minerals | | Materials | 12.78 | 10 | -3.26% | -5.05% |
| BCOV | Brightcove | | Technology | 1.65 | 10 | -1.79% | -5.17% |
| PGC | Peapack-Gladstone Financial | | Financials | 22.88 | 27 | -8.63% | -5.18% |
| ALGT | Allegiant Travel | | Transports | 59.07 | 0 | -4.15% | -5.20% |
| HSHP | Himalaya Shipping | | Industrials | 7.64 | 43 | 0.53% | -5.21% |


| Too many stocks? View smallcap stocks filtered by marketcap & sector |
| Marketcap: All SmallCap Stocks (default-no microcap), Large, Mid-Range, Small |
| Smallcap Sector: Tech, Finance, Energy, Staples, Retail, Industrial, Materials, & Medical |
|
Get the most comprehensive stock market coverage daily at 12Stocks.com ➞ Best Stocks Today ➞ Best Stocks Weekly ➞ Best Stocks Year-to-Date ➞ Best Stocks Trends ➞  Best Stocks Today 12Stocks.com Best Nasdaq Stocks ➞ Best S&P 500 Stocks ➞ Best Tech Stocks ➞ Best Biotech Stocks ➞ |
| Detailed Overview of SmallCap Stocks |
| SmallCap Technical Overview, Leaders & Laggards, Top SmallCap ETF Funds & Detailed SmallCap Stocks List, Charts, Trends & More |
| Smallcap: Technical Analysis, Trends & YTD Performance | |
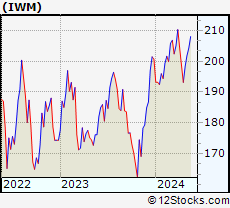
| SmallCap segment as represented by
IWM, an exchange-traded fund [ETF], holds basket of thousands of smallcap stocks from across all major sectors of the US stock market. The smallcap index (contains stocks like Riverbed & Sotheby's) is down by -1.51% and is currently underperforming the overall market by -7.17% year-to-date. Below is a quick view of technical charts and trends: | |
 IWM Weekly Chart |
|
| Long Term Trend: Good | |
| Medium Term Trend: Not Good | |
 IWM Daily Chart |
|
| Short Term Trend: Very Good | |
| Overall Trend Score: 58 | |
| YTD Performance: -1.51% | |
| **Trend Scores & Views Are Only For Educational Purposes And Not For Investing | |
| 12Stocks.com: Top Performing Small Cap Index Stocks | ||||||||||||||||||||||||||||||||||||||||||||||||
 The top performing Small Cap Index stocks year to date are
Now, more recently, over last week, the top performing Small Cap Index stocks on the move are


|
||||||||||||||||||||||||||||||||||||||||||||||||
| 12Stocks.com: Investing in Smallcap Index using Exchange Traded Funds | |
|
The following table shows list of key exchange traded funds (ETF) that
help investors track Smallcap index. The following list also includes leveraged ETF funds that track twice or thrice the daily returns of Smallcap indices. Short or inverse ETF funds move in the opposite direction to the index they track and are useful during market pullbacks or during bear markets. Quick View: Move mouse or cursor over ETF symbol (ticker) to view short-term technical chart and over ETF name to view long term chart. Click on ticker or stock name for detailed view. Click on to add stock symbol to your watchlist and to view watchlist. |
12Stocks.com List of ETFs that track Smallcap Index
| Ticker | ETF Name | Watchlist | Recent Price | Smart Investing & Trading Score | Change % | Week % | Year-to-date % |
| IWM | iShares Russell 2000 | | 197.68 | 58 | -0.45 | 2.35 | -1.51% |
| IJR | iShares Core S&P Small-Cap | | 105.71 | 85 | -0.24 | 2.41 | -2.35% |
| VTWO | Vanguard Russell 2000 ETF | | 79.93 | 63 | -0.45 | 2.37 | -1.44% |
| IWN | iShares Russell 2000 Value | | 151.28 | 75 | -0.30 | 2.37 | -2.61% |
| IWO | iShares Russell 2000 Growth | | 251.27 | 58 | -0.44 | 2.44 | -0.38% |
| IJS | iShares S&P Small-Cap 600 Value | | 97.71 | 60 | -0.43 | 2.2 | -5.2% |
| IJT | iShares S&P Small-Cap 600 Growth | | 125.37 | 70 | -0.28 | 2.59 | 0.18% |
| XSLV | PowerShares S&P SmallCap Low Volatil ETF | | 42.94 | 73 | -0.26 | 1.8 | -2.74% |
| SBB | ProShares Short SmallCap600 | | 16.37 | 33 | -0.02 | -2.79 | 2.76% |
| SMLV | SPDR SSGA US Small Cap Low Volatil ETF | | 108.43 | 73 | -0.31 | 2.21 | -3.63% |
| SAA | ProShares Ultra SmallCap600 | | 23.01 | 58 | -0.60 | 5.55 | -7.78% |
| SDD | ProShares UltraShort SmallCap600 | | 19.49 | 42 | 1.35 | -4.18 | 5.77% |
| 12Stocks.com: Charts, Trends, Fundamental Data and Performances of SmallCap Stocks | |
|
We now take in-depth look at all SmallCap stocks including charts, multi-period performances and overall trends (as measured by Smart Investing & Trading Score). One can sort SmallCap stocks (click link to choose) by Daily, Weekly and by Year-to-Date performances. Also, one can sort by size of the company or by market capitalization. |
| Select Your Default Chart Type: | |||||
| |||||
| Click on stock symbol or name for detailed view. Click on to add stock symbol to your watchlist and to view watchlist. Quick View: Move mouse or cursor over "Daily" to quickly view daily technical stock chart and over "Weekly" to view weekly technical stock chart. | |||||

 | RYAM Rayonier Advanced Materials Inc. |
| Sector: Materials | |
| SubSector: Chemicals - Major Diversified | |
| MarketCap: 116.736 Millions | |
| Recent Price: 4.12 Smart Investing & Trading Score: 10 | |
| Day Percent Change: 1.48% Day Change: 0.06 | |
| Week Change: -4.19% Year-to-date Change: 1.7% | |
| RYAM Links: Profile News Message Board | |
| Charts:- Daily , Weekly | |
| Add RYAM to Watchlist: View: Get Complete RYAM Trend Analysis ➞ | |
 | RDVT Red Violet, Inc. |
| Sector: Technology | |
| SubSector: Application Software | |
| MarketCap: 215.162 Millions | |
| Recent Price: 17.01 Smart Investing & Trading Score: 10 | |
| Day Percent Change: 0.06% Day Change: 0.01 | |
| Week Change: -4.22% Year-to-date Change: -14.8% | |
| RDVT Links: Profile News Message Board | |
| Charts:- Daily , Weekly | |
| Add RDVT to Watchlist: View: Get Complete RDVT Trend Analysis ➞ | |
 | ALLK Allakos Inc. |
| Sector: Health Care | |
| SubSector: Biotechnology | |
| MarketCap: 3233.55 Millions | |
| Recent Price: 1.02 Smart Investing & Trading Score: 20 | |
| Day Percent Change: -2.86% Day Change: -0.03 | |
| Week Change: -4.23% Year-to-date Change: -62.6% | |
| ALLK Links: Profile News Message Board | |
| Charts:- Daily , Weekly | |
| Add ALLK to Watchlist: View: Get Complete ALLK Trend Analysis ➞ | |
 | EXFY Expensify, Inc. |
| Sector: Technology | |
| SubSector: Software - Application | |
| MarketCap: 678 Millions | |
| Recent Price: 1.57 Smart Investing & Trading Score: 17 | |
| Day Percent Change: 1.95% Day Change: 0.03 | |
| Week Change: -4.27% Year-to-date Change: -37.7% | |
| EXFY Links: Profile News Message Board | |
| Charts:- Daily , Weekly | |
| Add EXFY to Watchlist: View: Get Complete EXFY Trend Analysis ➞ | |
 | LCTX Lineage Cell Therapeutics, Inc. |
| Sector: Health Care | |
| SubSector: Biotechnology | |
| MarketCap: 141.285 Millions | |
| Recent Price: 1.10 Smart Investing & Trading Score: 46 | |
| Day Percent Change: -3.51% Day Change: -0.04 | |
| Week Change: -4.35% Year-to-date Change: 0.9% | |
| LCTX Links: Profile News Message Board | |
| Charts:- Daily , Weekly | |
| Add LCTX to Watchlist: View: Get Complete LCTX Trend Analysis ➞ | |
 | MGTX MeiraGTx Holdings plc |
| Sector: Health Care | |
| SubSector: Biotechnology | |
| MarketCap: 402.885 Millions | |
| Recent Price: 4.86 Smart Investing & Trading Score: 10 | |
| Day Percent Change: -1.42% Day Change: -0.07 | |
| Week Change: -4.52% Year-to-date Change: -30.8% | |
| MGTX Links: Profile News Message Board | |
| Charts:- Daily , Weekly | |
| Add MGTX to Watchlist: View: Get Complete MGTX Trend Analysis ➞ | |
 | NKTX Nkarta, Inc. |
| Sector: Health Care | |
| SubSector: Biotechnology | |
| MarketCap: 23487 Millions | |
| Recent Price: 7.16 Smart Investing & Trading Score: 10 | |
| Day Percent Change: -5.29% Day Change: -0.40 | |
| Week Change: -4.53% Year-to-date Change: 8.6% | |
| NKTX Links: Profile News Message Board | |
| Charts:- Daily , Weekly | |
| Add NKTX to Watchlist: View: Get Complete NKTX Trend Analysis ➞ | |
 | STRO Sutro Biopharma, Inc. |
| Sector: Health Care | |
| SubSector: Biotechnology | |
| MarketCap: 196.485 Millions | |
| Recent Price: 3.47 Smart Investing & Trading Score: 20 | |
| Day Percent Change: -6.72% Day Change: -0.25 | |
| Week Change: -4.54% Year-to-date Change: -19.1% | |
| STRO Links: Profile News Message Board | |
| Charts:- Daily , Weekly | |
| Add STRO to Watchlist: View: Get Complete STRO Trend Analysis ➞ | |
 | PLSE Pulse Biosciences, Inc. |
| Sector: Health Care | |
| SubSector: Medical Instruments & Supplies | |
| MarketCap: 131.96 Millions | |
| Recent Price: 6.86 Smart Investing & Trading Score: 0 | |
| Day Percent Change: 0.00% Day Change: 0.00 | |
| Week Change: -4.59% Year-to-date Change: -44.0% | |
| PLSE Links: Profile News Message Board | |
| Charts:- Daily , Weekly | |
| Add PLSE to Watchlist: View: Get Complete PLSE Trend Analysis ➞ | |
 | RUSHA Rush Enterprises, Inc. |
| Sector: Services & Goods | |
| SubSector: Auto Dealerships | |
| MarketCap: 1183.21 Millions | |
| Recent Price: 46.44 Smart Investing & Trading Score: 36 | |
| Day Percent Change: -5.67% Day Change: -2.79 | |
| Week Change: -4.66% Year-to-date Change: -7.7% | |
| RUSHA Links: Profile News Message Board | |
| Charts:- Daily , Weekly | |
| Add RUSHA to Watchlist: View: Get Complete RUSHA Trend Analysis ➞ | |
 | DNUT Krispy Kreme, Inc. |
| Sector: Consumer Staples | |
| SubSector: Grocery Stores | |
| MarketCap: 2480 Millions | |
| Recent Price: 13.01 Smart Investing & Trading Score: 0 | |
| Day Percent Change: -1.40% Day Change: -0.18 | |
| Week Change: -4.66% Year-to-date Change: -14.4% | |
| DNUT Links: Profile News Message Board | |
| Charts:- Daily , Weekly | |
| Add DNUT to Watchlist: View: Get Complete DNUT Trend Analysis ➞ | |
 | EGY VAALCO Energy, Inc. |
| Sector: Energy | |
| SubSector: Independent Oil & Gas | |
| MarketCap: 59.5593 Millions | |
| Recent Price: 6.45 Smart Investing & Trading Score: 36 | |
| Day Percent Change: 0.31% Day Change: 0.02 | |
| Week Change: -4.73% Year-to-date Change: 43.7% | |
| EGY Links: Profile News Message Board | |
| Charts:- Daily , Weekly | |
| Add EGY to Watchlist: View: Get Complete EGY Trend Analysis ➞ | |
 | MYPS PLAYSTUDIOS, Inc. |
| Sector: Services & Goods | |
| SubSector: Electronic Gaming & Multimedia | |
| MarketCap: 635 Millions | |
| Recent Price: 2.20 Smart Investing & Trading Score: 46 | |
| Day Percent Change: -3.93% Day Change: -0.09 | |
| Week Change: -4.76% Year-to-date Change: -17.8% | |
| MYPS Links: Profile News Message Board | |
| Charts:- Daily , Weekly | |
| Add MYPS to Watchlist: View: Get Complete MYPS Trend Analysis ➞ | |
 | UNFI United Natural Foods, Inc. |
| Sector: Consumer Staples | |
| SubSector: Food Wholesale | |
| MarketCap: 746.329 Millions | |
| Recent Price: 8.82 Smart Investing & Trading Score: 20 | |
| Day Percent Change: -0.90% Day Change: -0.08 | |
| Week Change: -4.85% Year-to-date Change: -45.7% | |
| UNFI Links: Profile News Message Board | |
| Charts:- Daily , Weekly | |
| Add UNFI to Watchlist: View: Get Complete UNFI Trend Analysis ➞ | |
 | BEAM Beam Therapeutics Inc. |
| Sector: Health Care | |
| SubSector: Biotechnology | |
| MarketCap: 44987 Millions | |
| Recent Price: 22.74 Smart Investing & Trading Score: 10 | |
| Day Percent Change: -3.11% Day Change: -0.73 | |
| Week Change: -4.85% Year-to-date Change: -16.5% | |
| BEAM Links: Profile News Message Board | |
| Charts:- Daily , Weekly | |
| Add BEAM to Watchlist: View: Get Complete BEAM Trend Analysis ➞ | |
 | TCI Transcontinental Realty Investors, Inc. |
| Sector: Financials | |
| SubSector: REIT - Diversified | |
| MarketCap: 158.653 Millions | |
| Recent Price: 30.29 Smart Investing & Trading Score: 10 | |
| Day Percent Change: -3.50% Day Change: -1.10 | |
| Week Change: -4.93% Year-to-date Change: -12.4% | |
| TCI Links: Profile News Message Board | |
| Charts:- Daily , Weekly | |
| Add TCI to Watchlist: View: Get Complete TCI Trend Analysis ➞ | |
 | OOMA Ooma, Inc. |
| Sector: Technology | |
| SubSector: Diversified Communication Services | |
| MarketCap: 222.064 Millions | |
| Recent Price: 6.71 Smart Investing & Trading Score: 20 | |
| Day Percent Change: -3.80% Day Change: -0.26 | |
| Week Change: -4.96% Year-to-date Change: -37.5% | |
| OOMA Links: Profile News Message Board | |
| Charts:- Daily , Weekly | |
| Add OOMA to Watchlist: View: Get Complete OOMA Trend Analysis ➞ | |
 | TRVI Trevi Therapeutics, Inc. |
| Sector: Health Care | |
| SubSector: Biotechnology | |
| MarketCap: 50.6785 Millions | |
| Recent Price: 2.68 Smart Investing & Trading Score: 43 | |
| Day Percent Change: -5.96% Day Change: -0.17 | |
| Week Change: -4.96% Year-to-date Change: 100.0% | |
| TRVI Links: Profile News Message Board | |
| Charts:- Daily , Weekly | |
| Add TRVI to Watchlist: View: Get Complete TRVI Trend Analysis ➞ | |
 | BCRX BioCryst Pharmaceuticals, Inc. |
| Sector: Health Care | |
| SubSector: Biotechnology | |
| MarketCap: 369.385 Millions | |
| Recent Price: 4.21 Smart Investing & Trading Score: 10 | |
| Day Percent Change: -3.88% Day Change: -0.17 | |
| Week Change: -4.97% Year-to-date Change: -29.7% | |
| BCRX Links: Profile News Message Board | |
| Charts:- Daily , Weekly | |
| Add BCRX to Watchlist: View: Get Complete BCRX Trend Analysis ➞ | |
 | FOSL Fossil Group, Inc. |
| Sector: Consumer Staples | |
| SubSector: Textile - Apparel Footwear & Accessories | |
| MarketCap: 215.87 Millions | |
| Recent Price: 0.81 Smart Investing & Trading Score: 20 | |
| Day Percent Change: -3.42% Day Change: -0.03 | |
| Week Change: -4.98% Year-to-date Change: -44.7% | |
| FOSL Links: Profile News Message Board | |
| Charts:- Daily , Weekly | |
| Add FOSL to Watchlist: View: Get Complete FOSL Trend Analysis ➞ | |
 | CMP Compass Minerals International, Inc. |
| Sector: Materials | |
| SubSector: Industrial Metals & Minerals | |
| MarketCap: 1512.1 Millions | |
| Recent Price: 12.78 Smart Investing & Trading Score: 10 | |
| Day Percent Change: -3.26% Day Change: -0.43 | |
| Week Change: -5.05% Year-to-date Change: -49.5% | |
| CMP Links: Profile News Message Board | |
| Charts:- Daily , Weekly | |
| Add CMP to Watchlist: View: Get Complete CMP Trend Analysis ➞ | |
 | BCOV Brightcove Inc. |
| Sector: Technology | |
| SubSector: Application Software | |
| MarketCap: 266.162 Millions | |
| Recent Price: 1.65 Smart Investing & Trading Score: 10 | |
| Day Percent Change: -1.79% Day Change: -0.03 | |
| Week Change: -5.17% Year-to-date Change: -36.3% | |
| BCOV Links: Profile News Message Board | |
| Charts:- Daily , Weekly | |
| Add BCOV to Watchlist: View: Get Complete BCOV Trend Analysis ➞ | |
 | PGC Peapack-Gladstone Financial Corporation |
| Sector: Financials | |
| SubSector: Regional - Northeast Banks | |
| MarketCap: 284.399 Millions | |
| Recent Price: 22.88 Smart Investing & Trading Score: 27 | |
| Day Percent Change: -8.63% Day Change: -2.16 | |
| Week Change: -5.18% Year-to-date Change: -23.3% | |
| PGC Links: Profile News Message Board | |
| Charts:- Daily , Weekly | |
| Add PGC to Watchlist: View: Get Complete PGC Trend Analysis ➞ | |
 | ALGT Allegiant Travel Company |
| Sector: Transports | |
| SubSector: Regional Airlines | |
| MarketCap: 1317.7 Millions | |
| Recent Price: 59.07 Smart Investing & Trading Score: 0 | |
| Day Percent Change: -4.15% Day Change: -2.56 | |
| Week Change: -5.2% Year-to-date Change: -28.5% | |
| ALGT Links: Profile News Message Board | |
| Charts:- Daily , Weekly | |
| Add ALGT to Watchlist: View: Get Complete ALGT Trend Analysis ➞ | |
 | HSHP Himalaya Shipping Ltd. |
| Sector: Industrials | |
| SubSector: Marine Shipping | |
| MarketCap: 179 Millions | |
| Recent Price: 7.64 Smart Investing & Trading Score: 43 | |
| Day Percent Change: 0.53% Day Change: 0.04 | |
| Week Change: -5.21% Year-to-date Change: 13.2% | |
| HSHP Links: Profile News Message Board | |
| Charts:- Daily , Weekly | |
| Add HSHP to Watchlist: View: Get Complete HSHP Trend Analysis ➞ | |
| Too many stocks? View smallcap stocks filtered by marketcap & sector |
| Marketcap: All SmallCap Stocks (default-no microcap), Large, Mid-Range, Small & MicroCap |
| Sector: Tech, Finance, Energy, Staples, Retail, Industrial, Materials, Utilities & Medical |
|
Best Stocks Today 12Stocks.com |
© 2024 12Stocks.com Terms & Conditions Privacy Contact Us
All Information Provided Only For Education And Not To Be Used For Investing or Trading. See Terms & Conditions


One More Thing ... Get Best Stocks Delivered Daily!
Never Ever Miss A Move With Our Top Ten Stocks Lists
Find Best Stocks In Any Market - Bull or Bear Market
Take A Peek At Our Top Ten Stocks Lists: Daily, Weekly, Year-to-Date & Top Trends
Find Best Stocks In Any Market - Bull or Bear Market
Take A Peek At Our Top Ten Stocks Lists: Daily, Weekly, Year-to-Date & Top Trends
Smallcap Stocks With Best Up Trends [0-bearish to 100-bullish]: B. Riley[100], Ribbon [100], Group 1[100], Trustmark [100], MBIA [100], Integer [100], EchoStar [100], Comstock Resources[100], Vishay Inter[100], First Ban[100], Jamf Holding[100]
Best Smallcap Stocks Year-to-Date:
CareMax [574.23%], Janux [352.07%], Viking [249.65%], Alpine Immune[239.13%], Longboard [223.4%], Avidity Biosciences[177.71%], Arcutis Bio[170.9%], Super Micro[165.5%], Vera [149.61%], Hippo [130.79%], Y-mAbs [124.19%] Best Smallcap Stocks This Week:
Matterport [166.09%], B. Riley[48.82%], Seres [30.29%], Riot Blockchain[30.12%], CareMax [27.24%], Ribbon [25.97%], ProKidney [23.28%], SoundHound AI[22.54%], Cipher Mining[22.14%], Hibbett Sports[21.61%], Cullinan Oncology[20.69%] Best Smallcap Stocks Daily:
B. Riley[36.97%], Ribbon [26.46%], Babcock & Wilcox Enterprises[15.57%], Cullinan Oncology[13.55%], Amneal [12.04%], Comtech Tele[10.76%], Innodata [10.28%], Gritstone Oncology[10.06%], Navitas Semiconductor[8.83%], Eyenovia [8.68%], K12 [8.64%]