
 Login Sign Up


| |||||
 |  | ||||

| 12Stocks.com Market Intelligence |
Best SmallCap Stocks
|
| In a hurry? Small Cap Stock Lists: Performance Trends Table, Stock Charts
Sort Small Cap stocks: Daily, Weekly, Year-to-Date, Market Cap & Trends. Filter Small Cap stocks list by sector: Show all, Tech, Finance, Energy, Staples, Retail, Industrial, Materials, Utilities and HealthCare Filter Small Cap stocks list by size: All Large Medium Small and MicroCap |
| 12Stocks.com Small Cap Stocks Performances & Trends Daily | |||||||||
|
|  The overall Smart Investing & Trading Score is 63 (0-bearish to 100-bullish) which puts Small Cap index in short term neutral to bullish trend. The Smart Investing & Trading Score from previous trading session is 58 and hence an improvement of trend.
| ||||||||
Here are the Smart Investing & Trading Scores of the most requested small cap stocks at 12Stocks.com (click stock name for detailed review):
|


| 12Stocks.com: Investing in Smallcap Index with Stocks | |
|
The following table helps investors and traders sort through current performance and trends (as measured by Smart Investing & Trading Score) of various
stocks in the Smallcap Index. Quick View: Move mouse or cursor over stock symbol (ticker) to view short-term technical chart and over stock name to view long term chart. Click on  to add stock symbol to your watchlist and to add stock symbol to your watchlist and  to view watchlist. Click on any ticker or stock name for detailed market intelligence report for that stock. to view watchlist. Click on any ticker or stock name for detailed market intelligence report for that stock. |
12Stocks.com Performance of Stocks in Smallcap Index
| Ticker | Stock Name | Watchlist | Category | Recent Price | Smart Investing & Trading Score | Change % | Weekly Change% |
| ARCB | ArcBest |   | Transports | 146.03 | 68 | 4.65% | 5.79% |
| ITRI | Itron | | Technology | 94.86 | 90 | 3.72% | 5.78% |
| NEOG | Neogen | | Health Care | 12.28 | 42 | 4.24% | 5.77% |
| NEO | NeoGenomics | | Health Care | 14.31 | 42 | 6.63% | 5.76% |
| PIPR | Piper Sandler | | Financials | 196.47 | 55 | 2.61% | 5.76% |
| STC | Stewart Information | | Financials | 63.98 | 93 | 2.46% | 5.71% |
| HLVX | HilleVax | | Health Care | 13.00 | 32 | 0.15% | 5.69% |
| EAT | Brinker | | Services & Goods | 47.80 | 100 | 3.44% | 5.68% |
| AHCO | AdaptHealth | | Health Care | 9.87 | 53 | 2.81% | 5.67% |
| SHLS | Shoals | | Technology | 8.76 | 42 | 3.91% | 5.67% |
| AXL | American Axle | | Consumer Staples | 7.48 | 74 | 3.60% | 5.65% |
| RCKT | Rocket | | Health Care | 24.11 | 20 | 1.01% | 5.65% |
| SGRY | Surgery Partners | | Health Care | 25.17 | 42 | 4.70% | 5.62% |
| CMBM | Cambium s | | Technology | 3.48 | 27 | 3.42% | 5.62% |
| PSTX | Poseida | | Health Care | 2.17 | 17 | 0.46% | 5.61% |
| MOD | Modine | | Consumer Staples | 88.37 | 58 | 2.14% | 5.59% |
| PFSI | PennyMac Financial | | Financials | 92.87 | 100 | 2.66% | 5.58% |
| BZH | Beazer Homes | | Industrials | 27.77 | 32 | 4.46% | 5.57% |
| KYMR | Kymera | | Health Care | 36.57 | 55 | 6.46% | 5.57% |
| RIGL | Rigel | | Health Care | 1.14 | 32 | 0.88% | 5.56% |
| FCCO | First Community | | Financials | 16.89 | 67 | -0.71% | 5.56% |
| RM | Regional Management | | Financials | 26.60 | 100 | 3.18% | 5.56% |
| TNYA | Tenaya | | Health Care | 4.56 | 63 | 2.93% | 5.56% |
| KIND | Nextdoor | | Services & Goods | 2.09 | 90 | 3.98% | 5.56% |
| SBCF | Seacoast Banking | | Financials | 24.05 | 59 | 3.75% | 5.53% |


| Too many stocks? View smallcap stocks filtered by marketcap & sector |
| Marketcap: All SmallCap Stocks (default-no microcap), Large, Mid-Range, Small |
| Smallcap Sector: Tech, Finance, Energy, Staples, Retail, Industrial, Materials, & Medical |
|
Get the most comprehensive stock market coverage daily at 12Stocks.com ➞ Best Stocks Today ➞ Best Stocks Weekly ➞ Best Stocks Year-to-Date ➞ Best Stocks Trends ➞  Best Stocks Today 12Stocks.com Best Nasdaq Stocks ➞ Best S&P 500 Stocks ➞ Best Tech Stocks ➞ Best Biotech Stocks ➞ |
| Detailed Overview of SmallCap Stocks |
| SmallCap Technical Overview, Leaders & Laggards, Top SmallCap ETF Funds & Detailed SmallCap Stocks List, Charts, Trends & More |
| Smallcap: Technical Analysis, Trends & YTD Performance | |
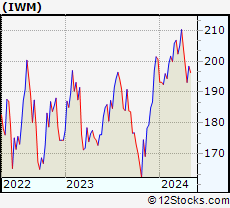
| SmallCap segment as represented by
IWM, an exchange-traded fund [ETF], holds basket of thousands of smallcap stocks from across all major sectors of the US stock market. The smallcap index (contains stocks like Riverbed & Sotheby's) is down by -0.81% and is currently underperforming the overall market by -6.54% year-to-date. Below is a quick view of technical charts and trends: | |
 IWM Weekly Chart |
|
| Long Term Trend: Good | |
| Medium Term Trend: Not Good | |
 IWM Daily Chart |
|
| Short Term Trend: Very Good | |
| Overall Trend Score: 63 | |
| YTD Performance: -0.81% | |
| **Trend Scores & Views Are Only For Educational Purposes And Not For Investing | |
| 12Stocks.com: Top Performing Small Cap Index Stocks | ||||||||||||||||||||||||||||||||||||||||||||||||
 The top performing Small Cap Index stocks year to date are
Now, more recently, over last week, the top performing Small Cap Index stocks on the move are


|
||||||||||||||||||||||||||||||||||||||||||||||||
| 12Stocks.com: Investing in Smallcap Index using Exchange Traded Funds | |
|
The following table shows list of key exchange traded funds (ETF) that
help investors track Smallcap index. The following list also includes leveraged ETF funds that track twice or thrice the daily returns of Smallcap indices. Short or inverse ETF funds move in the opposite direction to the index they track and are useful during market pullbacks or during bear markets. Quick View: Move mouse or cursor over ETF symbol (ticker) to view short-term technical chart and over ETF name to view long term chart. Click on ticker or stock name for detailed view. Click on to add stock symbol to your watchlist and to view watchlist. |
12Stocks.com List of ETFs that track Smallcap Index
| Ticker | ETF Name | Watchlist | Recent Price | Smart Investing & Trading Score | Change % | Week % | Year-to-date % |
| IWM | iShares Russell 2000 | | 199.09 | 63 | 1.94 | 3.08 | -0.81% |
| VTWO | Vanguard Russell 2000 ETF | | 80.53 | 70 | 2.04 | 3.14 | -0.7% |
| IJR | iShares Core S&P Small-Cap | | 105.44 | 75 | 1.91 | 2.16 | -2.59% |
| IJS | iShares S&P Small-Cap 600 Value | | 98.50 | 67 | 2.15 | 3.02 | -4.43% |
| IWN | iShares Russell 2000 Value | | 151.50 | 68 | 1.33 | 2.52 | -2.47% |
| IJT | iShares S&P Small-Cap 600 Growth | | 125.91 | 70 | 2.07 | 3.03 | 0.62% |
| IWO | iShares Russell 2000 Growth | | 252.16 | 58 | 1.71 | 2.8 | -0.02% |
| XSLV | PowerShares S&P SmallCap Low Volatil ETF | | 43.09 | 80 | 1.53 | 2.16 | -2.4% |
| SMLV | SPDR SSGA US Small Cap Low Volatil ETF | | 108.43 | 72 | 0.88 | 2.21 | -3.63% |
| SBB | ProShares Short SmallCap600 | | 16.28 | 40 | -2.05 | -3.33 | 2.2% |
| SAA | ProShares Ultra SmallCap600 | | 23.22 | 24 | 3.80 | 6.52 | -6.93% |
| SDD | ProShares UltraShort SmallCap600 | | 19.23 | 40 | -2.63 | -5.46 | 4.36% |
| 12Stocks.com: Charts, Trends, Fundamental Data and Performances of SmallCap Stocks | |
|
We now take in-depth look at all SmallCap stocks including charts, multi-period performances and overall trends (as measured by Smart Investing & Trading Score). One can sort SmallCap stocks (click link to choose) by Daily, Weekly and by Year-to-Date performances. Also, one can sort by size of the company or by market capitalization. |
| Select Your Default Chart Type: | |||||
| |||||
| Click on stock symbol or name for detailed view. Click on to add stock symbol to your watchlist and to view watchlist. Quick View: Move mouse or cursor over "Daily" to quickly view daily technical stock chart and over "Weekly" to view weekly technical stock chart. | |||||

 | ARCB ArcBest Corporation |
| Sector: Transports | |
| SubSector: Trucking | |
| MarketCap: 515.415 Millions | |
| Recent Price: 146.03 Smart Investing & Trading Score: 68 | |
| Day Percent Change: 4.65% Day Change: 6.50 | |
| Week Change: 5.79% Year-to-date Change: 21.5% | |
| ARCB Links: Profile News Message Board | |
| Charts:- Daily , Weekly | |
| Add ARCB to Watchlist: View: Get Complete ARCB Trend Analysis ➞ | |
 | ITRI Itron, Inc. |
| Sector: Technology | |
| SubSector: Scientific & Technical Instruments | |
| MarketCap: 2222.23 Millions | |
| Recent Price: 94.86 Smart Investing & Trading Score: 90 | |
| Day Percent Change: 3.72% Day Change: 3.40 | |
| Week Change: 5.78% Year-to-date Change: 25.6% | |
| ITRI Links: Profile News Message Board | |
| Charts:- Daily , Weekly | |
| Add ITRI to Watchlist: View: Get Complete ITRI Trend Analysis ➞ | |
 | NEOG Neogen Corporation |
| Sector: Health Care | |
| SubSector: Diagnostic Substances | |
| MarketCap: 3234.71 Millions | |
| Recent Price: 12.28 Smart Investing & Trading Score: 42 | |
| Day Percent Change: 4.24% Day Change: 0.50 | |
| Week Change: 5.77% Year-to-date Change: -38.9% | |
| NEOG Links: Profile News Message Board | |
| Charts:- Daily , Weekly | |
| Add NEOG to Watchlist: View: Get Complete NEOG Trend Analysis ➞ | |
 | NEO NeoGenomics, Inc. |
| Sector: Health Care | |
| SubSector: Medical Laboratories & Research | |
| MarketCap: 2763.8 Millions | |
| Recent Price: 14.31 Smart Investing & Trading Score: 42 | |
| Day Percent Change: 6.63% Day Change: 0.89 | |
| Week Change: 5.76% Year-to-date Change: -11.6% | |
| NEO Links: Profile News Message Board | |
| Charts:- Daily , Weekly | |
| Add NEO to Watchlist: View: Get Complete NEO Trend Analysis ➞ | |
 | PIPR Piper Sandler Companies |
| Sector: Financials | |
| SubSector: Asset Management | |
| MarketCap: 759.603 Millions | |
| Recent Price: 196.47 Smart Investing & Trading Score: 55 | |
| Day Percent Change: 2.61% Day Change: 5.00 | |
| Week Change: 5.76% Year-to-date Change: 12.4% | |
| PIPR Links: Profile News Message Board | |
| Charts:- Daily , Weekly | |
| Add PIPR to Watchlist: View: Get Complete PIPR Trend Analysis ➞ | |
 | STC Stewart Information Services Corporation |
| Sector: Financials | |
| SubSector: Property & Casualty Insurance | |
| MarketCap: 629.912 Millions | |
| Recent Price: 63.98 Smart Investing & Trading Score: 93 | |
| Day Percent Change: 2.46% Day Change: 1.54 | |
| Week Change: 5.71% Year-to-date Change: 8.9% | |
| STC Links: Profile News Message Board | |
| Charts:- Daily , Weekly | |
| Add STC to Watchlist: View: Get Complete STC Trend Analysis ➞ | |
 | HLVX HilleVax, Inc. |
| Sector: Health Care | |
| SubSector: Biotechnology | |
| MarketCap: 680 Millions | |
| Recent Price: 13.00 Smart Investing & Trading Score: 32 | |
| Day Percent Change: 0.15% Day Change: 0.02 | |
| Week Change: 5.69% Year-to-date Change: -21.1% | |
| HLVX Links: Profile News Message Board | |
| Charts:- Daily , Weekly | |
| Add HLVX to Watchlist: View: Get Complete HLVX Trend Analysis ➞ | |
 | EAT Brinker International, Inc. |
| Sector: Services & Goods | |
| SubSector: Restaurants | |
| MarketCap: 435.97 Millions | |
| Recent Price: 47.80 Smart Investing & Trading Score: 100 | |
| Day Percent Change: 3.44% Day Change: 1.59 | |
| Week Change: 5.68% Year-to-date Change: 10.7% | |
| EAT Links: Profile News Message Board | |
| Charts:- Daily , Weekly | |
| Add EAT to Watchlist: View: Get Complete EAT Trend Analysis ➞ | |
 | AHCO AdaptHealth Corp. |
| Sector: Health Care | |
| SubSector: Medical Appliances & Equipment | |
| MarketCap: 1084.8 Millions | |
| Recent Price: 9.87 Smart Investing & Trading Score: 53 | |
| Day Percent Change: 2.81% Day Change: 0.27 | |
| Week Change: 5.67% Year-to-date Change: 35.4% | |
| AHCO Links: Profile News Message Board | |
| Charts:- Daily , Weekly | |
| Add AHCO to Watchlist: View: Get Complete AHCO Trend Analysis ➞ | |
 | SHLS Shoals Technologies Group, Inc. |
| Sector: Technology | |
| SubSector: Solar | |
| MarketCap: 4360 Millions | |
| Recent Price: 8.76 Smart Investing & Trading Score: 42 | |
| Day Percent Change: 3.91% Day Change: 0.33 | |
| Week Change: 5.67% Year-to-date Change: -43.5% | |
| SHLS Links: Profile News Message Board | |
| Charts:- Daily , Weekly | |
| Add SHLS to Watchlist: View: Get Complete SHLS Trend Analysis ➞ | |
 | AXL American Axle & Manufacturing Holdings, Inc. |
| Sector: Consumer Staples | |
| SubSector: Auto Parts | |
| MarketCap: 407.139 Millions | |
| Recent Price: 7.48 Smart Investing & Trading Score: 74 | |
| Day Percent Change: 3.60% Day Change: 0.26 | |
| Week Change: 5.65% Year-to-date Change: -15.1% | |
| AXL Links: Profile News Message Board | |
| Charts:- Daily , Weekly | |
| Add AXL to Watchlist: View: Get Complete AXL Trend Analysis ➞ | |
 | RCKT Rocket Pharmaceuticals, Inc. |
| Sector: Health Care | |
| SubSector: Biotechnology | |
| MarketCap: 899.585 Millions | |
| Recent Price: 24.11 Smart Investing & Trading Score: 20 | |
| Day Percent Change: 1.01% Day Change: 0.24 | |
| Week Change: 5.65% Year-to-date Change: -19.6% | |
| RCKT Links: Profile News Message Board | |
| Charts:- Daily , Weekly | |
| Add RCKT to Watchlist: View: Get Complete RCKT Trend Analysis ➞ | |
 | SGRY Surgery Partners, Inc. |
| Sector: Health Care | |
| SubSector: Hospitals | |
| MarketCap: 328.446 Millions | |
| Recent Price: 25.17 Smart Investing & Trading Score: 42 | |
| Day Percent Change: 4.70% Day Change: 1.13 | |
| Week Change: 5.62% Year-to-date Change: -21.3% | |
| SGRY Links: Profile News Message Board | |
| Charts:- Daily , Weekly | |
| Add SGRY to Watchlist: View: Get Complete SGRY Trend Analysis ➞ | |
 | CMBM Cambium Networks Corporation |
| Sector: Technology | |
| SubSector: Communication Equipment | |
| MarketCap: 143.739 Millions | |
| Recent Price: 3.48 Smart Investing & Trading Score: 27 | |
| Day Percent Change: 3.42% Day Change: 0.12 | |
| Week Change: 5.62% Year-to-date Change: -42.1% | |
| CMBM Links: Profile News Message Board | |
| Charts:- Daily , Weekly | |
| Add CMBM to Watchlist: View: Get Complete CMBM Trend Analysis ➞ | |
 | PSTX Poseida Therapeutics, Inc. |
| Sector: Health Care | |
| SubSector: Biotechnology | |
| MarketCap: 64487 Millions | |
| Recent Price: 2.17 Smart Investing & Trading Score: 17 | |
| Day Percent Change: 0.46% Day Change: 0.01 | |
| Week Change: 5.61% Year-to-date Change: -35.7% | |
| PSTX Links: Profile News Message Board | |
| Charts:- Daily , Weekly | |
| Add PSTX to Watchlist: View: Get Complete PSTX Trend Analysis ➞ | |
 | MOD Modine Manufacturing Company |
| Sector: Consumer Staples | |
| SubSector: Auto Parts | |
| MarketCap: 177.339 Millions | |
| Recent Price: 88.37 Smart Investing & Trading Score: 58 | |
| Day Percent Change: 2.14% Day Change: 1.85 | |
| Week Change: 5.59% Year-to-date Change: 48.0% | |
| MOD Links: Profile News Message Board | |
| Charts:- Daily , Weekly | |
| Add MOD to Watchlist: View: Get Complete MOD Trend Analysis ➞ | |
 | PFSI PennyMac Financial Services, Inc. |
| Sector: Financials | |
| SubSector: Mortgage Investment | |
| MarketCap: 1588.09 Millions | |
| Recent Price: 92.87 Smart Investing & Trading Score: 100 | |
| Day Percent Change: 2.66% Day Change: 2.41 | |
| Week Change: 5.58% Year-to-date Change: 5.1% | |
| PFSI Links: Profile News Message Board | |
| Charts:- Daily , Weekly | |
| Add PFSI to Watchlist: View: Get Complete PFSI Trend Analysis ➞ | |
 | BZH Beazer Homes USA, Inc. |
| Sector: Industrials | |
| SubSector: Residential Construction | |
| MarketCap: 180.106 Millions | |
| Recent Price: 27.77 Smart Investing & Trading Score: 32 | |
| Day Percent Change: 4.46% Day Change: 1.18 | |
| Week Change: 5.57% Year-to-date Change: -17.8% | |
| BZH Links: Profile News Message Board | |
| Charts:- Daily , Weekly | |
| Add BZH to Watchlist: View: Get Complete BZH Trend Analysis ➞ | |
 | KYMR Kymera Therapeutics, Inc. |
| Sector: Health Care | |
| SubSector: Biotechnology | |
| MarketCap: 27087 Millions | |
| Recent Price: 36.57 Smart Investing & Trading Score: 55 | |
| Day Percent Change: 6.46% Day Change: 2.22 | |
| Week Change: 5.57% Year-to-date Change: 43.9% | |
| KYMR Links: Profile News Message Board | |
| Charts:- Daily , Weekly | |
| Add KYMR to Watchlist: View: Get Complete KYMR Trend Analysis ➞ | |
 | RIGL Rigel Pharmaceuticals, Inc. |
| Sector: Health Care | |
| SubSector: Biotechnology | |
| MarketCap: 256.585 Millions | |
| Recent Price: 1.14 Smart Investing & Trading Score: 32 | |
| Day Percent Change: 0.88% Day Change: 0.01 | |
| Week Change: 5.56% Year-to-date Change: -21.4% | |
| RIGL Links: Profile News Message Board | |
| Charts:- Daily , Weekly | |
| Add RIGL to Watchlist: View: Get Complete RIGL Trend Analysis ➞ | |
 | FCCO First Community Corporation |
| Sector: Financials | |
| SubSector: Regional - Southwest Banks | |
| MarketCap: 123.865 Millions | |
| Recent Price: 16.89 Smart Investing & Trading Score: 67 | |
| Day Percent Change: -0.71% Day Change: -0.12 | |
| Week Change: 5.56% Year-to-date Change: -21.6% | |
| FCCO Links: Profile News Message Board | |
| Charts:- Daily , Weekly | |
| Add FCCO to Watchlist: View: Get Complete FCCO Trend Analysis ➞ | |
 | RM Regional Management Corp. |
| Sector: Financials | |
| SubSector: Credit Services | |
| MarketCap: 148.008 Millions | |
| Recent Price: 26.60 Smart Investing & Trading Score: 100 | |
| Day Percent Change: 3.18% Day Change: 0.82 | |
| Week Change: 5.56% Year-to-date Change: 6.1% | |
| RM Links: Profile News Message Board | |
| Charts:- Daily , Weekly | |
| Add RM to Watchlist: View: Get Complete RM Trend Analysis ➞ | |
 | TNYA Tenaya Therapeutics, Inc. |
| Sector: Health Care | |
| SubSector: Biotechnology | |
| MarketCap: 395 Millions | |
| Recent Price: 4.56 Smart Investing & Trading Score: 63 | |
| Day Percent Change: 2.93% Day Change: 0.13 | |
| Week Change: 5.56% Year-to-date Change: 43.4% | |
| TNYA Links: Profile News Message Board | |
| Charts:- Daily , Weekly | |
| Add TNYA to Watchlist: View: Get Complete TNYA Trend Analysis ➞ | |
 | KIND Nextdoor Holdings, Inc. |
| Sector: Services & Goods | |
| SubSector: Internet Content & Information | |
| MarketCap: 1170 Millions | |
| Recent Price: 2.09 Smart Investing & Trading Score: 90 | |
| Day Percent Change: 3.98% Day Change: 0.08 | |
| Week Change: 5.56% Year-to-date Change: 13.0% | |
| KIND Links: Profile News Message Board | |
| Charts:- Daily , Weekly | |
| Add KIND to Watchlist: View: Get Complete KIND Trend Analysis ➞ | |
 | SBCF Seacoast Banking Corporation of Florida |
| Sector: Financials | |
| SubSector: Regional - Mid-Atlantic Banks | |
| MarketCap: 881.559 Millions | |
| Recent Price: 24.05 Smart Investing & Trading Score: 59 | |
| Day Percent Change: 3.75% Day Change: 0.87 | |
| Week Change: 5.53% Year-to-date Change: -15.5% | |
| SBCF Links: Profile News Message Board | |
| Charts:- Daily , Weekly | |
| Add SBCF to Watchlist: View: Get Complete SBCF Trend Analysis ➞ | |
| Too many stocks? View smallcap stocks filtered by marketcap & sector |
| Marketcap: All SmallCap Stocks (default-no microcap), Large, Mid-Range, Small & MicroCap |
| Sector: Tech, Finance, Energy, Staples, Retail, Industrial, Materials, Utilities & Medical |
|
Best Stocks Today 12Stocks.com |
© 2024 12Stocks.com Terms & Conditions Privacy Contact Us
All Information Provided Only For Education And Not To Be Used For Investing or Trading. See Terms & Conditions


One More Thing ... Get Best Stocks Delivered Daily!
Never Ever Miss A Move With Our Top Ten Stocks Lists
Find Best Stocks In Any Market - Bull or Bear Market
Take A Peek At Our Top Ten Stocks Lists: Daily, Weekly, Year-to-Date & Top Trends
Find Best Stocks In Any Market - Bull or Bear Market
Take A Peek At Our Top Ten Stocks Lists: Daily, Weekly, Year-to-Date & Top Trends
Smallcap Stocks With Best Up Trends [0-bearish to 100-bullish]: Hibbett Sports[100], Riot Blockchain[100], AZZ [100], Agios [100], BioLife Solutions[100], Mueller Industries[100], Gannett Co[100], Dillard s[100], Lands [100], Calavo Growers[100], Oscar Health[100]
Best Smallcap Stocks Year-to-Date:
Janux [363.94%], Viking [258.89%], Alpine Immune[239.42%], Longboard [235.52%], Avidity Biosciences[184.85%], Arcutis Bio[173.84%], Super Micro[170.18%], Vera [161.76%], Hippo [133.53%], Y-mAbs [129.62%], Trevi [127.99%] Best Smallcap Stocks This Week:
Matterport [164.08%], Seres [36.67%], Riot Blockchain[32.91%], Cipher Mining[26.17%], ProKidney [25.74%], Braemar Hotels[24.35%], Hibbett Sports[21.06%], Assertio [20.47%], BigBear.ai [19.31%], Generation Bio[19.13%], SoundHound AI[18.87%] Best Smallcap Stocks Daily:
Virgin Galactic[22.89%], Seres [22.51%], Hibbett Sports[18.80%], Marathon Patent[18.12%], Generation Bio[17.44%], Braemar Hotels[15.79%], IGM Biosciences[15.70%], Heron [15.25%], SES AI[15.22%], Cutera [13.14%], Seer [11.68%]