
 Login Sign Up


| |||||
 |  | ||||

| 12Stocks.com Market Intelligence |
Best SmallCap Stocks
|
| In a hurry? Small Cap Stock Lists: Performance Trends Table, Stock Charts
Sort Small Cap stocks: Daily, Weekly, Year-to-Date, Market Cap & Trends. Filter Small Cap stocks list by sector: Show all, Tech, Finance, Energy, Staples, Retail, Industrial, Materials, Utilities and HealthCare Filter Small Cap stocks list by size: All Large Medium Small and MicroCap |
| 12Stocks.com Small Cap Stocks Performances & Trends Daily | |||||||||
|
|  The overall Smart Investing & Trading Score is 31 (0-bearish to 100-bullish) which puts Small Cap index in short term bearish to neutral trend. The Smart Investing & Trading Score from previous trading session is 58 and hence a deterioration of trend.
| ||||||||
Here are the Smart Investing & Trading Scores of the most requested small cap stocks at 12Stocks.com (click stock name for detailed review):
|


| 12Stocks.com: Investing in Smallcap Index with Stocks | |
|
The following table helps investors and traders sort through current performance and trends (as measured by Smart Investing & Trading Score) of various
stocks in the Smallcap Index. Quick View: Move mouse or cursor over stock symbol (ticker) to view short-term technical chart and over stock name to view long term chart. Click on  to add stock symbol to your watchlist and to add stock symbol to your watchlist and  to view watchlist. Click on any ticker or stock name for detailed market intelligence report for that stock. to view watchlist. Click on any ticker or stock name for detailed market intelligence report for that stock. |
12Stocks.com Performance of Stocks in Smallcap Index
| Ticker | Stock Name | Watchlist | Category | Recent Price | Smart Investing & Trading Score | Change % | Weekly Change% |
| USCB | USCB Financial |   | Financials | 10.36 | 27 | -2.72% | -2.72% |
| TRUE | TrueCar | | Technology | 2.83 | 10 | -2.75% | -2.75% |
| ALEC | Alector | | Health Care | 4.96 | 10 | -5.52% | -2.75% |
| LGND | Ligand | | Health Care | 70.47 | 20 | -0.75% | -2.77% |
| SCLX | Scilex Holding | | Health Care | 0.87 | 35 | -3.98% | -2.77% |
| PTLO | Portillos | | Services & Goods | 11.78 | 18 | -2.04% | -2.77% |
| HOFT | Hooker Furniture | | Consumer Staples | 17.81 | 17 | -1.06% | -2.78% |
| AVNS | Avanos Medical | | Health Care | 18.19 | 20 | -2.78% | -2.78% |
| ACCD | Accolade | | Health Care | 9.10 | 17 | -3.19% | -2.78% |
| PTCT | PTC | | Health Care | 24.61 | 28 | -2.40% | -2.82% |
| SHEN | Shenandoah Tele | | Technology | 14.28 | 27 | 0.74% | -2.83% |
| HCKT | Hackett Group | | Technology | 21.96 | 10 | -1.66% | -2.83% |
| OMCL | Omnicell | | Technology | 27.04 | 30 | -1.42% | -2.84% |
| WOW | WideOpenWest | | Technology | 3.42 | 15 | -2.01% | -2.84% |
| ACAD | ACADIA | | Health Care | 16.34 | 10 | -1.51% | -2.85% |
| MC | Moelis & | | Financials | 50.18 | 35 | -7.06% | -2.85% |
| ME | 23andMe Holding | | Health Care | 0.47 | 30 | -2.62% | -2.86% |
| GRND | Grindr | | Technology | 9.50 | 46 | -0.42% | -2.86% |
| DM | Dominion Midstream | | Energy | 0.82 | 25 | -1.70% | -2.87% |
| VRCA | Verrica | | Health Care | 6.76 | 49 | -0.44% | -2.87% |
| ULH | Universal Logistics | | Transports | 32.53 | 68 | -3.21% | -2.90% |
| MG | Mistras Group | | Services & Goods | 8.81 | 51 | -1.29% | -2.92% |
| DSP | Viant | | Technology | 8.25 | 38 | -3.73% | -2.94% |
| AMLX | Amylyx | | Health Care | 1.81 | 30 | -5.96% | -2.94% |
| SRI | Stoneridge | | Consumer Staples | 15.15 | 10 | -0.66% | -2.95% |
| For chart view version of above stock list: Chart View ➞ 0 - 25 , 25 - 50 , 50 - 75 , 75 - 100 , 100 - 125 , 125 - 150 , 150 - 175 , 175 - 200 , 200 - 225 , 225 - 250 , 250 - 275 , 275 - 300 , 300 - 325 , 325 - 350 , 350 - 375 , 375 - 400 , 400 - 425 , 425 - 450 , 450 - 475 , 475 - 500 , 500 - 525 , 525 - 550 , 550 - 575 , 575 - 600 , 600 - 625 , 625 - 650 , 650 - 675 , 675 - 700 , 700 - 725 , 725 - 750 , 750 - 775 , 775 - 800 , 800 - 825 , 825 - 850 , 850 - 875 , 875 - 900 , 900 - 925 , 925 - 950 , 950 - 975 , 975 - 1000 , 1000 - 1025 , 1025 - 1050 , 1050 - 1075 , 1075 - 1100 , 1100 - 1125 , 1125 - 1150 , 1150 - 1175 , 1175 - 1200 , 1200 - 1225 , 1225 - 1250 , 1250 - 1275 , 1275 - 1300 , 1300 - 1325 , 1325 - 1350 , 1350 - 1375 , 1375 - 1400 , 1400 - 1425 , 1425 - 1450 , 1450 - 1475 , 1475 - 1500 , 1500 - 1525 , 1525 - 1550 , 1550 - 1575 , 1575 - 1600 | ||
 | Click To Change The Sort Order: By Market Cap or Company Size Performance: Year-to-date, Week and Day |  |
| Too many stocks? View smallcap stocks filtered by marketcap & sector |
| Marketcap: All SmallCap Stocks (default-no microcap), Large, Mid-Range, Small |
| Smallcap Sector: Tech, Finance, Energy, Staples, Retail, Industrial, Materials, & Medical |
|
Get the most comprehensive stock market coverage daily at 12Stocks.com ➞ Best Stocks Today ➞ Best Stocks Weekly ➞ Best Stocks Year-to-Date ➞ Best Stocks Trends ➞  Best Stocks Today 12Stocks.com Best Nasdaq Stocks ➞ Best S&P 500 Stocks ➞ Best Tech Stocks ➞ Best Biotech Stocks ➞ |
| Detailed Overview of SmallCap Stocks |
| SmallCap Technical Overview, Leaders & Laggards, Top SmallCap ETF Funds & Detailed SmallCap Stocks List, Charts, Trends & More |
| Smallcap: Technical Analysis, Trends & YTD Performance | |
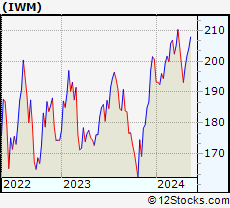
| SmallCap segment as represented by
IWM, an exchange-traded fund [ETF], holds basket of thousands of smallcap stocks from across all major sectors of the US stock market. The smallcap index (contains stocks like Riverbed & Sotheby's) is down by -2.82% and is currently underperforming the overall market by -7.07% year-to-date. Below is a quick view of technical charts and trends: | |
 IWM Weekly Chart |
|
| Long Term Trend: Good | |
| Medium Term Trend: Not Good | |
 IWM Daily Chart |
|
| Short Term Trend: Not Good | |
| Overall Trend Score: 31 | |
| YTD Performance: -2.82% | |
| **Trend Scores & Views Are Only For Educational Purposes And Not For Investing | |
| 12Stocks.com: Top Performing Small Cap Index Stocks | ||||||||||||||||||||||||||||||||||||||||||||||||
 The top performing Small Cap Index stocks year to date are
Now, more recently, over last week, the top performing Small Cap Index stocks on the move are


|
||||||||||||||||||||||||||||||||||||||||||||||||
| 12Stocks.com: Investing in Smallcap Index using Exchange Traded Funds | |
|
The following table shows list of key exchange traded funds (ETF) that
help investors track Smallcap index. The following list also includes leveraged ETF funds that track twice or thrice the daily returns of Smallcap indices. Short or inverse ETF funds move in the opposite direction to the index they track and are useful during market pullbacks or during bear markets. Quick View: Move mouse or cursor over ETF symbol (ticker) to view short-term technical chart and over ETF name to view long term chart. Click on ticker or stock name for detailed view. Click on to add stock symbol to your watchlist and to view watchlist. |
12Stocks.com List of ETFs that track Smallcap Index
| Ticker | ETF Name | Watchlist | Recent Price | Smart Investing & Trading Score | Change % | Week % | Year-to-date % |
| IWM | iShares Russell 2000 | | 195.06 | 31 | -1.33 | 0.99 | -2.82% |
| SBB | ProShares Short SmallCap600 | | 16.60 | 40 | 1.41 | -1.43 | 4.21% |
| SDD | ProShares UltraShort SmallCap600 | | 19.79 | 42 | 1.51 | -2.73 | 7.37% |
| SMLV | SPDR SSGA US Small Cap Low Volatil ETF | | 107.56 | 73 | -0.80 | 1.39 | -4.41% |
| SAA | ProShares Ultra SmallCap600 | | 23.01 | 58 | 0.00 | 5.55 | -7.78% |
| 12Stocks.com: Charts, Trends, Fundamental Data and Performances of SmallCap Stocks | |
|
We now take in-depth look at all SmallCap stocks including charts, multi-period performances and overall trends (as measured by Smart Investing & Trading Score). One can sort SmallCap stocks (click link to choose) by Daily, Weekly and by Year-to-Date performances. Also, one can sort by size of the company or by market capitalization. |
| Select Your Default Chart Type: | |||||
| |||||
| Click on stock symbol or name for detailed view. Click on to add stock symbol to your watchlist and to view watchlist. Quick View: Move mouse or cursor over "Daily" to quickly view daily technical stock chart and over "Weekly" to view weekly technical stock chart. | |||||

 | USCB USCB Financial Holdings, Inc. |
| Sector: Financials | |
| SubSector: Banks - Regional | |
| MarketCap: 198 Millions | |
| Recent Price: 10.36 Smart Investing & Trading Score: 27 | |
| Day Percent Change: -2.72% Day Change: -0.29 | |
| Week Change: -2.72% Year-to-date Change: -15.6% | |
| USCB Links: Profile News Message Board | |
| Charts:- Daily , Weekly | |
| Add USCB to Watchlist: View: Get Complete USCB Trend Analysis ➞ | |
 | TRUE TrueCar, Inc. |
| Sector: Technology | |
| SubSector: Internet Service Providers | |
| MarketCap: 244.18 Millions | |
| Recent Price: 2.83 Smart Investing & Trading Score: 10 | |
| Day Percent Change: -2.75% Day Change: -0.08 | |
| Week Change: -2.75% Year-to-date Change: -18.2% | |
| TRUE Links: Profile News Message Board | |
| Charts:- Daily , Weekly | |
| Add TRUE to Watchlist: View: Get Complete TRUE Trend Analysis ➞ | |
 | ALEC Alector, Inc. |
| Sector: Health Care | |
| SubSector: Biotechnology | |
| MarketCap: 2719.35 Millions | |
| Recent Price: 4.96 Smart Investing & Trading Score: 10 | |
| Day Percent Change: -5.52% Day Change: -0.29 | |
| Week Change: -2.75% Year-to-date Change: -37.8% | |
| ALEC Links: Profile News Message Board | |
| Charts:- Daily , Weekly | |
| Add ALEC to Watchlist: View: Get Complete ALEC Trend Analysis ➞ | |
 | LGND Ligand Pharmaceuticals Incorporated |
| Sector: Health Care | |
| SubSector: Biotechnology | |
| MarketCap: 1344.45 Millions | |
| Recent Price: 70.47 Smart Investing & Trading Score: 20 | |
| Day Percent Change: -0.75% Day Change: -0.53 | |
| Week Change: -2.77% Year-to-date Change: -1.3% | |
| LGND Links: Profile News Message Board | |
| Charts:- Daily , Weekly | |
| Add LGND to Watchlist: View: Get Complete LGND Trend Analysis ➞ | |
 | SCLX Scilex Holding Company |
| Sector: Health Care | |
| SubSector: Drug Manufacturers - General | |
| MarketCap: 927 Millions | |
| Recent Price: 0.87 Smart Investing & Trading Score: 35 | |
| Day Percent Change: -3.98% Day Change: -0.04 | |
| Week Change: -2.77% Year-to-date Change: -55.5% | |
| SCLX Links: Profile News Message Board | |
| Charts:- Daily , Weekly | |
| Add SCLX to Watchlist: View: Get Complete SCLX Trend Analysis ➞ | |
 | PTLO Portillos Inc. |
| Sector: Services & Goods | |
| SubSector: Restaurants | |
| MarketCap: 1590 Millions | |
| Recent Price: 11.78 Smart Investing & Trading Score: 18 | |
| Day Percent Change: -2.04% Day Change: -0.24 | |
| Week Change: -2.77% Year-to-date Change: -26.6% | |
| PTLO Links: Profile News Message Board | |
| Charts:- Daily , Weekly | |
| Add PTLO to Watchlist: View: Get Complete PTLO Trend Analysis ➞ | |
 | HOFT Hooker Furniture Corporation |
| Sector: Consumer Staples | |
| SubSector: Home Furnishings & Fixtures | |
| MarketCap: 173.235 Millions | |
| Recent Price: 17.81 Smart Investing & Trading Score: 17 | |
| Day Percent Change: -1.06% Day Change: -0.19 | |
| Week Change: -2.78% Year-to-date Change: -31.7% | |
| HOFT Links: Profile News Message Board | |
| Charts:- Daily , Weekly | |
| Add HOFT to Watchlist: View: Get Complete HOFT Trend Analysis ➞ | |
 | AVNS Avanos Medical, Inc. |
| Sector: Health Care | |
| SubSector: Medical Instruments & Supplies | |
| MarketCap: 1229.6 Millions | |
| Recent Price: 18.19 Smart Investing & Trading Score: 20 | |
| Day Percent Change: -2.78% Day Change: -0.52 | |
| Week Change: -2.78% Year-to-date Change: -18.9% | |
| AVNS Links: Profile News Message Board | |
| Charts:- Daily , Weekly | |
| Add AVNS to Watchlist: View: Get Complete AVNS Trend Analysis ➞ | |
 | ACCD Accolade, Inc. |
| Sector: Health Care | |
| SubSector: Health Information Services | |
| MarketCap: 32987 Millions | |
| Recent Price: 9.10 Smart Investing & Trading Score: 17 | |
| Day Percent Change: -3.19% Day Change: -0.30 | |
| Week Change: -2.78% Year-to-date Change: -24.3% | |
| ACCD Links: Profile News Message Board | |
| Charts:- Daily , Weekly | |
| Add ACCD to Watchlist: View: Get Complete ACCD Trend Analysis ➞ | |
 | PTCT PTC Therapeutics, Inc. |
| Sector: Health Care | |
| SubSector: Biotechnology | |
| MarketCap: 2795.85 Millions | |
| Recent Price: 24.61 Smart Investing & Trading Score: 28 | |
| Day Percent Change: -2.40% Day Change: -0.61 | |
| Week Change: -2.82% Year-to-date Change: -10.7% | |
| PTCT Links: Profile News Message Board | |
| Charts:- Daily , Weekly | |
| Add PTCT to Watchlist: View: Get Complete PTCT Trend Analysis ➞ | |
 | SHEN Shenandoah Telecommunications Company |
| Sector: Technology | |
| SubSector: Telecom Services - Domestic | |
| MarketCap: 2329.67 Millions | |
| Recent Price: 14.28 Smart Investing & Trading Score: 27 | |
| Day Percent Change: 0.74% Day Change: 0.11 | |
| Week Change: -2.83% Year-to-date Change: -34.0% | |
| SHEN Links: Profile News Message Board | |
| Charts:- Daily , Weekly | |
| Add SHEN to Watchlist: View: Get Complete SHEN Trend Analysis ➞ | |
 | HCKT The Hackett Group, Inc. |
| Sector: Technology | |
| SubSector: Information Technology Services | |
| MarketCap: 334.468 Millions | |
| Recent Price: 21.96 Smart Investing & Trading Score: 10 | |
| Day Percent Change: -1.66% Day Change: -0.37 | |
| Week Change: -2.83% Year-to-date Change: -3.6% | |
| HCKT Links: Profile News Message Board | |
| Charts:- Daily , Weekly | |
| Add HCKT to Watchlist: View: Get Complete HCKT Trend Analysis ➞ | |
 | OMCL Omnicell, Inc. |
| Sector: Technology | |
| SubSector: Healthcare Information Services | |
| MarketCap: 2781.05 Millions | |
| Recent Price: 27.04 Smart Investing & Trading Score: 30 | |
| Day Percent Change: -1.42% Day Change: -0.39 | |
| Week Change: -2.84% Year-to-date Change: -28.1% | |
| OMCL Links: Profile News Message Board | |
| Charts:- Daily , Weekly | |
| Add OMCL to Watchlist: View: Get Complete OMCL Trend Analysis ➞ | |
 | WOW WideOpenWest, Inc. |
| Sector: Technology | |
| SubSector: CATV Systems | |
| MarketCap: 328.932 Millions | |
| Recent Price: 3.42 Smart Investing & Trading Score: 15 | |
| Day Percent Change: -2.01% Day Change: -0.07 | |
| Week Change: -2.84% Year-to-date Change: -15.6% | |
| WOW Links: Profile News Message Board | |
| Charts:- Daily , Weekly | |
| Add WOW to Watchlist: View: Get Complete WOW Trend Analysis ➞ | |
 | ACAD ACADIA Pharmaceuticals Inc. |
| Sector: Health Care | |
| SubSector: Biotechnology | |
| MarketCap: 5400.35 Millions | |
| Recent Price: 16.34 Smart Investing & Trading Score: 10 | |
| Day Percent Change: -1.51% Day Change: -0.25 | |
| Week Change: -2.85% Year-to-date Change: -47.8% | |
| ACAD Links: Profile News Message Board | |
| Charts:- Daily , Weekly | |
| Add ACAD to Watchlist: View: Get Complete ACAD Trend Analysis ➞ | |
 | MC Moelis & Company |
| Sector: Financials | |
| SubSector: Asset Management | |
| MarketCap: 1675.93 Millions | |
| Recent Price: 50.18 Smart Investing & Trading Score: 35 | |
| Day Percent Change: -7.06% Day Change: -3.81 | |
| Week Change: -2.85% Year-to-date Change: -10.6% | |
| MC Links: Profile News Message Board | |
| Charts:- Daily , Weekly | |
| Add MC to Watchlist: View: Get Complete MC Trend Analysis ➞ | |
 | ME 23andMe Holding Co. |
| Sector: Health Care | |
| SubSector: Diagnostics & Research | |
| MarketCap: 802 Millions | |
| Recent Price: 0.47 Smart Investing & Trading Score: 30 | |
| Day Percent Change: -2.62% Day Change: -0.01 | |
| Week Change: -2.86% Year-to-date Change: -47.4% | |
| ME Links: Profile News Message Board | |
| Charts:- Daily , Weekly | |
| Add ME to Watchlist: View: Get Complete ME Trend Analysis ➞ | |
 | GRND Grindr Inc. |
| Sector: Technology | |
| SubSector: Software - Application | |
| MarketCap: 929 Millions | |
| Recent Price: 9.50 Smart Investing & Trading Score: 46 | |
| Day Percent Change: -0.42% Day Change: -0.04 | |
| Week Change: -2.86% Year-to-date Change: 6.0% | |
| GRND Links: Profile News Message Board | |
| Charts:- Daily , Weekly | |
| Add GRND to Watchlist: View: Get Complete GRND Trend Analysis ➞ | |
 | DM Dominion Midstream Partners, LP |
| Sector: Energy | |
| SubSector: Oil & Gas Pipelines | |
| MarketCap: 3017.01 Millions | |
| Recent Price: 0.82 Smart Investing & Trading Score: 25 | |
| Day Percent Change: -1.70% Day Change: -0.01 | |
| Week Change: -2.87% Year-to-date Change: 9.2% | |
| DM Links: Profile News Message Board | |
| Charts:- Daily , Weekly | |
| Add DM to Watchlist: View: Get Complete DM Trend Analysis ➞ | |
 | VRCA Verrica Pharmaceuticals Inc. |
| Sector: Health Care | |
| SubSector: Biotechnology | |
| MarketCap: 289.585 Millions | |
| Recent Price: 6.76 Smart Investing & Trading Score: 49 | |
| Day Percent Change: -0.44% Day Change: -0.03 | |
| Week Change: -2.87% Year-to-date Change: -7.7% | |
| VRCA Links: Profile News Message Board | |
| Charts:- Daily , Weekly | |
| Add VRCA to Watchlist: View: Get Complete VRCA Trend Analysis ➞ | |
 | ULH Universal Logistics Holdings, Inc. |
| Sector: Transports | |
| SubSector: Trucking | |
| MarketCap: 354.915 Millions | |
| Recent Price: 32.53 Smart Investing & Trading Score: 68 | |
| Day Percent Change: -3.21% Day Change: -1.08 | |
| Week Change: -2.9% Year-to-date Change: 16.1% | |
| ULH Links: Profile News Message Board | |
| Charts:- Daily , Weekly | |
| Add ULH to Watchlist: View: Get Complete ULH Trend Analysis ➞ | |
 | MG Mistras Group, Inc. |
| Sector: Services & Goods | |
| SubSector: Security & Protection Services | |
| MarketCap: 136.903 Millions | |
| Recent Price: 8.81 Smart Investing & Trading Score: 51 | |
| Day Percent Change: -1.29% Day Change: -0.12 | |
| Week Change: -2.92% Year-to-date Change: 20.4% | |
| MG Links: Profile News Message Board | |
| Charts:- Daily , Weekly | |
| Add MG to Watchlist: View: Get Complete MG Trend Analysis ➞ | |
 | DSP Viant Technology Inc. |
| Sector: Technology | |
| SubSector: Software - Application | |
| MarketCap: 279 Millions | |
| Recent Price: 8.25 Smart Investing & Trading Score: 38 | |
| Day Percent Change: -3.73% Day Change: -0.32 | |
| Week Change: -2.94% Year-to-date Change: 18.9% | |
| DSP Links: Profile News Message Board | |
| Charts:- Daily , Weekly | |
| Add DSP to Watchlist: View: Get Complete DSP Trend Analysis ➞ | |
 | AMLX Amylyx Pharmaceuticals, Inc. |
| Sector: Health Care | |
| SubSector: Biotechnology | |
| MarketCap: 1500 Millions | |
| Recent Price: 1.81 Smart Investing & Trading Score: 30 | |
| Day Percent Change: -5.96% Day Change: -0.11 | |
| Week Change: -2.94% Year-to-date Change: -87.5% | |
| AMLX Links: Profile News Message Board | |
| Charts:- Daily , Weekly | |
| Add AMLX to Watchlist: View: Get Complete AMLX Trend Analysis ➞ | |
 | SRI Stoneridge, Inc. |
| Sector: Consumer Staples | |
| SubSector: Auto Parts | |
| MarketCap: 451.839 Millions | |
| Recent Price: 15.15 Smart Investing & Trading Score: 10 | |
| Day Percent Change: -0.66% Day Change: -0.10 | |
| Week Change: -2.95% Year-to-date Change: -22.6% | |
| SRI Links: Profile News Message Board | |
| Charts:- Daily , Weekly | |
| Add SRI to Watchlist: View: Get Complete SRI Trend Analysis ➞ | |
| For tabular summary view of above stock list: Summary View ➞ 0 - 25 , 25 - 50 , 50 - 75 , 75 - 100 , 100 - 125 , 125 - 150 , 150 - 175 , 175 - 200 , 200 - 225 , 225 - 250 , 250 - 275 , 275 - 300 , 300 - 325 , 325 - 350 , 350 - 375 , 375 - 400 , 400 - 425 , 425 - 450 , 450 - 475 , 475 - 500 , 500 - 525 , 525 - 550 , 550 - 575 , 575 - 600 , 600 - 625 , 625 - 650 , 650 - 675 , 675 - 700 , 700 - 725 , 725 - 750 , 750 - 775 , 775 - 800 , 800 - 825 , 825 - 850 , 850 - 875 , 875 - 900 , 900 - 925 , 925 - 950 , 950 - 975 , 975 - 1000 , 1000 - 1025 , 1025 - 1050 , 1050 - 1075 , 1075 - 1100 , 1100 - 1125 , 1125 - 1150 , 1150 - 1175 , 1175 - 1200 , 1200 - 1225 , 1225 - 1250 , 1250 - 1275 , 1275 - 1300 , 1300 - 1325 , 1325 - 1350 , 1350 - 1375 , 1375 - 1400 , 1400 - 1425 , 1425 - 1450 , 1450 - 1475 , 1475 - 1500 , 1500 - 1525 , 1525 - 1550 , 1550 - 1575 , 1575 - 1600 | ||
| Click To Change The Sort Order: By Market Cap or Company Size Performance: Year-to-date, Week and Day | |
| Select Chart Type: | ||
| Too many stocks? View smallcap stocks filtered by marketcap & sector |
| Marketcap: All SmallCap Stocks (default-no microcap), Large, Mid-Range, Small & MicroCap |
| Sector: Tech, Finance, Energy, Staples, Retail, Industrial, Materials, Utilities & Medical |
|
Best Stocks Today 12Stocks.com |
© 2024 12Stocks.com Terms & Conditions Privacy Contact Us
All Information Provided Only For Education And Not To Be Used For Investing or Trading. See Terms & Conditions


One More Thing ... Get Best Stocks Delivered Daily!
Never Ever Miss A Move With Our Top Ten Stocks Lists
Find Best Stocks In Any Market - Bull or Bear Market
Take A Peek At Our Top Ten Stocks Lists: Daily, Weekly, Year-to-Date & Top Trends
Find Best Stocks In Any Market - Bull or Bear Market
Take A Peek At Our Top Ten Stocks Lists: Daily, Weekly, Year-to-Date & Top Trends
Smallcap Stocks With Best Up Trends [0-bearish to 100-bullish]: Ribbon [100], Diodes [100], Trustmark [100], Sanmina [100], California Water[100], NextNav [100], B. Riley[100], Third Coast[100], Northwest Natural[100], LCNB [100], Agios [100]
Best Smallcap Stocks Year-to-Date:
CareMax [572.16%], Janux [333.88%], Alpine Immune[239.52%], Longboard [218%], Super Micro[170.84%], Avidity Biosciences[159.79%], Arcutis Bio[156.19%], Vera [154.33%], Hippo [126.07%], Y-mAbs [121.85%], Stoke [115.78%] Best Smallcap Stocks This Week:
Matterport [168.39%], B. Riley[49.67%], Seres [38.35%], Ribbon [30.81%], CareMax [26.85%], ProKidney [25.74%], Riot Blockchain[25.19%], Impinj [22.93%], Cullinan Oncology[21.1%], Hibbett Sports[21%], OptiNose [18.42%] Best Smallcap Stocks Daily:
Impinj [18.26%], OptiNose [14.56%], Strategic Education[12.22%], Red Robin[8.77%], Sonic Automotive[8.63%], Intevac [7.97%], JELD-WEN Holding[7.31%], Zura Bio[6.75%], Community Health[6.44%], Seres [6.18%], Vicor [5.49%]