
 Login Sign Up


| |||||
 |  | ||||

| 12Stocks.com Market Intelligence |
Best SmallCap Stocks
|
| In a hurry? Small Cap Stock Lists: Performance Trends Table, Stock Charts
Sort Small Cap stocks: Daily, Weekly, Year-to-Date, Market Cap & Trends. Filter Small Cap stocks list by sector: Show all, Tech, Finance, Energy, Staples, Retail, Industrial, Materials, Utilities and HealthCare Filter Small Cap stocks list by size: All Large Medium Small and MicroCap |
| 12Stocks.com Small Cap Stocks Performances & Trends Daily | |||||||||
|
|  The overall Smart Investing & Trading Score is 31 (0-bearish to 100-bullish) which puts Small Cap index in short term bearish to neutral trend. The Smart Investing & Trading Score from previous trading session is 23 and hence an improvement of trend.
| ||||||||
Here are the Smart Investing & Trading Scores of the most requested small cap stocks at 12Stocks.com (click stock name for detailed review):
|


| 12Stocks.com: Investing in Smallcap Index with Stocks | |
|
The following table helps investors and traders sort through current performance and trends (as measured by Smart Investing & Trading Score) of various
stocks in the Smallcap Index. Quick View: Move mouse or cursor over stock symbol (ticker) to view short-term technical chart and over stock name to view long term chart. Click on  to add stock symbol to your watchlist and to add stock symbol to your watchlist and  to view watchlist. Click on any ticker or stock name for detailed market intelligence report for that stock. to view watchlist. Click on any ticker or stock name for detailed market intelligence report for that stock. |
12Stocks.com Performance of Stocks in Smallcap Index
| Ticker | Stock Name | Watchlist | Category | Recent Price | Smart Investing & Trading Score | Change % | Weekly Change% |
| ESCA | Escalade |   | Consumer Staples | 13.61 | 32 | -0.87% | 5.42% |
| AIR | AAR | | Industrials | 64.05 | 90 | 1.62% | 5.36% |
| AMSF | Amerisafe | | Financials | 50.25 | 80 | 0.48% | 5.21% |
| MWA | Mueller Water | | Industrials | 15.96 | 80 | 0.41% | 5.17% |
| SNCY | Sun Country | | Industrials | 14.98 | 71 | -0.73% | 5.05% |
| BTU | Peabody Energy | | Materials | 24.25 | 42 | 0.66% | 5.02% |
| HMN | Horace Mann | | Financials | 35.86 | 37 | 1.30% | 5.01% |
| EE | Excelerate Energy | | Utilities | 16.06 | 68 | 3.38% | 5.00% |
| ULCC | Frontier Group | | Industrials | 7.05 | 61 | -1.54% | 4.99% |
| SPTN | SpartanNash | | Consumer Staples | 19.66 | 59 | 2.29% | 4.97% |
| GCBC | Greene County | | Financials | 27.89 | 71 | 1.79% | 4.97% |
| POR | Portland General | | Utilities | 42.50 | 86 | 1.82% | 4.78% |
| TRC | Tejon Ranch | | Financials | 15.91 | 87 | 1.43% | 4.70% |
| DBI | Designer Brands | | Services & Goods | 8.67 | 38 | 1.88% | 4.58% |
| SSBK | Southern States | | Financials | 24.45 | 42 | 2.95% | 4.53% |
| ARCH | Arch Coal | | Materials | 163.93 | 45 | 0.68% | 4.49% |
| SNBR | Sleep Number | | Consumer Staples | 13.54 | 53 | 1.96% | 4.48% |
| OSBC | Old Second | | Financials | 14.02 | 93 | 2.04% | 4.47% |
| IMAX | IMAX | | Services & Goods | 17.15 | 100 | 0.23% | 4.38% |
| LNTH | Lantheus | | Health Care | 63.41 | 93 | 1.73% | 4.31% |
| YMAB | Y-mAbs | | Health Care | 14.99 | 56 | -0.07% | 4.31% |
| SFST | Southern First | | Financials | 27.70 | 42 | 1.61% | 4.29% |
| INNV | InnovAge Holding | | Health Care | 4.08 | 20 | 0.62% | 4.22% |
| CGEM | Cullinan Oncology | | Health Care | 17.36 | 93 | -8.53% | 4.17% |
| BH | Biglari | | Services & Goods | 198.99 | 83 | 1.23% | 4.15% |
| For chart view version of above stock list: Chart View ➞ 0 - 25 , 25 - 50 , 50 - 75 , 75 - 100 , 100 - 125 , 125 - 150 , 150 - 175 , 175 - 200 , 200 - 225 , 225 - 250 , 250 - 275 , 275 - 300 , 300 - 325 , 325 - 350 , 350 - 375 , 375 - 400 , 400 - 425 , 425 - 450 , 450 - 475 , 475 - 500 , 500 - 525 , 525 - 550 , 550 - 575 , 575 - 600 , 600 - 625 , 625 - 650 , 650 - 675 , 675 - 700 , 700 - 725 , 725 - 750 , 750 - 775 , 775 - 800 , 800 - 825 , 825 - 850 , 850 - 875 , 875 - 900 , 900 - 925 , 925 - 950 , 950 - 975 , 975 - 1000 , 1000 - 1025 , 1025 - 1050 , 1050 - 1075 , 1075 - 1100 , 1100 - 1125 , 1125 - 1150 , 1150 - 1175 , 1175 - 1200 , 1200 - 1225 , 1225 - 1250 , 1250 - 1275 , 1275 - 1300 , 1300 - 1325 , 1325 - 1350 , 1350 - 1375 , 1375 - 1400 , 1400 - 1425 , 1425 - 1450 , 1450 - 1475 , 1475 - 1500 , 1500 - 1525 , 1525 - 1550 , 1550 - 1575 , 1575 - 1600 , 1600 - 1625 | ||
 | Click To Change The Sort Order: By Market Cap or Company Size Performance: Year-to-date, Week and Day |  |
| Too many stocks? View smallcap stocks filtered by marketcap & sector |
| Marketcap: All SmallCap Stocks (default-no microcap), Large, Mid-Range, Small |
| Smallcap Sector: Tech, Finance, Energy, Staples, Retail, Industrial, Materials, & Medical |
|
Get the most comprehensive stock market coverage daily at 12Stocks.com ➞ Best Stocks Today ➞ Best Stocks Weekly ➞ Best Stocks Year-to-Date ➞ Best Stocks Trends ➞  Best Stocks Today 12Stocks.com Best Nasdaq Stocks ➞ Best S&P 500 Stocks ➞ Best Tech Stocks ➞ Best Biotech Stocks ➞ |
| Detailed Overview of SmallCap Stocks |
| SmallCap Technical Overview, Leaders & Laggards, Top SmallCap ETF Funds & Detailed SmallCap Stocks List, Charts, Trends & More |
| Smallcap: Technical Analysis, Trends & YTD Performance | |
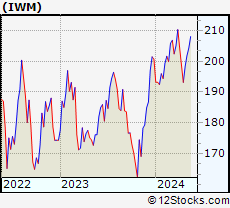
| SmallCap segment as represented by
IWM, an exchange-traded fund [ETF], holds basket of thousands of smallcap stocks from across all major sectors of the US stock market. The smallcap index (contains stocks like Riverbed & Sotheby's) is down by -3.67% and is currently underperforming the overall market by -7.75% year-to-date. Below is a quick view of technical charts and trends: | |
 IWM Weekly Chart |
|
| Long Term Trend: Good | |
| Medium Term Trend: Not Good | |
 IWM Daily Chart |
|
| Short Term Trend: Deteriorating | |
| Overall Trend Score: 31 | |
| YTD Performance: -3.67% | |
| **Trend Scores & Views Are Only For Educational Purposes And Not For Investing | |
| 12Stocks.com: Top Performing Small Cap Index Stocks | ||||||||||||||||||||||||||||||||||||||||||||||||
 The top performing Small Cap Index stocks year to date are
Now, more recently, over last week, the top performing Small Cap Index stocks on the move are


|
||||||||||||||||||||||||||||||||||||||||||||||||
| 12Stocks.com: Investing in Smallcap Index using Exchange Traded Funds | |
|
The following table shows list of key exchange traded funds (ETF) that
help investors track Smallcap index. The following list also includes leveraged ETF funds that track twice or thrice the daily returns of Smallcap indices. Short or inverse ETF funds move in the opposite direction to the index they track and are useful during market pullbacks or during bear markets. Quick View: Move mouse or cursor over ETF symbol (ticker) to view short-term technical chart and over ETF name to view long term chart. Click on ticker or stock name for detailed view. Click on to add stock symbol to your watchlist and to view watchlist. |
12Stocks.com List of ETFs that track Smallcap Index
| Ticker | ETF Name | Watchlist | Recent Price | Smart Investing & Trading Score | Change % | Week % | Year-to-date % |
| IWM | iShares Russell 2000 | | 193.34 | 31 | 0.26 | -2.69 | -3.67% |
| SAA | ProShares Ultra SmallCap600 | | 21.83 | 10 | 0.97 | -3.24 | -12.51% |
| SDD | ProShares UltraShort SmallCap600 | | 20.42 | 88 | -1.30 | 2.97 | 10.82% |
| SMLV | SPDR SSGA US Small Cap Low Volatil ETF | | 105.38 | 10 | 1.49 | 0.35 | -6.35% |
| SBB | ProShares Short SmallCap600 | | 16.80 | 93 | -1.08 | 1.51 | 5.44% |
| 12Stocks.com: Charts, Trends, Fundamental Data and Performances of SmallCap Stocks | |
|
We now take in-depth look at all SmallCap stocks including charts, multi-period performances and overall trends (as measured by Smart Investing & Trading Score). One can sort SmallCap stocks (click link to choose) by Daily, Weekly and by Year-to-Date performances. Also, one can sort by size of the company or by market capitalization. |
| Select Your Default Chart Type: | |||||
| |||||
| Click on stock symbol or name for detailed view. Click on to add stock symbol to your watchlist and to view watchlist. Quick View: Move mouse or cursor over "Daily" to quickly view daily technical stock chart and over "Weekly" to view weekly technical stock chart. | |||||

 | ESCA Escalade, Incorporated |
| Sector: Consumer Staples | |
| SubSector: Sporting Goods | |
| MarketCap: 87.8144 Millions | |
| Recent Price: 13.61 Smart Investing & Trading Score: 32 | |
| Day Percent Change: -0.87% Day Change: -0.12 | |
| Week Change: 5.42% Year-to-date Change: -32.3% | |
| ESCA Links: Profile News Message Board | |
| Charts:- Daily , Weekly | |
| Add ESCA to Watchlist: View: Get Complete ESCA Trend Analysis ➞ | |
 | AIR AAR Corp. |
| Sector: Industrials | |
| SubSector: Aerospace/Defense Products & Services | |
| MarketCap: 591.701 Millions | |
| Recent Price: 64.05 Smart Investing & Trading Score: 90 | |
| Day Percent Change: 1.62% Day Change: 1.02 | |
| Week Change: 5.36% Year-to-date Change: 2.6% | |
| AIR Links: Profile News Message Board | |
| Charts:- Daily , Weekly | |
| Add AIR to Watchlist: View: Get Complete AIR Trend Analysis ➞ | |
 | AMSF Amerisafe, Inc. |
| Sector: Financials | |
| SubSector: Property & Casualty Insurance | |
| MarketCap: 1159.32 Millions | |
| Recent Price: 50.25 Smart Investing & Trading Score: 80 | |
| Day Percent Change: 0.48% Day Change: 0.24 | |
| Week Change: 5.21% Year-to-date Change: 7.4% | |
| AMSF Links: Profile News Message Board | |
| Charts:- Daily , Weekly | |
| Add AMSF to Watchlist: View: Get Complete AMSF Trend Analysis ➞ | |
 | MWA Mueller Water Products, Inc. |
| Sector: Industrials | |
| SubSector: Industrial Equipment & Components | |
| MarketCap: 1321.09 Millions | |
| Recent Price: 15.96 Smart Investing & Trading Score: 80 | |
| Day Percent Change: 0.41% Day Change: 0.06 | |
| Week Change: 5.17% Year-to-date Change: 10.8% | |
| MWA Links: Profile News Message Board | |
| Charts:- Daily , Weekly | |
| Add MWA to Watchlist: View: Get Complete MWA Trend Analysis ➞ | |
 | SNCY Sun Country Airlines Holdings, Inc. |
| Sector: Industrials | |
| SubSector: Airlines | |
| MarketCap: 1230 Millions | |
| Recent Price: 14.98 Smart Investing & Trading Score: 71 | |
| Day Percent Change: -0.73% Day Change: -0.11 | |
| Week Change: 5.05% Year-to-date Change: -5.3% | |
| SNCY Links: Profile News Message Board | |
| Charts:- Daily , Weekly | |
| Add SNCY to Watchlist: View: Get Complete SNCY Trend Analysis ➞ | |
 | BTU Peabody Energy Corporation |
| Sector: Materials | |
| SubSector: Industrial Metals & Minerals | |
| MarketCap: 355.11 Millions | |
| Recent Price: 24.25 Smart Investing & Trading Score: 42 | |
| Day Percent Change: 0.66% Day Change: 0.16 | |
| Week Change: 5.02% Year-to-date Change: -0.3% | |
| BTU Links: Profile News Message Board | |
| Charts:- Daily , Weekly | |
| Add BTU to Watchlist: View: Get Complete BTU Trend Analysis ➞ | |
 | HMN Horace Mann Educators Corporation |
| Sector: Financials | |
| SubSector: Property & Casualty Insurance | |
| MarketCap: 1545.52 Millions | |
| Recent Price: 35.86 Smart Investing & Trading Score: 37 | |
| Day Percent Change: 1.30% Day Change: 0.46 | |
| Week Change: 5.01% Year-to-date Change: 9.7% | |
| HMN Links: Profile News Message Board | |
| Charts:- Daily , Weekly | |
| Add HMN to Watchlist: View: Get Complete HMN Trend Analysis ➞ | |
 | EE Excelerate Energy, Inc. |
| Sector: Utilities | |
| SubSector: Utilities - Renewable | |
| MarketCap: 2140 Millions | |
| Recent Price: 16.06 Smart Investing & Trading Score: 68 | |
| Day Percent Change: 3.38% Day Change: 0.53 | |
| Week Change: 5% Year-to-date Change: 3.2% | |
| EE Links: Profile News Message Board | |
| Charts:- Daily , Weekly | |
| Add EE to Watchlist: View: Get Complete EE Trend Analysis ➞ | |
 | ULCC Frontier Group Holdings, Inc. |
| Sector: Industrials | |
| SubSector: Airlines | |
| MarketCap: 2160 Millions | |
| Recent Price: 7.05 Smart Investing & Trading Score: 61 | |
| Day Percent Change: -1.54% Day Change: -0.11 | |
| Week Change: 4.99% Year-to-date Change: 29.9% | |
| ULCC Links: Profile News Message Board | |
| Charts:- Daily , Weekly | |
| Add ULCC to Watchlist: View: Get Complete ULCC Trend Analysis ➞ | |
 | SPTN SpartanNash Company |
| Sector: Consumer Staples | |
| SubSector: Food Wholesale | |
| MarketCap: 671.229 Millions | |
| Recent Price: 19.66 Smart Investing & Trading Score: 59 | |
| Day Percent Change: 2.29% Day Change: 0.44 | |
| Week Change: 4.97% Year-to-date Change: -14.3% | |
| SPTN Links: Profile News Message Board | |
| Charts:- Daily , Weekly | |
| Add SPTN to Watchlist: View: Get Complete SPTN Trend Analysis ➞ | |
 | GCBC Greene County Bancorp, Inc. |
| Sector: Financials | |
| SubSector: Savings & Loans | |
| MarketCap: 314.83 Millions | |
| Recent Price: 27.89 Smart Investing & Trading Score: 71 | |
| Day Percent Change: 1.79% Day Change: 0.49 | |
| Week Change: 4.97% Year-to-date Change: -1.1% | |
| GCBC Links: Profile News Message Board | |
| Charts:- Daily , Weekly | |
| Add GCBC to Watchlist: View: Get Complete GCBC Trend Analysis ➞ | |
 | POR Portland General Electric Company |
| Sector: Utilities | |
| SubSector: Electric Utilities | |
| MarketCap: 4291.84 Millions | |
| Recent Price: 42.50 Smart Investing & Trading Score: 86 | |
| Day Percent Change: 1.82% Day Change: 0.76 | |
| Week Change: 4.78% Year-to-date Change: -1.9% | |
| POR Links: Profile News Message Board | |
| Charts:- Daily , Weekly | |
| Add POR to Watchlist: View: Get Complete POR Trend Analysis ➞ | |
 | TRC Tejon Ranch Co. |
| Sector: Financials | |
| SubSector: Property Management | |
| MarketCap: 346.442 Millions | |
| Recent Price: 15.91 Smart Investing & Trading Score: 87 | |
| Day Percent Change: 1.43% Day Change: 0.22 | |
| Week Change: 4.7% Year-to-date Change: -7.5% | |
| TRC Links: Profile News Message Board | |
| Charts:- Daily , Weekly | |
| Add TRC to Watchlist: View: Get Complete TRC Trend Analysis ➞ | |
 | DBI Designer Brands Inc. |
| Sector: Services & Goods | |
| SubSector: Apparel Stores | |
| MarketCap: 467.308 Millions | |
| Recent Price: 8.67 Smart Investing & Trading Score: 38 | |
| Day Percent Change: 1.88% Day Change: 0.16 | |
| Week Change: 4.58% Year-to-date Change: -2.0% | |
| DBI Links: Profile News Message Board | |
| Charts:- Daily , Weekly | |
| Add DBI to Watchlist: View: Get Complete DBI Trend Analysis ➞ | |
 | SSBK Southern States Bancshares, Inc. |
| Sector: Financials | |
| SubSector: Banks - Regional | |
| MarketCap: 187 Millions | |
| Recent Price: 24.45 Smart Investing & Trading Score: 42 | |
| Day Percent Change: 2.95% Day Change: 0.70 | |
| Week Change: 4.53% Year-to-date Change: -17.0% | |
| SSBK Links: Profile News Message Board | |
| Charts:- Daily , Weekly | |
| Add SSBK to Watchlist: View: Get Complete SSBK Trend Analysis ➞ | |
 | ARCH Arch Coal, Inc. |
| Sector: Materials | |
| SubSector: Industrial Metals & Minerals | |
| MarketCap: 547.21 Millions | |
| Recent Price: 163.93 Smart Investing & Trading Score: 45 | |
| Day Percent Change: 0.68% Day Change: 1.11 | |
| Week Change: 4.49% Year-to-date Change: -1.2% | |
| ARCH Links: Profile News Message Board | |
| Charts:- Daily , Weekly | |
| Add ARCH to Watchlist: View: Get Complete ARCH Trend Analysis ➞ | |
 | SNBR Sleep Number Corporation |
| Sector: Consumer Staples | |
| SubSector: Home Furnishings & Fixtures | |
| MarketCap: 692.735 Millions | |
| Recent Price: 13.54 Smart Investing & Trading Score: 53 | |
| Day Percent Change: 1.96% Day Change: 0.26 | |
| Week Change: 4.48% Year-to-date Change: -8.7% | |
| SNBR Links: Profile News Message Board | |
| Charts:- Daily , Weekly | |
| Add SNBR to Watchlist: View: Get Complete SNBR Trend Analysis ➞ | |
 | OSBC Old Second Bancorp, Inc. |
| Sector: Financials | |
| SubSector: Regional - Midwest Banks | |
| MarketCap: 237.17 Millions | |
| Recent Price: 14.02 Smart Investing & Trading Score: 93 | |
| Day Percent Change: 2.04% Day Change: 0.28 | |
| Week Change: 4.47% Year-to-date Change: -9.2% | |
| OSBC Links: Profile News Message Board | |
| Charts:- Daily , Weekly | |
| Add OSBC to Watchlist: View: Get Complete OSBC Trend Analysis ➞ | |
 | IMAX IMAX Corporation |
| Sector: Services & Goods | |
| SubSector: Entertainment - Diversified | |
| MarketCap: 874.237 Millions | |
| Recent Price: 17.15 Smart Investing & Trading Score: 100 | |
| Day Percent Change: 0.23% Day Change: 0.04 | |
| Week Change: 4.38% Year-to-date Change: 14.2% | |
| IMAX Links: Profile News Message Board | |
| Charts:- Daily , Weekly | |
| Add IMAX to Watchlist: View: Get Complete IMAX Trend Analysis ➞ | |
 | LNTH Lantheus Holdings, Inc. |
| Sector: Health Care | |
| SubSector: Medical Appliances & Equipment | |
| MarketCap: 467.18 Millions | |
| Recent Price: 63.41 Smart Investing & Trading Score: 93 | |
| Day Percent Change: 1.73% Day Change: 1.08 | |
| Week Change: 4.31% Year-to-date Change: 2.3% | |
| LNTH Links: Profile News Message Board | |
| Charts:- Daily , Weekly | |
| Add LNTH to Watchlist: View: Get Complete LNTH Trend Analysis ➞ | |
 | YMAB Y-mAbs Therapeutics, Inc. |
| Sector: Health Care | |
| SubSector: Biotechnology | |
| MarketCap: 899.585 Millions | |
| Recent Price: 14.99 Smart Investing & Trading Score: 56 | |
| Day Percent Change: -0.07% Day Change: -0.01 | |
| Week Change: 4.31% Year-to-date Change: 119.8% | |
| YMAB Links: Profile News Message Board | |
| Charts:- Daily , Weekly | |
| Add YMAB to Watchlist: View: Get Complete YMAB Trend Analysis ➞ | |
 | SFST Southern First Bancshares, Inc. |
| Sector: Financials | |
| SubSector: Money Center Banks | |
| MarketCap: 189.099 Millions | |
| Recent Price: 27.70 Smart Investing & Trading Score: 42 | |
| Day Percent Change: 1.61% Day Change: 0.44 | |
| Week Change: 4.29% Year-to-date Change: -25.3% | |
| SFST Links: Profile News Message Board | |
| Charts:- Daily , Weekly | |
| Add SFST to Watchlist: View: Get Complete SFST Trend Analysis ➞ | |
 | INNV InnovAge Holding Corp. |
| Sector: Health Care | |
| SubSector: Medical Care Facilities | |
| MarketCap: 1010 Millions | |
| Recent Price: 4.08 Smart Investing & Trading Score: 20 | |
| Day Percent Change: 0.62% Day Change: 0.03 | |
| Week Change: 4.22% Year-to-date Change: -28.5% | |
| INNV Links: Profile News Message Board | |
| Charts:- Daily , Weekly | |
| Add INNV to Watchlist: View: Get Complete INNV Trend Analysis ➞ | |
 | CGEM Cullinan Oncology, Inc. |
| Sector: Health Care | |
| SubSector: Biotechnology | |
| MarketCap: 433 Millions | |
| Recent Price: 17.36 Smart Investing & Trading Score: 93 | |
| Day Percent Change: -8.53% Day Change: -1.62 | |
| Week Change: 4.17% Year-to-date Change: 70.3% | |
| CGEM Links: Profile News Message Board | |
| Charts:- Daily , Weekly | |
| Add CGEM to Watchlist: View: Get Complete CGEM Trend Analysis ➞ | |
 | BH Biglari Holdings Inc. |
| Sector: Services & Goods | |
| SubSector: Restaurants | |
| MarketCap: 149.07 Millions | |
| Recent Price: 198.99 Smart Investing & Trading Score: 83 | |
| Day Percent Change: 1.23% Day Change: 2.42 | |
| Week Change: 4.15% Year-to-date Change: 20.7% | |
| BH Links: Profile News Message Board | |
| Charts:- Daily , Weekly | |
| Add BH to Watchlist: View: Get Complete BH Trend Analysis ➞ | |
| Too many stocks? View smallcap stocks filtered by marketcap & sector |
| Marketcap: All SmallCap Stocks (default-no microcap), Large, Mid-Range, Small & MicroCap |
| Sector: Tech, Finance, Energy, Staples, Retail, Industrial, Materials, Utilities & Medical |
|
Best Stocks Today 12Stocks.com |
© 2024 12Stocks.com Terms & Conditions Privacy Contact Us
All Information Provided Only For Education And Not To Be Used For Investing or Trading. See Terms & Conditions


One More Thing ... Get Best Stocks Delivered Daily!
Never Ever Miss A Move With Our Top Ten Stocks Lists
Find Best Stocks In Any Market - Bull or Bear Market
Take A Peek At Our Top Ten Stocks Lists: Daily, Weekly, Year-to-Date & Top Trends
Find Best Stocks In Any Market - Bull or Bear Market
Take A Peek At Our Top Ten Stocks Lists: Daily, Weekly, Year-to-Date & Top Trends
Smallcap Stocks With Best Up Trends [0-bearish to 100-bullish]: Victory Capital[100], Oscar Health[100], Mercury General[100], Badger Meter[100], Macatawa Bank[100], IMAX [100], EchoStar [100], NextNav [100], ALX Oncology[95], Geron [95], Angel Oak[95]
Best Smallcap Stocks Year-to-Date:
Agenus [581.24%], CareMax [456.7%], Janux [343.37%], Alpine Immune[238.42%], Longboard [194.11%], Arcutis Bio[184.06%], Super Micro[176.22%], Avidity Biosciences[153.65%], Vera [147.87%], Hippo [123.38%], Stoke [121.48%] Best Smallcap Stocks This Week:
Macatawa Bank[44.89%], Humacyte [39.24%], ProKidney [37.43%], Snap One[29.79%], ALX Oncology[22.49%], 23andMe Holding[22.09%], Vanda [21.12%], ContextLogic [20%], Badger Meter[17.13%], Oscar Health[15.4%], Accolade [13.45%] Best Smallcap Stocks Daily:
Humacyte [23.57%], Metropolitan Bank[17.73%], Agenus [13.48%], Origin Materials[11.12%], Chemung Financial[9.48%], Pacific Biosciences[8.56%], Cohen & Steers[8.35%], Urban One[8.21%], Riot Blockchain[7.84%], Bar Harbor[7.71%], CareMax [7.57%]