
 Login Sign Up


| |||||
 |  | ||||

| 12Stocks.com Market Intelligence |
Best SmallCap Stocks
|
| In a hurry? Small Cap Stock Lists: Performance Trends Table, Stock Charts
Sort Small Cap stocks: Daily, Weekly, Year-to-Date, Market Cap & Trends. Filter Small Cap stocks list by sector: Show all, Tech, Finance, Energy, Staples, Retail, Industrial, Materials, Utilities and HealthCare Filter Small Cap stocks list by size: All Large Medium Small and MicroCap |
| 12Stocks.com Small Cap Stocks Performances & Trends Daily | |||||||||
|
|  The overall Smart Investing & Trading Score is 70 (0-bearish to 100-bullish) which puts Small Cap index in short term neutral to bullish trend. The Smart Investing & Trading Score from previous trading session is 87 and hence a deterioration of trend.
| ||||||||
Here are the Smart Investing & Trading Scores of the most requested small cap stocks at 12Stocks.com (click stock name for detailed review):
|


| 12Stocks.com: Investing in Smallcap Index with Stocks | |
|
The following table helps investors and traders sort through current performance and trends (as measured by Smart Investing & Trading Score) of various
stocks in the Smallcap Index. Quick View: Move mouse or cursor over stock symbol (ticker) to view short-term technical chart and over stock name to view long term chart. Click on  to add stock symbol to your watchlist and to add stock symbol to your watchlist and  to view watchlist. Click on any ticker or stock name for detailed market intelligence report for that stock. to view watchlist. Click on any ticker or stock name for detailed market intelligence report for that stock. |
12Stocks.com Performance of Stocks in Smallcap Index
| Ticker | Stock Name | Watchlist | Category | Recent Price | Smart Investing & Trading Score | Change % | YTD Change% |
| BMEA | Biomea Fusion |   | Health Care | 11.07 | 52 | -7.79 | -24.42% |
| ALXO | ALX Oncology | | Health Care | 16.18 | 78 | -7.86 | 8.74% |
| PCT | PureCycle | | Industrials | 4.62 | 10 | -7.97 | 13.93% |
| RRR | Red Rock | | Transports | 50.01 | 0 | -8.00 | -6.23% |
| BHIL | Benson Hill | | Materials | 0.20 | 47 | -8.12 | 14.68% |
| CARA | Cara | | Health Care | 0.73 | 57 | -8.20 | -2.13% |
| ARDX | Ardelyx | | Health Care | 8.54 | 67 | -8.27 | 37.74% |
| MAXN | Maxeon Solar | | Technology | 2.09 | 60 | -8.33 | -70.89% |
| VPG | Vishay Precision | | Technology | 30.66 | 25 | -8.56 | -10.01% |
| EVEX | Eve Holding | | Industrials | 5.10 | 17 | -8.60 | -30.71% |
| QTRX | Quanterix | | Health Care | 15.88 | 57 | -8.66 | -41.93% |
| NVCT | Nuvectis Pharma | | Health Care | 6.57 | 17 | -8.69 | -20.62% |
| MAX | MediaAlpha | | Technology | 20.18 | 20 | -8.99 | 81.52% |
| GPMT | Granite Point | | Financials | 3.98 | 35 | -9.02 | -32.91% |
| FTCI | FTC Solar | | Technology | 0.52 | 63 | -9.23 | -24.62% |
| VAXX | Vaxxinity | | Health Care | 0.12 | 10 | -9.61 | -85.89% |
| MGNX | MacroGenics | | Health Care | 14.49 | 62 | -9.69 | 50.68% |
| PACB | Pacific Biosciences | | Health Care | 1.69 | 52 | -9.89 | -82.82% |
| ANDE | Andersons | | Consumer Staples | 50.56 | 0 | -9.94 | -12.13% |
| TRVI | Trevi | | Health Care | 2.62 | 5 | -9.97 | 95.52% |
| CDRE | Cadre | | Industrials | 30.91 | 50 | -10.01 | -6.25% |
| SCLX | Scilex Holding | | Health Care | 0.82 | 50 | -10.15 | -57.95% |
| NVRO | Nevro | | Health Care | 10.36 | 5 | -10.19 | -51.88% |
| QLYS | Qualys | | Technology | 148.87 | 0 | -10.31 | -24.15% |
| MPLN | MultiPlan | | Health Care | 0.58 | 10 | -10.48 | -59.58% |


| Too many stocks? View smallcap stocks filtered by marketcap & sector |
| Marketcap: All SmallCap Stocks (default-no microcap), Large, Mid-Range, Small |
| Smallcap Sector: Tech, Finance, Energy, Staples, Retail, Industrial, Materials, & Medical |
|
Get the most comprehensive stock market coverage daily at 12Stocks.com ➞ Best Stocks Today ➞ Best Stocks Weekly ➞ Best Stocks Year-to-Date ➞ Best Stocks Trends ➞  Best Stocks Today 12Stocks.com Best Nasdaq Stocks ➞ Best S&P 500 Stocks ➞ Best Tech Stocks ➞ Best Biotech Stocks ➞ |
| Detailed Overview of SmallCap Stocks |
| SmallCap Technical Overview, Leaders & Laggards, Top SmallCap ETF Funds & Detailed SmallCap Stocks List, Charts, Trends & More |
| Smallcap: Technical Analysis, Trends & YTD Performance | |
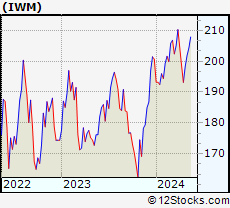
| SmallCap segment as represented by
IWM, an exchange-traded fund [ETF], holds basket of thousands of smallcap stocks from across all major sectors of the US stock market. The smallcap index (contains stocks like Riverbed & Sotheby's) is up by 1.45% and is currently underperforming the overall market by -6.57% year-to-date. Below is a quick view of technical charts and trends: | |
 IWM Weekly Chart |
|
| Long Term Trend: Deteriorating | |
| Medium Term Trend: Very Good | |
 IWM Daily Chart |
|
| Short Term Trend: Good | |
| Overall Trend Score: 70 | |
| YTD Performance: 1.45% | |
| **Trend Scores & Views Are Only For Educational Purposes And Not For Investing | |
| 12Stocks.com: Top Performing Small Cap Index Stocks | ||||||||||||||||||||||||||||||||||||||||||||||||
 The top performing Small Cap Index stocks year to date are
Now, more recently, over last week, the top performing Small Cap Index stocks on the move are


|
||||||||||||||||||||||||||||||||||||||||||||||||
| 12Stocks.com: Investing in Smallcap Index using Exchange Traded Funds | |
|
The following table shows list of key exchange traded funds (ETF) that
help investors track Smallcap index. The following list also includes leveraged ETF funds that track twice or thrice the daily returns of Smallcap indices. Short or inverse ETF funds move in the opposite direction to the index they track and are useful during market pullbacks or during bear markets. Quick View: Move mouse or cursor over ETF symbol (ticker) to view short-term technical chart and over ETF name to view long term chart. Click on ticker or stock name for detailed view. Click on to add stock symbol to your watchlist and to view watchlist. |
12Stocks.com List of ETFs that track Smallcap Index
| Ticker | ETF Name | Watchlist | Recent Price | Smart Investing & Trading Score | Change % | Week % | Year-to-date % |
| IWM | iShares Russell 2000 | | 203.62 | 70 | -0.66 | 0.85 | 1.45% |
| IJR | iShares Core S&P Small-Cap | | 108.15 | 58 | -0.44 | 0.95 | -0.1% |
| IWN | iShares Russell 2000 Value | | 155.08 | 76 | -0.35 | 0.56 | -0.16% |
| VTWO | Vanguard Russell 2000 ETF | | 82.27 | 57 | -0.69 | 0.81 | 1.44% |
| IWO | iShares Russell 2000 Growth | | 259.82 | 57 | -0.95 | 1.15 | 3.01% |
| IJS | iShares S&P Small-Cap 600 Value | | 99.06 | 40 | -0.62 | 0.34 | -3.89% |
| IJT | iShares S&P Small-Cap 600 Growth | | 128.54 | 71 | -1.00 | 0.61 | 2.72% |
| XSLV | PowerShares S&P SmallCap Low Volatil ETF | | 43.77 | 95 | -0.52 | 1.27 | -0.86% |
| SDD | ProShares UltraShort SmallCap600 | | 18.66 | 40 | 2.43 | -0.98 | 1.27% |
| SMLV | SPDR SSGA US Small Cap Low Volatil ETF | | 109.87 | 63 | -0.55 | 0.17 | -2.36% |
| SBB | ProShares Short SmallCap600 | | 16.11 | 25 | 0.91 | -0.28 | 1.16% |
| SAA | ProShares Ultra SmallCap600 | | 24.21 | 70 | -0.75 | 2.62 | -2.98% |
| 12Stocks.com: Charts, Trends, Fundamental Data and Performances of SmallCap Stocks | |
|
We now take in-depth look at all SmallCap stocks including charts, multi-period performances and overall trends (as measured by Smart Investing & Trading Score). One can sort SmallCap stocks (click link to choose) by Daily, Weekly and by Year-to-Date performances. Also, one can sort by size of the company or by market capitalization. |
| Select Your Default Chart Type: | |||||
| |||||
| Click on stock symbol or name for detailed view. Click on to add stock symbol to your watchlist and to view watchlist. Quick View: Move mouse or cursor over "Daily" to quickly view daily technical stock chart and over "Weekly" to view weekly technical stock chart. | |||||

 | BMEA Biomea Fusion, Inc. |
| Sector: Health Care | |
| SubSector: Biotechnology | |
| MarketCap: 818 Millions | |
| Recent Price: 11.07 Smart Investing & Trading Score: 52 | |
| Day Percent Change: -7.79% Day Change: -0.94 | |
| Week Change: -9.93% Year-to-date Change: -24.4% | |
| BMEA Links: Profile News Message Board | |
| Charts:- Daily , Weekly | |
| Add BMEA to Watchlist: View: Get Complete BMEA Trend Analysis ➞ | |
 | ALXO ALX Oncology Holdings Inc. |
| Sector: Health Care | |
| SubSector: Biotechnology | |
| MarketCap: 41787 Millions | |
| Recent Price: 16.18 Smart Investing & Trading Score: 78 | |
| Day Percent Change: -7.86% Day Change: -1.38 | |
| Week Change: 5.34% Year-to-date Change: 8.7% | |
| ALXO Links: Profile News Message Board | |
| Charts:- Daily , Weekly | |
| Add ALXO to Watchlist: View: Get Complete ALXO Trend Analysis ➞ | |
 | PCT PureCycle Technologies, Inc. |
| Sector: Industrials | |
| SubSector: Pollution & Treatment Controls | |
| MarketCap: 1610 Millions | |
| Recent Price: 4.62 Smart Investing & Trading Score: 10 | |
| Day Percent Change: -7.97% Day Change: -0.40 | |
| Week Change: -13.48% Year-to-date Change: 13.9% | |
| PCT Links: Profile News Message Board | |
| Charts:- Daily , Weekly | |
| Add PCT to Watchlist: View: Get Complete PCT Trend Analysis ➞ | |
 | RRR Red Rock Resorts, Inc. |
| Sector: Transports | |
| SubSector: Rental & Leasing Services | |
| MarketCap: 1144.04 Millions | |
| Recent Price: 50.01 Smart Investing & Trading Score: 0 | |
| Day Percent Change: -8.00% Day Change: -4.35 | |
| Week Change: -8.02% Year-to-date Change: -6.2% | |
| RRR Links: Profile News Message Board | |
| Charts:- Daily , Weekly | |
| Add RRR to Watchlist: View: Get Complete RRR Trend Analysis ➞ | |
 | BHIL Benson Hill, Inc. |
| Sector: Materials | |
| SubSector: Agricultural Inputs | |
| MarketCap: 236 Millions | |
| Recent Price: 0.20 Smart Investing & Trading Score: 47 | |
| Day Percent Change: -8.12% Day Change: -0.02 | |
| Week Change: 2.86% Year-to-date Change: 14.7% | |
| BHIL Links: Profile News Message Board | |
| Charts:- Daily , Weekly | |
| Add BHIL to Watchlist: View: Get Complete BHIL Trend Analysis ➞ | |
 | CARA Cara Therapeutics, Inc. |
| Sector: Health Care | |
| SubSector: Biotechnology | |
| MarketCap: 597.985 Millions | |
| Recent Price: 0.73 Smart Investing & Trading Score: 57 | |
| Day Percent Change: -8.20% Day Change: -0.07 | |
| Week Change: -6.55% Year-to-date Change: -2.1% | |
| CARA Links: Profile News Message Board | |
| Charts:- Daily , Weekly | |
| Add CARA to Watchlist: View: Get Complete CARA Trend Analysis ➞ | |
 | ARDX Ardelyx, Inc. |
| Sector: Health Care | |
| SubSector: Biotechnology | |
| MarketCap: 541.985 Millions | |
| Recent Price: 8.54 Smart Investing & Trading Score: 67 | |
| Day Percent Change: -8.27% Day Change: -0.77 | |
| Week Change: -2.06% Year-to-date Change: 37.7% | |
| ARDX Links: Profile News Message Board | |
| Charts:- Daily , Weekly | |
| Add ARDX to Watchlist: View: Get Complete ARDX Trend Analysis ➞ | |
 | MAXN Maxeon Solar Technologies, Ltd. |
| Sector: Technology | |
| SubSector: Solar | |
| MarketCap: 88787 Millions | |
| Recent Price: 2.09 Smart Investing & Trading Score: 60 | |
| Day Percent Change: -8.33% Day Change: -0.19 | |
| Week Change: -11.06% Year-to-date Change: -70.9% | |
| MAXN Links: Profile News Message Board | |
| Charts:- Daily , Weekly | |
| Add MAXN to Watchlist: View: Get Complete MAXN Trend Analysis ➞ | |
 | VPG Vishay Precision Group, Inc. |
| Sector: Technology | |
| SubSector: Scientific & Technical Instruments | |
| MarketCap: 261.553 Millions | |
| Recent Price: 30.66 Smart Investing & Trading Score: 25 | |
| Day Percent Change: -8.56% Day Change: -2.87 | |
| Week Change: -9.98% Year-to-date Change: -10.0% | |
| VPG Links: Profile News Message Board | |
| Charts:- Daily , Weekly | |
| Add VPG to Watchlist: View: Get Complete VPG Trend Analysis ➞ | |
 | EVEX Eve Holding, Inc. |
| Sector: Industrials | |
| SubSector: Aerospace & Defense | |
| MarketCap: 2830 Millions | |
| Recent Price: 5.10 Smart Investing & Trading Score: 17 | |
| Day Percent Change: -8.60% Day Change: -0.48 | |
| Week Change: -5.82% Year-to-date Change: -30.7% | |
| EVEX Links: Profile News Message Board | |
| Charts:- Daily , Weekly | |
| Add EVEX to Watchlist: View: Get Complete EVEX Trend Analysis ➞ | |
 | QTRX Quanterix Corporation |
| Sector: Health Care | |
| SubSector: Biotechnology | |
| MarketCap: 448.685 Millions | |
| Recent Price: 15.88 Smart Investing & Trading Score: 57 | |
| Day Percent Change: -8.66% Day Change: -1.50 | |
| Week Change: -6.73% Year-to-date Change: -41.9% | |
| QTRX Links: Profile News Message Board | |
| Charts:- Daily , Weekly | |
| Add QTRX to Watchlist: View: Get Complete QTRX Trend Analysis ➞ | |
 | NVCT Nuvectis Pharma, Inc. |
| Sector: Health Care | |
| SubSector: Biotechnology | |
| MarketCap: 258 Millions | |
| Recent Price: 6.57 Smart Investing & Trading Score: 17 | |
| Day Percent Change: -8.69% Day Change: -0.63 | |
| Week Change: -4.99% Year-to-date Change: -20.6% | |
| NVCT Links: Profile News Message Board | |
| Charts:- Daily , Weekly | |
| Add NVCT to Watchlist: View: Get Complete NVCT Trend Analysis ➞ | |
 | MAX MediaAlpha, Inc. |
| Sector: Technology | |
| SubSector: Internet Content & Information | |
| MarketCap: 22537 Millions | |
| Recent Price: 20.18 Smart Investing & Trading Score: 20 | |
| Day Percent Change: -8.99% Day Change: -2.00 | |
| Week Change: -9.08% Year-to-date Change: 81.5% | |
| MAX Links: Profile News Message Board | |
| Charts:- Daily , Weekly | |
| Add MAX to Watchlist: View: Get Complete MAX Trend Analysis ➞ | |
 | GPMT Granite Point Mortgage Trust Inc. |
| Sector: Financials | |
| SubSector: Mortgage Investment | |
| MarketCap: 289.739 Millions | |
| Recent Price: 3.98 Smart Investing & Trading Score: 35 | |
| Day Percent Change: -9.02% Day Change: -0.40 | |
| Week Change: -9.84% Year-to-date Change: -32.9% | |
| GPMT Links: Profile News Message Board | |
| Charts:- Daily , Weekly | |
| Add GPMT to Watchlist: View: Get Complete GPMT Trend Analysis ➞ | |
 | FTCI FTC Solar, Inc. |
| Sector: Technology | |
| SubSector: Solar | |
| MarketCap: 345 Millions | |
| Recent Price: 0.52 Smart Investing & Trading Score: 63 | |
| Day Percent Change: -9.23% Day Change: -0.05 | |
| Week Change: -8.24% Year-to-date Change: -24.6% | |
| FTCI Links: Profile News Message Board | |
| Charts:- Daily , Weekly | |
| Add FTCI to Watchlist: View: Get Complete FTCI Trend Analysis ➞ | |
 | VAXX Vaxxinity, Inc. |
| Sector: Health Care | |
| SubSector: Biotechnology | |
| MarketCap: 320 Millions | |
| Recent Price: 0.12 Smart Investing & Trading Score: 10 | |
| Day Percent Change: -9.61% Day Change: -0.01 | |
| Week Change: -6.69% Year-to-date Change: -85.9% | |
| VAXX Links: Profile News Message Board | |
| Charts:- Daily , Weekly | |
| Add VAXX to Watchlist: View: Get Complete VAXX Trend Analysis ➞ | |
 | MGNX MacroGenics, Inc. |
| Sector: Health Care | |
| SubSector: Biotechnology | |
| MarketCap: 262.785 Millions | |
| Recent Price: 14.49 Smart Investing & Trading Score: 62 | |
| Day Percent Change: -9.69% Day Change: -1.56 | |
| Week Change: -7.5% Year-to-date Change: 50.7% | |
| MGNX Links: Profile News Message Board | |
| Charts:- Daily , Weekly | |
| Add MGNX to Watchlist: View: Get Complete MGNX Trend Analysis ➞ | |
 | PACB Pacific Biosciences of California, Inc. |
| Sector: Health Care | |
| SubSector: Biotechnology | |
| MarketCap: 470.685 Millions | |
| Recent Price: 1.69 Smart Investing & Trading Score: 52 | |
| Day Percent Change: -9.89% Day Change: -0.19 | |
| Week Change: -7.92% Year-to-date Change: -82.8% | |
| PACB Links: Profile News Message Board | |
| Charts:- Daily , Weekly | |
| Add PACB to Watchlist: View: Get Complete PACB Trend Analysis ➞ | |
 | ANDE The Andersons, Inc. |
| Sector: Consumer Staples | |
| SubSector: Farm Products | |
| MarketCap: 630.887 Millions | |
| Recent Price: 50.56 Smart Investing & Trading Score: 0 | |
| Day Percent Change: -9.94% Day Change: -5.58 | |
| Week Change: -10.53% Year-to-date Change: -12.1% | |
| ANDE Links: Profile News Message Board | |
| Charts:- Daily , Weekly | |
| Add ANDE to Watchlist: View: Get Complete ANDE Trend Analysis ➞ | |
 | TRVI Trevi Therapeutics, Inc. |
| Sector: Health Care | |
| SubSector: Biotechnology | |
| MarketCap: 50.6785 Millions | |
| Recent Price: 2.62 Smart Investing & Trading Score: 5 | |
| Day Percent Change: -9.97% Day Change: -0.29 | |
| Week Change: -13.25% Year-to-date Change: 95.5% | |
| TRVI Links: Profile News Message Board | |
| Charts:- Daily , Weekly | |
| Add TRVI to Watchlist: View: Get Complete TRVI Trend Analysis ➞ | |
 | CDRE Cadre Holdings, Inc. |
| Sector: Industrials | |
| SubSector: Aerospace & Defense | |
| MarketCap: 817 Millions | |
| Recent Price: 30.91 Smart Investing & Trading Score: 50 | |
| Day Percent Change: -10.01% Day Change: -3.44 | |
| Week Change: -8.66% Year-to-date Change: -6.3% | |
| CDRE Links: Profile News Message Board | |
| Charts:- Daily , Weekly | |
| Add CDRE to Watchlist: View: Get Complete CDRE Trend Analysis ➞ | |
 | SCLX Scilex Holding Company |
| Sector: Health Care | |
| SubSector: Drug Manufacturers - General | |
| MarketCap: 927 Millions | |
| Recent Price: 0.82 Smart Investing & Trading Score: 50 | |
| Day Percent Change: -10.15% Day Change: -0.09 | |
| Week Change: -5.63% Year-to-date Change: -58.0% | |
| SCLX Links: Profile News Message Board | |
| Charts:- Daily , Weekly | |
| Add SCLX to Watchlist: View: Get Complete SCLX Trend Analysis ➞ | |
 | NVRO Nevro Corp. |
| Sector: Health Care | |
| SubSector: Medical Appliances & Equipment | |
| MarketCap: 2489.3 Millions | |
| Recent Price: 10.36 Smart Investing & Trading Score: 5 | |
| Day Percent Change: -10.19% Day Change: -1.17 | |
| Week Change: -8.28% Year-to-date Change: -51.9% | |
| NVRO Links: Profile News Message Board | |
| Charts:- Daily , Weekly | |
| Add NVRO to Watchlist: View: Get Complete NVRO Trend Analysis ➞ | |
 | QLYS Qualys, Inc. |
| Sector: Technology | |
| SubSector: Application Software | |
| MarketCap: 3475.02 Millions | |
| Recent Price: 148.87 Smart Investing & Trading Score: 0 | |
| Day Percent Change: -10.31% Day Change: -17.11 | |
| Week Change: -9.98% Year-to-date Change: -24.2% | |
| QLYS Links: Profile News Message Board | |
| Charts:- Daily , Weekly | |
| Add QLYS to Watchlist: View: Get Complete QLYS Trend Analysis ➞ | |
 | MPLN MultiPlan Corporation |
| Sector: Health Care | |
| SubSector: Healthcare Plans | |
| MarketCap: 56087 Millions | |
| Recent Price: 0.58 Smart Investing & Trading Score: 10 | |
| Day Percent Change: -10.48% Day Change: -0.07 | |
| Week Change: -11.05% Year-to-date Change: -59.6% | |
| MPLN Links: Profile News Message Board | |
| Charts:- Daily , Weekly | |
| Add MPLN to Watchlist: View: Get Complete MPLN Trend Analysis ➞ | |
| Too many stocks? View smallcap stocks filtered by marketcap & sector |
| Marketcap: All SmallCap Stocks (default-no microcap), Large, Mid-Range, Small & MicroCap |
| Sector: Tech, Finance, Energy, Staples, Retail, Industrial, Materials, Utilities & Medical |
|
Best Stocks Today 12Stocks.com |
© 2024 12Stocks.com Terms & Conditions Privacy Contact Us
All Information Provided Only For Education And Not To Be Used For Investing or Trading. See Terms & Conditions


One More Thing ... Get Best Stocks Delivered Daily!
Never Ever Miss A Move With Our Top Ten Stocks Lists
Find Best Stocks In Any Market - Bull or Bear Market
Take A Peek At Our Top Ten Stocks Lists: Daily, Weekly, Year-to-Date & Top Trends
Find Best Stocks In Any Market - Bull or Bear Market
Take A Peek At Our Top Ten Stocks Lists: Daily, Weekly, Year-to-Date & Top Trends
Smallcap Stocks With Best Up Trends [0-bearish to 100-bullish]: Cricut [100], DASAN Zhone[100], Hyster-Yale Materials[100], Latham Group[100], Alpha and[100], Vigil Neuroscience[100], Myriad Genetics[100], Hannon Armstrong[100], Ardmore Shipping[100], Pacira BioSciences[100], Wolverine World[100]
Best Smallcap Stocks Year-to-Date:
CareMax [568.04%], Janux [398.37%], Viking [325.04%], Bakkt [273.09%], Longboard [253.85%], Alpine Immune[239.73%], Super Micro[190.86%], Avidity Biosciences[186.17%], Vera [183.88%], Cullinan Oncology[174.2%], Arcutis Bio[146.28%] Best Smallcap Stocks This Week:
DASAN Zhone[64.32%], Perficient [52.7%], Innodata [49.03%], Vigil Neuroscience[37.87%], Latham Group[37.73%], Cricut [37.35%], Thoughtworks Holding[34.67%], Children s[31.88%], Great Lakes[31.03%], Outset Medical[30.19%], Hyster-Yale Materials[26.56%] Best Smallcap Stocks Daily:
Innodata [48.59%], Cricut [42.31%], DASAN Zhone[30.11%], Hyster-Yale Materials[26.08%], Latham Group[25.75%], Ameresco [21.54%], Alpha and[20.06%], iRobot [19.18%], Vigil Neuroscience[17.55%], Myriad Genetics[17.09%], PowerSchool [16.53%]