
 Login Sign Up


| |||||
 |  | ||||

| 12Stocks.com Market Intelligence |
Best S&P 500 Stocks
|
On this page, you will find the most comprehensive analysis of S&P 500 stocks and ETFs - from latest trends to performances to charts ➞. First, here are the year-to-date (YTD) performances of the most requested S&P 500 stocks at 12Stocks.com (click stock for review):
| NVIDIA 79% | ||
| Amazon.com 23% | ||
| Google 20% | ||
| Merck 17% | ||
| Caterpillar 14% | ||
| Walmart 14% | ||
| Goldman Sachs 14% | ||
| JPMorgan Chase 12% | ||
| Microsoft 8% | ||
| Chevron 7% | ||
| Apple -5% | ||
| Johnson & Johnson -5% | ||
| McDonald s -9% | ||
| Gilead -20% | ||
| Starbucks -24% | ||
| Boeing -31% | ||
| Intel -39% | ||
| Quick: S&P 500 Stocks Lists: Performances & Trends, S&P 500 Stock Charts
Sort S&P 500 stocks: Daily, Weekly, Year-to-Date, Market Cap & Trends. Filter S&P 500 stocks list by sector: Show all, Tech, Finance, Energy, Staples, Retail, Industrial, Materials, Utilities and HealthCare |
| 12Stocks.com S&P 500 Stocks Performances & Trends Daily Report | |||||||||
|
| 
The overall Smart Investing & Trading Score is 60 (0-bearish to 100-bullish) which puts S&P 500 index in short term neutral to bullish trend. The Smart Investing & Trading Score from previous trading session is 30 and hence an improvement of trend. | ||||||||
Here are the Smart Investing & Trading Scores of the most requested S&P 500 stocks at 12Stocks.com (click stock name for detailed review):
|


| 12Stocks.com: Top Performing S&P 500 Index Stocks | ||||||||||||||||||||||||||||||||||||||||||||||||
 The top performing S&P 500 Index stocks year to date are
Now, more recently, over last week, the top performing S&P 500 Index stocks on the move are


|
||||||||||||||||||||||||||||||||||||||||||||||||
| 12Stocks.com: Investing in S&P 500 Index with Stocks | |
|
The following table helps investors and traders sort through current performance and trends (as measured by Smart Investing & Trading Score) of various
stocks in the S&P 500 Index. Quick View: Move mouse or cursor over stock symbol (ticker) to view short-term technical chart and over stock name to view long term chart. Click on  to add stock symbol to your watchlist and to add stock symbol to your watchlist and  to view watchlist. Click on any ticker or stock name for detailed market intelligence report for that stock. to view watchlist. Click on any ticker or stock name for detailed market intelligence report for that stock. |
12Stocks.com Performance of Stocks in S&P 500 Index
| Ticker | Stock Name | Watchlist | Category | Recent Price | Smart Investing & Trading Score | Change % | YTD Change% |
| MSFT | Microsoft |   | Technology | 406.66 | 32 | 2.22 | 8.14% |
| AWK | American Water | | Utilities | 128.75 | 100 | 2.22 | -2.45% |
| J | Jacobs Engineering | | Services & Goods | 148.10 | 95 | 2.19 | 14.10% |
| HD | Home Depot | | Services & Goods | 342.85 | 49 | 2.18 | -1.07% |
| FMC | FMC | | Materials | 61.85 | 100 | 2.18 | -1.90% |
| TFX | Teleflex | | Health Care | 203.01 | 10 | 2.15 | -18.58% |
| KLAC | KLA | | Technology | 696.59 | 90 | 2.13 | 19.83% |
| IVZ | Invesco | | Financials | 14.84 | 32 | 2.13 | -16.82% |
| MCHP | Microchip | | Technology | 91.36 | 83 | 2.12 | 1.31% |
| ZION | Zions Ban | | Financials | 43.62 | 100 | 2.11 | -0.57% |
| MU | Micron | | Technology | 114.70 | 70 | 2.11 | 34.40% |
| DHI | D.R. Horton | | Industrials | 148.48 | 62 | 2.08 | -2.30% |
| REGN | Regeneron | | Health Care | 957.00 | 69 | 2.07 | 8.96% |
| MTCH | Match | | Technology | 31.93 | 37 | 2.05 | -12.52% |
| NRG | NRG | | Utilities | 76.65 | 95 | 2.02 | 48.26% |
| ADBE | Adobe | | Technology | 486.18 | 64 | 2.02 | -18.51% |
| EQT | EQT | | Energy | 40.27 | 88 | 2.00 | 4.16% |
| HPE | Hewlett Packard | | Technology | 16.86 | 43 | 2.00 | -0.71% |
| NUE | Nucor | | Materials | 173.92 | 32 | 1.99 | -0.07% |
| ARE | Alexandria Real | | Financials | 120.51 | 52 | 1.98 | -4.94% |
| AME | AMETEK | | Industrials | 166.56 | 0 | 1.97 | 1.01% |
| SPGI | S&P Global | | Services & Goods | 425.18 | 64 | 1.97 | -3.48% |
| TTWO | Take-Two Interactive | | Technology | 145.88 | 62 | 1.96 | -9.36% |
| NWSA | News | | Services & Goods | 24.47 | 50 | 1.96 | -0.33% |
| FANG | Diamondback | | Energy | 201.50 | 61 | 1.96 | 29.93% |
| For chart view version of above stock list: Chart View ➞ 0 - 25 , 25 - 50 , 50 - 75 , 75 - 100 , 100 - 125 , 125 - 150 , 150 - 175 , 175 - 200 , 200 - 225 , 225 - 250 , 250 - 275 , 275 - 300 , 300 - 325 , 325 - 350 , 350 - 375 , 375 - 400 , 400 - 425 , 425 - 450 , 450 - 475 , 475 - 500 | ||
 | Click To Change The Sort Order: By Market Cap or Company Size Performance: Year-to-date, Week and Day |  |
|
Get the most comprehensive stock market coverage daily at 12Stocks.com ➞ Best Stocks Today ➞ Best Stocks Weekly ➞ Best Stocks Year-to-Date ➞ Best Stocks Trends ➞  Best Stocks Today 12Stocks.com Best Nasdaq Stocks ➞ Best S&P 500 Stocks ➞ Best Tech Stocks ➞ Best Biotech Stocks ➞ |
| Detailed Overview of S&P 500 Stocks |
| S&P 500 Technical Overview, Leaders & Laggards, Top S&P 500 ETF Funds & Detailed S&P 500 Stocks List, Charts, Trends & More |
| S&P 500: Technical Analysis, Trends & YTD Performance | |
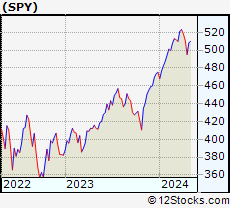
| S&P 500 index as represented by
SPY, an exchange-traded fund [ETF], holds basket of five hundred (mostly largecap) stocks from across all major sectors of the US stock market. The S&P 500 index (contains stocks like Apple and Exxon) is up by 7.57% and is currently outperforming the overall market by 0.69% year-to-date. Below is a quick view of technical charts and trends: | |
 SPY Weekly Chart |
|
| Long Term Trend: Good | |
| Medium Term Trend: Good | |
 SPY Daily Chart |
|
| Short Term Trend: Very Good | |
| Overall Trend Score: 60 | |
| YTD Performance: 7.57% | |
| **Trend Scores & Views Are Only For Educational Purposes And Not For Investing | |
| 12Stocks.com: Investing in S&P 500 Index using Exchange Traded Funds | |
|
The following table shows list of key exchange traded funds (ETF) that
help investors track S&P 500 index. The following list also includes leveraged ETF funds that track twice or thrice the daily returns of S&P 500 indices. Short or inverse ETF funds move in the opposite direction to the index they track and are useful during market pullbacks or during bear markets. Quick View: Move mouse or cursor over ETF symbol (ticker) to view short-term technical chart and over ETF name to view long term chart. Click on ticker or stock name for detailed view. Click on to add stock symbol to your watchlist and to view watchlist. |
12Stocks.com List of ETFs that track S&P 500 Index
| Ticker | ETF Name | Watchlist | Recent Price | Smart Investing & Trading Score | Change % | Week % | Year-to-date % |
| SPY | SPDR S&P 500 ETF | | 511.29 | 60 | 1.24 | 0.6 | 7.57% |
| IVV | iShares Core S&P 500 ETF | | 513.84 | 60 | 1.26 | 0.6 | 7.58% |
| VOO | Vanguard 500 ETF | | 469.98 | 60 | 1.24 | 0.59 | 7.6% |
| OEF | iShares S&P 100 | | 243.74 | 83 | 1.46 | 0.9 | 9.11% |
| SSO | ProShares Ultra S&P500 | | 73.46 | 60 | 2.51 | 1.03 | 12.89% |
| UPRO | ProShares UltraPro S&P500 | | 64.69 | 52 | 3.72 | 1.36 | 18.18% |
| SPXL | Direxion Daily S&P500 Bull 3X ETF | | 122.86 | 52 | 3.73 | 1.42 | 18.15% |
| SH | ProShares Short S&P500 | | 12.23 | 41 | -1.21 | -0.41 | -5.85% |
| SDS | ProShares UltraShort S&P500 | | 26.25 | 28 | -2.42 | -1.06 | -12.27% |
| SPXU | ProShares UltraPro Short S&P500 | | 34.89 | 23 | -3.78 | -1.72 | -18.86% |
| SPXS | Direxion Daily S&P 500 Bear 3X ETF | | 9.46 | 23 | -3.57 | -1.56 | -18.1% |
| 12Stocks.com: Charts, Trends, Fundamental Data and Performances of S&P 500 Stocks | |
|
We now take in-depth look at all S&P 500 stocks including charts, multi-period performances and overall trends (as measured by Smart Investing & Trading Score). One can sort S&P 500 stocks (click link to choose) by Daily, Weekly and by Year-to-Date performances. Also, one can sort by size of the company or by market capitalization. |
| Select Your Default Chart Type: | |||||
| |||||
| Click on stock symbol or name for detailed view. Click on to add stock symbol to your watchlist and to view watchlist. Quick View: Move mouse or cursor over "Daily" to quickly view daily technical stock chart and over "Weekly" to view weekly technical stock chart. | |||||

 | MSFT Microsoft Corporation |
| Sector: Technology | |
| SubSector: Business Software & Services | |
| MarketCap: 1154150 Millions | |
| Recent Price: 406.66 Smart Investing & Trading Score: 32 | |
| Day Percent Change: 2.22% Day Change: 8.82 | |
| Week Change: 0.08% Year-to-date Change: 8.1% | |
| MSFT Links: Profile News Message Board | |
| Charts:- Daily , Weekly | |
| Add MSFT to Watchlist: View: Get MSFT Trend Analysis ➞ | |
 | AWK American Water Works Company, Inc. |
| Sector: Utilities | |
| SubSector: Water Utilities | |
| MarketCap: 20029.2 Millions | |
| Recent Price: 128.75 Smart Investing & Trading Score: 100 | |
| Day Percent Change: 2.22% Day Change: 2.80 | |
| Week Change: 6.6% Year-to-date Change: -2.5% | |
| AWK Links: Profile News Message Board | |
| Charts:- Daily , Weekly | |
| Add AWK to Watchlist: View: Get AWK Trend Analysis ➞ | |
 | J Jacobs Engineering Group Inc. |
| Sector: Services & Goods | |
| SubSector: Technical Services | |
| MarketCap: 9714.8 Millions | |
| Recent Price: 148.10 Smart Investing & Trading Score: 95 | |
| Day Percent Change: 2.19% Day Change: 3.17 | |
| Week Change: 2.2% Year-to-date Change: 14.1% | |
| J Links: Profile News Message Board | |
| Charts:- Daily , Weekly | |
| Add J to Watchlist: View: Get J Trend Analysis ➞ | |
 | HD The Home Depot, Inc. |
| Sector: Services & Goods | |
| SubSector: Home Improvement Stores | |
| MarketCap: 185389 Millions | |
| Recent Price: 342.85 Smart Investing & Trading Score: 49 | |
| Day Percent Change: 2.18% Day Change: 7.32 | |
| Week Change: 2.32% Year-to-date Change: -1.1% | |
| HD Links: Profile News Message Board | |
| Charts:- Daily , Weekly | |
| Add HD to Watchlist: View: Get HD Trend Analysis ➞ | |
 | FMC FMC Corporation |
| Sector: Materials | |
| SubSector: Chemicals - Major Diversified | |
| MarketCap: 9068.36 Millions | |
| Recent Price: 61.85 Smart Investing & Trading Score: 100 | |
| Day Percent Change: 2.18% Day Change: 1.32 | |
| Week Change: 5.8% Year-to-date Change: -1.9% | |
| FMC Links: Profile News Message Board | |
| Charts:- Daily , Weekly | |
| Add FMC to Watchlist: View: Get FMC Trend Analysis ➞ | |
 | TFX Teleflex Incorporated |
| Sector: Health Care | |
| SubSector: Medical Instruments & Supplies | |
| MarketCap: 12989.3 Millions | |
| Recent Price: 203.01 Smart Investing & Trading Score: 10 | |
| Day Percent Change: 2.15% Day Change: 4.28 | |
| Week Change: -1.79% Year-to-date Change: -18.6% | |
| TFX Links: Profile News Message Board | |
| Charts:- Daily , Weekly | |
| Add TFX to Watchlist: View: Get TFX Trend Analysis ➞ | |
 | KLAC KLA Corporation |
| Sector: Technology | |
| SubSector: Semiconductor Equipment & Materials | |
| MarketCap: 20663.8 Millions | |
| Recent Price: 696.59 Smart Investing & Trading Score: 90 | |
| Day Percent Change: 2.13% Day Change: 14.54 | |
| Week Change: -1.37% Year-to-date Change: 19.8% | |
| KLAC Links: Profile News Message Board | |
| Charts:- Daily , Weekly | |
| Add KLAC to Watchlist: View: Get KLAC Trend Analysis ➞ | |
 | IVZ Invesco Ltd. |
| Sector: Financials | |
| SubSector: Asset Management | |
| MarketCap: 4578.23 Millions | |
| Recent Price: 14.84 Smart Investing & Trading Score: 32 | |
| Day Percent Change: 2.13% Day Change: 0.31 | |
| Week Change: 1.16% Year-to-date Change: -16.8% | |
| IVZ Links: Profile News Message Board | |
| Charts:- Daily , Weekly | |
| Add IVZ to Watchlist: View: Get IVZ Trend Analysis ➞ | |
 | MCHP Microchip Technology Incorporated |
| Sector: Technology | |
| SubSector: Semiconductor - Broad Line | |
| MarketCap: 16826.3 Millions | |
| Recent Price: 91.36 Smart Investing & Trading Score: 83 | |
| Day Percent Change: 2.12% Day Change: 1.90 | |
| Week Change: -2.39% Year-to-date Change: 1.3% | |
| MCHP Links: Profile News Message Board | |
| Charts:- Daily , Weekly | |
| Add MCHP to Watchlist: View: Get MCHP Trend Analysis ➞ | |
 | ZION Zions Bancorporation, National Association |
| Sector: Financials | |
| SubSector: Regional - Pacific Banks | |
| MarketCap: 4577.89 Millions | |
| Recent Price: 43.62 Smart Investing & Trading Score: 100 | |
| Day Percent Change: 2.11% Day Change: 0.90 | |
| Week Change: 4.45% Year-to-date Change: -0.6% | |
| ZION Links: Profile News Message Board | |
| Charts:- Daily , Weekly | |
| Add ZION to Watchlist: View: Get ZION Trend Analysis ➞ | |
 | MU Micron Technology, Inc. |
| Sector: Technology | |
| SubSector: Semiconductor- Memory Chips | |
| MarketCap: 45188.4 Millions | |
| Recent Price: 114.70 Smart Investing & Trading Score: 70 | |
| Day Percent Change: 2.11% Day Change: 2.37 | |
| Week Change: -0.12% Year-to-date Change: 34.4% | |
| MU Links: Profile News Message Board | |
| Charts:- Daily , Weekly | |
| Add MU to Watchlist: View: Get MU Trend Analysis ➞ | |
 | DHI D.R. Horton, Inc. |
| Sector: Industrials | |
| SubSector: Residential Construction | |
| MarketCap: 13372.6 Millions | |
| Recent Price: 148.48 Smart Investing & Trading Score: 62 | |
| Day Percent Change: 2.08% Day Change: 3.02 | |
| Week Change: 2.17% Year-to-date Change: -2.3% | |
| DHI Links: Profile News Message Board | |
| Charts:- Daily , Weekly | |
| Add DHI to Watchlist: View: Get DHI Trend Analysis ➞ | |
 | REGN Regeneron Pharmaceuticals, Inc. |
| Sector: Health Care | |
| SubSector: Biotechnology | |
| MarketCap: 51903.7 Millions | |
| Recent Price: 957.00 Smart Investing & Trading Score: 69 | |
| Day Percent Change: 2.07% Day Change: 19.39 | |
| Week Change: 8.36% Year-to-date Change: 9.0% | |
| REGN Links: Profile News Message Board | |
| Charts:- Daily , Weekly | |
| Add REGN to Watchlist: View: Get REGN Trend Analysis ➞ | |
 | MTCH Match Group, Inc. |
| Sector: Technology | |
| SubSector: Internet Information Providers | |
| MarketCap: 14655.8 Millions | |
| Recent Price: 31.93 Smart Investing & Trading Score: 37 | |
| Day Percent Change: 2.05% Day Change: 0.64 | |
| Week Change: 0.13% Year-to-date Change: -12.5% | |
| MTCH Links: Profile News Message Board | |
| Charts:- Daily , Weekly | |
| Add MTCH to Watchlist: View: Get MTCH Trend Analysis ➞ | |
 | NRG NRG Energy, Inc. |
| Sector: Utilities | |
| SubSector: Diversified Utilities | |
| MarketCap: 6510.7 Millions | |
| Recent Price: 76.65 Smart Investing & Trading Score: 95 | |
| Day Percent Change: 2.02% Day Change: 1.52 | |
| Week Change: 5.27% Year-to-date Change: 48.3% | |
| NRG Links: Profile News Message Board | |
| Charts:- Daily , Weekly | |
| Add NRG to Watchlist: View: Get NRG Trend Analysis ➞ | |
 | ADBE Adobe Inc. |
| Sector: Technology | |
| SubSector: Application Software | |
| MarketCap: 157868 Millions | |
| Recent Price: 486.18 Smart Investing & Trading Score: 64 | |
| Day Percent Change: 2.02% Day Change: 9.61 | |
| Week Change: 1.81% Year-to-date Change: -18.5% | |
| ADBE Links: Profile News Message Board | |
| Charts:- Daily , Weekly | |
| Add ADBE to Watchlist: View: Get ADBE Trend Analysis ➞ | |
 | EQT EQT Corporation |
| Sector: Energy | |
| SubSector: Independent Oil & Gas | |
| MarketCap: 1886.63 Millions | |
| Recent Price: 40.27 Smart Investing & Trading Score: 88 | |
| Day Percent Change: 2.00% Day Change: 0.79 | |
| Week Change: -0.84% Year-to-date Change: 4.2% | |
| EQT Links: Profile News Message Board | |
| Charts:- Daily , Weekly | |
| Add EQT to Watchlist: View: Get EQT Trend Analysis ➞ | |
 | HPE Hewlett Packard Enterprise Company |
| Sector: Technology | |
| SubSector: Communication Equipment | |
| MarketCap: 12886.1 Millions | |
| Recent Price: 16.86 Smart Investing & Trading Score: 43 | |
| Day Percent Change: 2.00% Day Change: 0.33 | |
| Week Change: -1.81% Year-to-date Change: -0.7% | |
| HPE Links: Profile News Message Board | |
| Charts:- Daily , Weekly | |
| Add HPE to Watchlist: View: Get HPE Trend Analysis ➞ | |
 | NUE Nucor Corporation |
| Sector: Materials | |
| SubSector: Steel & Iron | |
| MarketCap: 10281.8 Millions | |
| Recent Price: 173.92 Smart Investing & Trading Score: 32 | |
| Day Percent Change: 1.99% Day Change: 3.40 | |
| Week Change: -0.86% Year-to-date Change: -0.1% | |
| NUE Links: Profile News Message Board | |
| Charts:- Daily , Weekly | |
| Add NUE to Watchlist: View: Get NUE Trend Analysis ➞ | |
 | ARE Alexandria Real Estate Equities, Inc. |
| Sector: Financials | |
| SubSector: REIT - Office | |
| MarketCap: 16793.6 Millions | |
| Recent Price: 120.51 Smart Investing & Trading Score: 52 | |
| Day Percent Change: 1.98% Day Change: 2.34 | |
| Week Change: 3.67% Year-to-date Change: -4.9% | |
| ARE Links: Profile News Message Board | |
| Charts:- Daily , Weekly | |
| Add ARE to Watchlist: View: Get ARE Trend Analysis ➞ | |
 | AME AMETEK, Inc. |
| Sector: Industrials | |
| SubSector: Diversified Machinery | |
| MarketCap: 16611.8 Millions | |
| Recent Price: 166.56 Smart Investing & Trading Score: 0 | |
| Day Percent Change: 1.97% Day Change: 3.22 | |
| Week Change: -6.17% Year-to-date Change: 1.0% | |
| AME Links: Profile News Message Board | |
| Charts:- Daily , Weekly | |
| Add AME to Watchlist: View: Get AME Trend Analysis ➞ | |
 | SPGI S&P Global Inc. |
| Sector: Services & Goods | |
| SubSector: Business Services | |
| MarketCap: 55247.9 Millions | |
| Recent Price: 425.18 Smart Investing & Trading Score: 64 | |
| Day Percent Change: 1.97% Day Change: 8.22 | |
| Week Change: 2.26% Year-to-date Change: -3.5% | |
| SPGI Links: Profile News Message Board | |
| Charts:- Daily , Weekly | |
| Add SPGI to Watchlist: View: Get SPGI Trend Analysis ➞ | |
 | TTWO Take-Two Interactive Software, Inc. |
| Sector: Technology | |
| SubSector: Multimedia & Graphics Software | |
| MarketCap: 12479.6 Millions | |
| Recent Price: 145.88 Smart Investing & Trading Score: 62 | |
| Day Percent Change: 1.96% Day Change: 2.81 | |
| Week Change: 0.98% Year-to-date Change: -9.4% | |
| TTWO Links: Profile News Message Board | |
| Charts:- Daily , Weekly | |
| Add TTWO to Watchlist: View: Get TTWO Trend Analysis ➞ | |
 | NWSA News Corporation |
| Sector: Services & Goods | |
| SubSector: Broadcasting - TV | |
| MarketCap: 5857.53 Millions | |
| Recent Price: 24.47 Smart Investing & Trading Score: 50 | |
| Day Percent Change: 1.96% Day Change: 0.47 | |
| Week Change: 1.03% Year-to-date Change: -0.3% | |
| NWSA Links: Profile News Message Board | |
| Charts:- Daily , Weekly | |
| Add NWSA to Watchlist: View: Get NWSA Trend Analysis ➞ | |
 | FANG Diamondback Energy, Inc. |
| Sector: Energy | |
| SubSector: Independent Oil & Gas | |
| MarketCap: 3009.13 Millions | |
| Recent Price: 201.50 Smart Investing & Trading Score: 61 | |
| Day Percent Change: 1.96% Day Change: 3.87 | |
| Week Change: -3.01% Year-to-date Change: 29.9% | |
| FANG Links: Profile News Message Board | |
| Charts:- Daily , Weekly | |
| Add FANG to Watchlist: View: Get FANG Trend Analysis ➞ | |
| For tabular summary view of above stock list: Summary View ➞ 0 - 25 , 25 - 50 , 50 - 75 , 75 - 100 , 100 - 125 , 125 - 150 , 150 - 175 , 175 - 200 , 200 - 225 , 225 - 250 , 250 - 275 , 275 - 300 , 300 - 325 , 325 - 350 , 350 - 375 , 375 - 400 , 400 - 425 , 425 - 450 , 450 - 475 , 475 - 500 | ||
| Click To Change The Sort Order: By Market Cap or Company Size Performance: Year-to-date, Week and Day | |
| Select Chart Type: | ||
|
Best Stocks Today 12Stocks.com |
© 2024 12Stocks.com Terms & Conditions Privacy Contact Us
All Information Provided Only For Education And Not To Be Used For Investing or Trading. See Terms & Conditions


One More Thing ... Get Best Stocks Delivered Daily!
Never Ever Miss A Move With Our Top Ten Stocks Lists
Find Best Stocks In Any Market - Bull or Bear Market
Take A Peek At Our Top Ten Stocks Lists: Daily, Weekly, Year-to-Date & Top Trends
Find Best Stocks In Any Market - Bull or Bear Market
Take A Peek At Our Top Ten Stocks Lists: Daily, Weekly, Year-to-Date & Top Trends
S&P 500 Stocks With Best Up Trends [0-bearish to 100-bullish]: Amgen [100], First Solar[100], Apple [100], Motorola Solutions[100], Camden Property[100], Aptiv [100], Rollins [100], Teradyne [100], Comerica [100], BorgWarner [100], Bio-Techne [100]
Best S&P 500 Stocks Year-to-Date:
NVIDIA [79.29%], Constellation [66.35%], NRG [48.26%], Chipotle Mexican[37.97%], Western Digital[35.48%], Micron [34.4%], Eaton [33.09%], Progressive [31.04%], Leidos Holdings[30.89%], Diamondback [29.93%], Targa Resources[29.29%] Best S&P 500 Stocks This Week:
Bio-Techne [20.65%], Moderna [15.77%], Garmin [15.7%], C.H. Robinson[15.64%], Amgen [15.3%], Aptiv [13.5%], Amcor [11.59%], BorgWarner [9.79%], Albemarle [9.6%], Pfizer [9.49%], Leidos Holdings[8.68%] Best S&P 500 Stocks Daily:
Amgen [11.82%], Enphase [7.67%], Live Nation[7.24%], First Solar[6.12%], Apple [5.98%], Motorola Solutions[5.19%], Digital Realty[4.89%], Constellation [4.87%], Arista Networks[4.79%], Camden Property[4.53%], Aptiv [3.90%]