
 Login Sign Up


| |||||
 |  | ||||

| 12Stocks.com Market Intelligence |
Best S&P 500 Stocks
|
On this page, you will find the most comprehensive analysis of S&P 500 stocks and ETFs - from latest trends to performances to charts ➞. First, here are the year-to-date (YTD) performances of the most requested S&P 500 stocks at 12Stocks.com (click stock for review):
| NVIDIA 61% | ||
| Caterpillar 23% | ||
| Merck 16% | ||
| Amazon.com 16% | ||
| Walmart 14% | ||
| Google 14% | ||
| JPMorgan Chase 14% | ||
| Chevron 10% | ||
| Goldman Sachs 10% | ||
| Microsoft 9% | ||
| Johnson & Johnson -5% | ||
| McDonald s -7% | ||
| Starbucks -8% | ||
| Apple -12% | ||
| Gilead -17% | ||
| Intel -31% | ||
| Boeing -37% | ||
| Quick: S&P 500 Stocks Lists: Performances & Trends, S&P 500 Stock Charts
Sort S&P 500 stocks: Daily, Weekly, Year-to-Date, Market Cap & Trends. Filter S&P 500 stocks list by sector: Show all, Tech, Finance, Energy, Staples, Retail, Industrial, Materials, Utilities and HealthCare |
| 12Stocks.com S&P 500 Stocks Performances & Trends Daily Report | |||||||||
|
| 
The overall Smart Investing & Trading Score is 58 (0-bearish to 100-bullish) which puts S&P 500 index in short term neutral trend. The Smart Investing & Trading Score from previous trading session is 51 and an improvement of trend continues. | ||||||||
Here are the Smart Investing & Trading Scores of the most requested S&P 500 stocks at 12Stocks.com (click stock name for detailed review):
|


| 12Stocks.com: Top Performing S&P 500 Index Stocks | ||||||||||||||||||||||||||||||||||||||||||||||||
 The top performing S&P 500 Index stocks year to date are
Now, more recently, over last week, the top performing S&P 500 Index stocks on the move are


|
||||||||||||||||||||||||||||||||||||||||||||||||
| 12Stocks.com: Investing in S&P 500 Index with Stocks | |
|
The following table helps investors and traders sort through current performance and trends (as measured by Smart Investing & Trading Score) of various
stocks in the S&P 500 Index. Quick View: Move mouse or cursor over stock symbol (ticker) to view short-term technical chart and over stock name to view long term chart. Click on  to add stock symbol to your watchlist and to add stock symbol to your watchlist and  to view watchlist. Click on any ticker or stock name for detailed market intelligence report for that stock. to view watchlist. Click on any ticker or stock name for detailed market intelligence report for that stock. |
12Stocks.com Performance of Stocks in S&P 500 Index
| Ticker | Stock Name | Watchlist | Category | Recent Price | Smart Investing & Trading Score | Change % | YTD Change% |
| HES | Hess |   | Energy | 159.13 | 93 | 1.40 | 10.38% |
| AES | AES | | Utilities | 17.37 | 85 | 1.40 | -9.77% |
| PM | Philip Morris | | Consumer Staples | 99.02 | 100 | 1.39 | 5.25% |
| DPZ | Domino s | | Services & Goods | 487.71 | 68 | 1.36 | 18.31% |
| IPG | Interpublic | | Services & Goods | 31.40 | 67 | 1.32 | -3.80% |
| WMT | Walmart | | Services & Goods | 59.87 | 56 | 1.32 | 13.93% |
| HRL | Hormel Foods | | Consumer Staples | 35.60 | 95 | 1.31 | 10.87% |
| KHC | Kraft Heinz | | Consumer Staples | 38.57 | 100 | 1.31 | 4.30% |
| DTE | DTE | | Utilities | 111.55 | 100 | 1.30 | 1.17% |
| CPB | Campbell Soup | | Consumer Staples | 45.54 | 100 | 1.29 | 5.34% |
| KLAC | KLA | | Technology | 656.54 | 58 | 1.29 | 12.94% |
| KMB | Kimberly-Clark | | Consumer Staples | 137.78 | 93 | 1.28 | 13.39% |
| AMP | Ameriprise Financial | | Financials | 412.86 | 36 | 1.27 | 8.70% |
| AAPL | Apple | | Technology | 169.02 | 50 | 1.27 | -12.21% |
| CLX | Clorox | | Consumer Staples | 147.78 | 90 | 1.24 | 3.64% |
| AWK | American Water | | Utilities | 121.36 | 74 | 1.24 | -8.05% |
| YUM | Yum! Brands | | Services & Goods | 141.81 | 100 | 1.22 | 8.53% |
| WMB | Williams | | Energy | 39.25 | 88 | 1.21 | 12.69% |
| ABNB | Airbnb | | Technology | 162.88 | 71 | 1.20 | 19.63% |
| CNP | CenterPoint | | Utilities | 29.07 | 100 | 1.18 | 1.75% |
| FFIV | F5 Networks | | Technology | 182.35 | 32 | 1.18 | 1.88% |
| CTRA | Contura | | Materials | 28.46 | 88 | 1.17 | 11.52% |
| MOH | Molina Healthcare | | Health Care | 367.41 | 43 | 1.15 | 1.69% |
| CPRT | Copart | | Services & Goods | 54.93 | 58 | 1.14 | 12.10% |
| GIS | General Mills | | Consumer Staples | 71.61 | 100 | 1.12 | 9.93% |
| For chart view version of above stock list: Chart View ➞ 0 - 25 , 25 - 50 , 50 - 75 , 75 - 100 , 100 - 125 , 125 - 150 , 150 - 175 , 175 - 200 , 200 - 225 , 225 - 250 , 250 - 275 , 275 - 300 , 300 - 325 , 325 - 350 , 350 - 375 , 375 - 400 , 400 - 425 , 425 - 450 , 450 - 475 , 475 - 500 | ||
 | Click To Change The Sort Order: By Market Cap or Company Size Performance: Year-to-date, Week and Day |  |
|
Get the most comprehensive stock market coverage daily at 12Stocks.com ➞ Best Stocks Today ➞ Best Stocks Weekly ➞ Best Stocks Year-to-Date ➞ Best Stocks Trends ➞  Best Stocks Today 12Stocks.com Best Nasdaq Stocks ➞ Best S&P 500 Stocks ➞ Best Tech Stocks ➞ Best Biotech Stocks ➞ |
| Detailed Overview of S&P 500 Stocks |
| S&P 500 Technical Overview, Leaders & Laggards, Top S&P 500 ETF Funds & Detailed S&P 500 Stocks List, Charts, Trends & More |
| S&P 500: Technical Analysis, Trends & YTD Performance | |
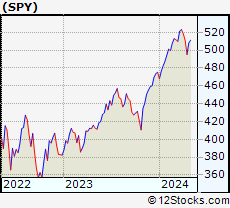
| S&P 500 index as represented by
SPY, an exchange-traded fund [ETF], holds basket of five hundred (mostly largecap) stocks from across all major sectors of the US stock market. The S&P 500 index (contains stocks like Apple and Exxon) is up by 6.33% and is currently outperforming the overall market by 0.67% year-to-date. Below is a quick view of technical charts and trends: | |
 SPY Weekly Chart |
|
| Long Term Trend: Good | |
| Medium Term Trend: Not Good | |
 SPY Daily Chart |
|
| Short Term Trend: Very Good | |
| Overall Trend Score: 58 | |
| YTD Performance: 6.33% | |
| **Trend Scores & Views Are Only For Educational Purposes And Not For Investing | |
| 12Stocks.com: Investing in S&P 500 Index using Exchange Traded Funds | |
|
The following table shows list of key exchange traded funds (ETF) that
help investors track S&P 500 index. The following list also includes leveraged ETF funds that track twice or thrice the daily returns of S&P 500 indices. Short or inverse ETF funds move in the opposite direction to the index they track and are useful during market pullbacks or during bear markets. Quick View: Move mouse or cursor over ETF symbol (ticker) to view short-term technical chart and over ETF name to view long term chart. Click on ticker or stock name for detailed view. Click on to add stock symbol to your watchlist and to view watchlist. |
12Stocks.com List of ETFs that track S&P 500 Index
| Ticker | ETF Name | Watchlist | Recent Price | Smart Investing & Trading Score | Change % | Week % | Year-to-date % |
| SPY | SPDR S&P 500 ETF | | 505.41 | 58 | -0.05 | 2.07 | 6.33% |
| IVV | iShares Core S&P 500 ETF | | 507.97 | 63 | -0.04 | 2.1 | 6.35% |
| VOO | Vanguard 500 ETF | | 464.50 | 63 | -0.07 | 2.07 | 6.34% |
| OEF | iShares S&P 100 | | 239.79 | 58 | -0.07 | 2.18 | 7.34% |
| SSO | ProShares Ultra S&P500 | | 71.95 | 58 | -0.12 | 4.11 | 10.57% |
| UPRO | ProShares UltraPro S&P500 | | 62.88 | 58 | -0.08 | 6.29 | 14.87% |
| SPXL | Direxion Daily S&P500 Bull 3X ETF | | 119.35 | 63 | -0.13 | 6.04 | 14.77% |
| SH | ProShares Short S&P500 | | 12.33 | 42 | -0.08 | -2.07 | -5.08% |
| SDS | ProShares UltraShort S&P500 | | 26.80 | 42 | 0.07 | -3.94 | -10.43% |
| SPXU | ProShares UltraPro Short S&P500 | | 36.04 | 42 | 0.14 | -5.97 | -16.19% |
| SPXS | Direxion Daily S&P 500 Bear 3X ETF | | 9.75 | 32 | 0.00 | -5.89 | -15.58% |
| 12Stocks.com: Charts, Trends, Fundamental Data and Performances of S&P 500 Stocks | |
|
We now take in-depth look at all S&P 500 stocks including charts, multi-period performances and overall trends (as measured by Smart Investing & Trading Score). One can sort S&P 500 stocks (click link to choose) by Daily, Weekly and by Year-to-Date performances. Also, one can sort by size of the company or by market capitalization. |
| Select Your Default Chart Type: | |||||
| |||||
| Click on stock symbol or name for detailed view. Click on to add stock symbol to your watchlist and to view watchlist. Quick View: Move mouse or cursor over "Daily" to quickly view daily technical stock chart and over "Weekly" to view weekly technical stock chart. | |||||

 | HES Hess Corporation |
| Sector: Energy | |
| SubSector: Independent Oil & Gas | |
| MarketCap: 10465.3 Millions | |
| Recent Price: 159.13 Smart Investing & Trading Score: 93 | |
| Day Percent Change: 1.40% Day Change: 2.19 | |
| Week Change: 3.1% Year-to-date Change: 10.4% | |
| HES Links: Profile News Message Board | |
| Charts:- Daily , Weekly | |
| Add HES to Watchlist: View: Get HES Trend Analysis ➞ | |
 | AES The AES Corporation |
| Sector: Utilities | |
| SubSector: Electric Utilities | |
| MarketCap: 9173.44 Millions | |
| Recent Price: 17.37 Smart Investing & Trading Score: 85 | |
| Day Percent Change: 1.40% Day Change: 0.24 | |
| Week Change: 5.91% Year-to-date Change: -9.8% | |
| AES Links: Profile News Message Board | |
| Charts:- Daily , Weekly | |
| Add AES to Watchlist: View: Get AES Trend Analysis ➞ | |
 | PM Philip Morris International Inc. |
| Sector: Consumer Staples | |
| SubSector: Cigarettes | |
| MarketCap: 105035 Millions | |
| Recent Price: 99.02 Smart Investing & Trading Score: 100 | |
| Day Percent Change: 1.39% Day Change: 1.36 | |
| Week Change: 5.6% Year-to-date Change: 5.3% | |
| PM Links: Profile News Message Board | |
| Charts:- Daily , Weekly | |
| Add PM to Watchlist: View: Get PM Trend Analysis ➞ | |
 | DPZ Domino s Pizza, Inc. |
| Sector: Services & Goods | |
| SubSector: Restaurants | |
| MarketCap: 12166 Millions | |
| Recent Price: 487.71 Smart Investing & Trading Score: 68 | |
| Day Percent Change: 1.36% Day Change: 6.55 | |
| Week Change: 2.99% Year-to-date Change: 18.3% | |
| DPZ Links: Profile News Message Board | |
| Charts:- Daily , Weekly | |
| Add DPZ to Watchlist: View: Get DPZ Trend Analysis ➞ | |
 | IPG The Interpublic Group of Companies, Inc. |
| Sector: Services & Goods | |
| SubSector: Advertising Agencies | |
| MarketCap: 5730.55 Millions | |
| Recent Price: 31.40 Smart Investing & Trading Score: 67 | |
| Day Percent Change: 1.32% Day Change: 0.41 | |
| Week Change: 2.21% Year-to-date Change: -3.8% | |
| IPG Links: Profile News Message Board | |
| Charts:- Daily , Weekly | |
| Add IPG to Watchlist: View: Get IPG Trend Analysis ➞ | |
 | WMT Walmart Inc. |
| Sector: Services & Goods | |
| SubSector: Discount, Variety Stores | |
| MarketCap: 355610 Millions | |
| Recent Price: 59.87 Smart Investing & Trading Score: 56 | |
| Day Percent Change: 1.32% Day Change: 0.78 | |
| Week Change: 0.57% Year-to-date Change: 13.9% | |
| WMT Links: Profile News Message Board | |
| Charts:- Daily , Weekly | |
| Add WMT to Watchlist: View: Get WMT Trend Analysis ➞ | |
 | HRL Hormel Foods Corporation |
| Sector: Consumer Staples | |
| SubSector: Meat Products | |
| MarketCap: 25590.2 Millions | |
| Recent Price: 35.60 Smart Investing & Trading Score: 95 | |
| Day Percent Change: 1.31% Day Change: 0.46 | |
| Week Change: 2.48% Year-to-date Change: 10.9% | |
| HRL Links: Profile News Message Board | |
| Charts:- Daily , Weekly | |
| Add HRL to Watchlist: View: Get HRL Trend Analysis ➞ | |
 | KHC The Kraft Heinz Company |
| Sector: Consumer Staples | |
| SubSector: Food - Major Diversified | |
| MarketCap: 32096.3 Millions | |
| Recent Price: 38.57 Smart Investing & Trading Score: 100 | |
| Day Percent Change: 1.31% Day Change: 0.50 | |
| Week Change: 2.09% Year-to-date Change: 4.3% | |
| KHC Links: Profile News Message Board | |
| Charts:- Daily , Weekly | |
| Add KHC to Watchlist: View: Get KHC Trend Analysis ➞ | |
 | DTE DTE Energy Company |
| Sector: Utilities | |
| SubSector: Electric Utilities | |
| MarketCap: 18218.1 Millions | |
| Recent Price: 111.55 Smart Investing & Trading Score: 100 | |
| Day Percent Change: 1.30% Day Change: 1.43 | |
| Week Change: 2.74% Year-to-date Change: 1.2% | |
| DTE Links: Profile News Message Board | |
| Charts:- Daily , Weekly | |
| Add DTE to Watchlist: View: Get DTE Trend Analysis ➞ | |
 | CPB Campbell Soup Company |
| Sector: Consumer Staples | |
| SubSector: Processed & Packaged Goods | |
| MarketCap: 14468.8 Millions | |
| Recent Price: 45.54 Smart Investing & Trading Score: 100 | |
| Day Percent Change: 1.29% Day Change: 0.58 | |
| Week Change: 3.03% Year-to-date Change: 5.3% | |
| CPB Links: Profile News Message Board | |
| Charts:- Daily , Weekly | |
| Add CPB to Watchlist: View: Get CPB Trend Analysis ➞ | |
 | KLAC KLA Corporation |
| Sector: Technology | |
| SubSector: Semiconductor Equipment & Materials | |
| MarketCap: 20663.8 Millions | |
| Recent Price: 656.54 Smart Investing & Trading Score: 58 | |
| Day Percent Change: 1.29% Day Change: 8.33 | |
| Week Change: 4.52% Year-to-date Change: 12.9% | |
| KLAC Links: Profile News Message Board | |
| Charts:- Daily , Weekly | |
| Add KLAC to Watchlist: View: Get KLAC Trend Analysis ➞ | |
 | KMB Kimberly-Clark Corporation |
| Sector: Consumer Staples | |
| SubSector: Personal Products | |
| MarketCap: 44300.5 Millions | |
| Recent Price: 137.78 Smart Investing & Trading Score: 93 | |
| Day Percent Change: 1.28% Day Change: 1.74 | |
| Week Change: 8.63% Year-to-date Change: 13.4% | |
| KMB Links: Profile News Message Board | |
| Charts:- Daily , Weekly | |
| Add KMB to Watchlist: View: Get KMB Trend Analysis ➞ | |
 | AMP Ameriprise Financial, Inc. |
| Sector: Financials | |
| SubSector: Asset Management | |
| MarketCap: 13270.5 Millions | |
| Recent Price: 412.86 Smart Investing & Trading Score: 36 | |
| Day Percent Change: 1.27% Day Change: 5.17 | |
| Week Change: -1% Year-to-date Change: 8.7% | |
| AMP Links: Profile News Message Board | |
| Charts:- Daily , Weekly | |
| Add AMP to Watchlist: View: Get AMP Trend Analysis ➞ | |
 | AAPL Apple Inc. |
| Sector: Technology | |
| SubSector: Electronic Equipment | |
| MarketCap: 1112940 Millions | |
| Recent Price: 169.02 Smart Investing & Trading Score: 50 | |
| Day Percent Change: 1.27% Day Change: 2.12 | |
| Week Change: 2.44% Year-to-date Change: -12.2% | |
| AAPL Links: Profile News Message Board | |
| Charts:- Daily , Weekly | |
| Add AAPL to Watchlist: View: Get AAPL Trend Analysis ➞ | |
 | CLX The Clorox Company |
| Sector: Consumer Staples | |
| SubSector: Housewares & Accessories | |
| MarketCap: 23688.3 Millions | |
| Recent Price: 147.78 Smart Investing & Trading Score: 90 | |
| Day Percent Change: 1.24% Day Change: 1.81 | |
| Week Change: 2.95% Year-to-date Change: 3.6% | |
| CLX Links: Profile News Message Board | |
| Charts:- Daily , Weekly | |
| Add CLX to Watchlist: View: Get CLX Trend Analysis ➞ | |
 | AWK American Water Works Company, Inc. |
| Sector: Utilities | |
| SubSector: Water Utilities | |
| MarketCap: 20029.2 Millions | |
| Recent Price: 121.36 Smart Investing & Trading Score: 74 | |
| Day Percent Change: 1.24% Day Change: 1.49 | |
| Week Change: 2.4% Year-to-date Change: -8.1% | |
| AWK Links: Profile News Message Board | |
| Charts:- Daily , Weekly | |
| Add AWK to Watchlist: View: Get AWK Trend Analysis ➞ | |
 | YUM Yum! Brands, Inc. |
| Sector: Services & Goods | |
| SubSector: Restaurants | |
| MarketCap: 18033.3 Millions | |
| Recent Price: 141.81 Smart Investing & Trading Score: 100 | |
| Day Percent Change: 1.22% Day Change: 1.71 | |
| Week Change: 2.39% Year-to-date Change: 8.5% | |
| YUM Links: Profile News Message Board | |
| Charts:- Daily , Weekly | |
| Add YUM to Watchlist: View: Get YUM Trend Analysis ➞ | |
 | WMB The Williams Companies, Inc. |
| Sector: Energy | |
| SubSector: Oil & Gas Pipelines | |
| MarketCap: 16851.5 Millions | |
| Recent Price: 39.25 Smart Investing & Trading Score: 88 | |
| Day Percent Change: 1.21% Day Change: 0.47 | |
| Week Change: 1.92% Year-to-date Change: 12.7% | |
| WMB Links: Profile News Message Board | |
| Charts:- Daily , Weekly | |
| Add WMB to Watchlist: View: Get WMB Trend Analysis ➞ | |
 | ABNB Airbnb, Inc. |
| Sector: Technology | |
| SubSector: Internet Content & Information | |
| MarketCap: 86237 Millions | |
| Recent Price: 162.88 Smart Investing & Trading Score: 71 | |
| Day Percent Change: 1.20% Day Change: 1.93 | |
| Week Change: 2.42% Year-to-date Change: 19.6% | |
| ABNB Links: Profile News Message Board | |
| Charts:- Daily , Weekly | |
| Add ABNB to Watchlist: View: Get ABNB Trend Analysis ➞ | |
 | CNP CenterPoint Energy, Inc. |
| Sector: Utilities | |
| SubSector: Gas Utilities | |
| MarketCap: 7444.07 Millions | |
| Recent Price: 29.07 Smart Investing & Trading Score: 100 | |
| Day Percent Change: 1.18% Day Change: 0.34 | |
| Week Change: 1.89% Year-to-date Change: 1.8% | |
| CNP Links: Profile News Message Board | |
| Charts:- Daily , Weekly | |
| Add CNP to Watchlist: View: Get CNP Trend Analysis ➞ | |
 | FFIV F5 Networks, Inc. |
| Sector: Technology | |
| SubSector: Business Software & Services | |
| MarketCap: 6675.38 Millions | |
| Recent Price: 182.35 Smart Investing & Trading Score: 32 | |
| Day Percent Change: 1.18% Day Change: 2.12 | |
| Week Change: 2.83% Year-to-date Change: 1.9% | |
| FFIV Links: Profile News Message Board | |
| Charts:- Daily , Weekly | |
| Add FFIV to Watchlist: View: Get FFIV Trend Analysis ➞ | |
 | CTRA Contura Energy, Inc. |
| Sector: Materials | |
| SubSector: Industrial Metals & Minerals | |
| MarketCap: 75.291 Millions | |
| Recent Price: 28.46 Smart Investing & Trading Score: 88 | |
| Day Percent Change: 1.17% Day Change: 0.33 | |
| Week Change: 2.56% Year-to-date Change: 11.5% | |
| CTRA Links: Profile News Message Board | |
| Charts:- Daily , Weekly | |
| Add CTRA to Watchlist: View: Get CTRA Trend Analysis ➞ | |
 | MOH Molina Healthcare, Inc. |
| Sector: Health Care | |
| SubSector: Health Care Plans | |
| MarketCap: 7235.6 Millions | |
| Recent Price: 367.41 Smart Investing & Trading Score: 43 | |
| Day Percent Change: 1.15% Day Change: 4.19 | |
| Week Change: -0.03% Year-to-date Change: 1.7% | |
| MOH Links: Profile News Message Board | |
| Charts:- Daily , Weekly | |
| Add MOH to Watchlist: View: Get MOH Trend Analysis ➞ | |
 | CPRT Copart, Inc. |
| Sector: Services & Goods | |
| SubSector: Auto Dealerships | |
| MarketCap: 15462.1 Millions | |
| Recent Price: 54.93 Smart Investing & Trading Score: 58 | |
| Day Percent Change: 1.14% Day Change: 0.62 | |
| Week Change: 3.88% Year-to-date Change: 12.1% | |
| CPRT Links: Profile News Message Board | |
| Charts:- Daily , Weekly | |
| Add CPRT to Watchlist: View: Get CPRT Trend Analysis ➞ | |
 | GIS General Mills, Inc. |
| Sector: Consumer Staples | |
| SubSector: Processed & Packaged Goods | |
| MarketCap: 34131.7 Millions | |
| Recent Price: 71.61 Smart Investing & Trading Score: 100 | |
| Day Percent Change: 1.12% Day Change: 0.79 | |
| Week Change: 1.69% Year-to-date Change: 9.9% | |
| GIS Links: Profile News Message Board | |
| Charts:- Daily , Weekly | |
| Add GIS to Watchlist: View: Get GIS Trend Analysis ➞ | |
| For tabular summary view of above stock list: Summary View ➞ 0 - 25 , 25 - 50 , 50 - 75 , 75 - 100 , 100 - 125 , 125 - 150 , 150 - 175 , 175 - 200 , 200 - 225 , 225 - 250 , 250 - 275 , 275 - 300 , 300 - 325 , 325 - 350 , 350 - 375 , 375 - 400 , 400 - 425 , 425 - 450 , 450 - 475 , 475 - 500 | ||
| Click To Change The Sort Order: By Market Cap or Company Size Performance: Year-to-date, Week and Day | |
| Select Chart Type: | ||
|
Best Stocks Today 12Stocks.com |
© 2024 12Stocks.com Terms & Conditions Privacy Contact Us
All Information Provided Only For Education And Not To Be Used For Investing or Trading. See Terms & Conditions


One More Thing ... Get Best Stocks Delivered Daily!
Never Ever Miss A Move With Our Top Ten Stocks Lists
Find Best Stocks In Any Market - Bull or Bear Market
Take A Peek At Our Top Ten Stocks Lists: Daily, Weekly, Year-to-Date & Top Trends
Find Best Stocks In Any Market - Bull or Bear Market
Take A Peek At Our Top Ten Stocks Lists: Daily, Weekly, Year-to-Date & Top Trends
S&P 500 Stocks With Best Up Trends [0-bearish to 100-bullish]: Hasbro [100], Wabtec [100], Boston Scientific[100], Texas Instruments[100], Microchip [100], Synchrony Financial[100], EQT [100], PepsiCo [100], Analog Devices[100], Equity Residential[100], Essex Property[100]
Best S&P 500 Stocks Year-to-Date:
NVIDIA [60.89%], Constellation [59.4%], NRG [40.44%], Meta Platforms[39.4%], Targa Resources[34.57%], Marathon [34.23%], Progressive [33.22%], Western Digital[32.81%], Eaton [32.38%], Diamondback [32.34%], Micron [30.98%] Best S&P 500 Stocks This Week:
Globe Life[17.77%], Hasbro [17.66%], Wabtec [13.32%], Microchip [11.02%], Tesla [10.26%], Texas Instruments[9.48%], NXP Semiconductors[9.26%], CoStar [9.13%], Kimberly-Clark [8.63%], Monolithic Power[8.57%], Synchrony Financial[8.3%] Best S&P 500 Stocks Daily:
Tesla [12.06%], Hasbro [11.85%], Wabtec [10.04%], CoStar [8.66%], ON Semiconductor[6.24%], Boston Scientific[5.68%], Texas Instruments[5.64%], Microchip [5.21%], Monolithic Power[5.04%], Synchrony Financial[5.04%], Biogen [4.56%]