
 Login Sign Up


| |||||
 |  | ||||

| 12Stocks.com Market Intelligence |
Best S&P 500 Stocks
|
On this page, you will find the most comprehensive analysis of S&P 500 stocks and ETFs - from latest trends to performances to charts ➞. First, here are the year-to-date (YTD) performances of the most requested S&P 500 stocks at 12Stocks.com (click stock for review):
| NVIDIA 67% | ||
| Caterpillar 21% | ||
| Amazon.com 16% | ||
| Merck 15% | ||
| Walmart 13% | ||
| Google 11% | ||
| JPMorgan Chase 8% | ||
| Chevron 8% | ||
| Microsoft 7% | ||
| Goldman Sachs 5% | ||
| Johnson & Johnson -7% | ||
| Starbucks -8% | ||
| McDonald s -8% | ||
| Apple -14% | ||
| Gilead -18% | ||
| Intel -31% | ||
| Boeing -34% | ||
| Quick: S&P 500 Stocks Lists: Performances & Trends, S&P 500 Stock Charts
Sort S&P 500 stocks: Daily, Weekly, Year-to-Date, Market Cap & Trends. Filter S&P 500 stocks list by sector: Show all, Tech, Finance, Energy, Staples, Retail, Industrial, Materials, Utilities and HealthCare |
| 12Stocks.com S&P 500 Stocks Performances & Trends Daily Report | |||||||||
|
| 
The overall Smart Investing & Trading Score is 36 (0-bearish to 100-bullish) which puts S&P 500 index in short term bearish to neutral trend. The Smart Investing & Trading Score from previous trading session is 26 and an improvement of trend continues. | ||||||||
Here are the Smart Investing & Trading Scores of the most requested S&P 500 stocks at 12Stocks.com (click stock name for detailed review):
|


| 12Stocks.com: Top Performing S&P 500 Index Stocks | ||||||||||||||||||||||||||||||||||||||||||||||||
 The top performing S&P 500 Index stocks year to date are
Now, more recently, over last week, the top performing S&P 500 Index stocks on the move are


|
||||||||||||||||||||||||||||||||||||||||||||||||
| 12Stocks.com: Investing in S&P 500 Index with Stocks | |
|
The following table helps investors and traders sort through current performance and trends (as measured by Smart Investing & Trading Score) of various
stocks in the S&P 500 Index. Quick View: Move mouse or cursor over stock symbol (ticker) to view short-term technical chart and over stock name to view long term chart. Click on  to add stock symbol to your watchlist and to add stock symbol to your watchlist and  to view watchlist. Click on any ticker or stock name for detailed market intelligence report for that stock. to view watchlist. Click on any ticker or stock name for detailed market intelligence report for that stock. |
12Stocks.com Performance of Stocks in S&P 500 Index
| Ticker | Stock Name | Watchlist | Category | Recent Price | Smart Investing & Trading Score | Change % | YTD Change% |
| TMO | Thermo Fisher |   | Health Care | 543.25 | 46 | 0.32 | 2.35% |
| IQV | IQVIA Holdings | | Health Care | 227.89 | 44 | 0.32 | -1.51% |
| TECH | Bio-Techne | | Health Care | 62.40 | 27 | 0.31 | -19.13% |
| NKE | NIKE | | Consumer Staples | 96.04 | 74 | 0.31 | -11.54% |
| CE | Celanese | | Materials | 155.10 | 51 | 0.31 | -0.17% |
| PTC | PTC | | Technology | 176.23 | 10 | 0.30 | 0.73% |
| OTIS | Otis Worldwide | | Industrials | 95.78 | 49 | 0.30 | 7.05% |
| MAR | Marriott | | Services & Goods | 236.99 | 0 | 0.29 | 5.09% |
| MTD | Mettler-Toledo | | Health Care | 1196.00 | 33 | 0.29 | -1.40% |
| KDP | Keurig Dr | | Consumer Staples | 31.22 | 87 | 0.29 | -6.30% |
| PSA | Public Storage | | Financials | 261.02 | 18 | 0.28 | -14.42% |
| CDW | CDW | | Technology | 236.35 | 36 | 0.28 | 3.97% |
| MCK | McKesson | | Services & Goods | 520.15 | 36 | 0.26 | 12.35% |
| SWK | Stanley Black | | Industrials | 89.55 | 18 | 0.26 | -8.72% |
| MSCI | MSCI | | Technology | 507.06 | 10 | 0.26 | -10.36% |
| NDAQ | Nasdaq | | Financials | 60.22 | 54 | 0.25 | 3.58% |
| TFX | Teleflex | | Health Care | 207.89 | 10 | 0.25 | -16.62% |
| APH | Amphenol | | Technology | 111.16 | 41 | 0.25 | 12.14% |
| PWR | Quanta Services | | Industrials | 246.26 | 48 | 0.24 | 14.11% |
| EXR | Extra Space | | Financials | 134.51 | 20 | 0.23 | -16.10% |
| CSGP | CoStar | | Financials | 84.37 | 36 | 0.23 | -3.46% |
| LIN | Linde | | Materials | 447.47 | 44 | 0.23 | 8.95% |
| IEX | IDEX | | Industrials | 226.59 | 36 | 0.22 | 4.37% |
| POOL | Pool | | Consumer Staples | 363.69 | 10 | 0.22 | -8.78% |
| CTLT | Catalent | | Health Care | 55.92 | 61 | 0.22 | 24.46% |
| For chart view version of above stock list: Chart View ➞ 0 - 25 , 25 - 50 , 50 - 75 , 75 - 100 , 100 - 125 , 125 - 150 , 150 - 175 , 175 - 200 , 200 - 225 , 225 - 250 , 250 - 275 , 275 - 300 , 300 - 325 , 325 - 350 , 350 - 375 , 375 - 400 , 400 - 425 , 425 - 450 , 450 - 475 , 475 - 500 | ||
 | Click To Change The Sort Order: By Market Cap or Company Size Performance: Year-to-date, Week and Day |  |
|
Get the most comprehensive stock market coverage daily at 12Stocks.com ➞ Best Stocks Today ➞ Best Stocks Weekly ➞ Best Stocks Year-to-Date ➞ Best Stocks Trends ➞  Best Stocks Today 12Stocks.com Best Nasdaq Stocks ➞ Best S&P 500 Stocks ➞ Best Tech Stocks ➞ Best Biotech Stocks ➞ |
| Detailed Overview of S&P 500 Stocks |
| S&P 500 Technical Overview, Leaders & Laggards, Top S&P 500 ETF Funds & Detailed S&P 500 Stocks List, Charts, Trends & More |
| S&P 500: Technical Analysis, Trends & YTD Performance | |
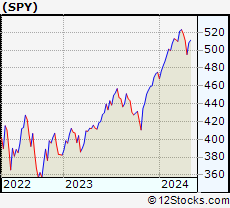
| S&P 500 index as represented by
SPY, an exchange-traded fund [ETF], holds basket of five hundred (mostly largecap) stocks from across all major sectors of the US stock market. The S&P 500 index (contains stocks like Apple and Exxon) is up by 4.95% and is currently outperforming the overall market by 0.87% year-to-date. Below is a quick view of technical charts and trends: | |
 SPY Weekly Chart |
|
| Long Term Trend: Good | |
| Medium Term Trend: Not Good | |
 SPY Daily Chart |
|
| Short Term Trend: Deteriorating | |
| Overall Trend Score: 36 | |
| YTD Performance: 4.95% | |
| **Trend Scores & Views Are Only For Educational Purposes And Not For Investing | |
| 12Stocks.com: Investing in S&P 500 Index using Exchange Traded Funds | |
|
The following table shows list of key exchange traded funds (ETF) that
help investors track S&P 500 index. The following list also includes leveraged ETF funds that track twice or thrice the daily returns of S&P 500 indices. Short or inverse ETF funds move in the opposite direction to the index they track and are useful during market pullbacks or during bear markets. Quick View: Move mouse or cursor over ETF symbol (ticker) to view short-term technical chart and over ETF name to view long term chart. Click on ticker or stock name for detailed view. Click on to add stock symbol to your watchlist and to view watchlist. |
12Stocks.com List of ETFs that track S&P 500 Index
| Ticker | ETF Name | Watchlist | Recent Price | Smart Investing & Trading Score | Change % | Week % | Year-to-date % |
| SPY | SPDR S&P 500 ETF | | 498.82 | 36 | -0.14 | -2.35 | 4.95% |
| OEF | iShares S&P 100 | | 236.60 | 36 | -0.43 | -2.69 | 5.91% |
| SSO | ProShares Ultra S&P500 | | 70.13 | 36 | -0.28 | -4.79 | 7.78% |
| UPRO | ProShares UltraPro S&P500 | | 60.52 | 36 | -0.43 | -7.18 | 10.56% |
| SH | ProShares Short S&P500 | | 12.50 | 69 | 0.24 | 2.54 | -3.77% |
| SDS | ProShares UltraShort S&P500 | | 27.50 | 69 | 0.33 | 5.08 | -8.09% |
| SPXU | ProShares UltraPro Short S&P500 | | 37.53 | 64 | 0.54 | 7.66 | -12.72% |
| 12Stocks.com: Charts, Trends, Fundamental Data and Performances of S&P 500 Stocks | |
|
We now take in-depth look at all S&P 500 stocks including charts, multi-period performances and overall trends (as measured by Smart Investing & Trading Score). One can sort S&P 500 stocks (click link to choose) by Daily, Weekly and by Year-to-Date performances. Also, one can sort by size of the company or by market capitalization. |
| Select Your Default Chart Type: | |||||
| |||||
| Click on stock symbol or name for detailed view. Click on to add stock symbol to your watchlist and to view watchlist. Quick View: Move mouse or cursor over "Daily" to quickly view daily technical stock chart and over "Weekly" to view weekly technical stock chart. | |||||

 | TMO Thermo Fisher Scientific Inc. |
| Sector: Health Care | |
| SubSector: Medical Laboratories & Research | |
| MarketCap: 112999 Millions | |
| Recent Price: 543.25 Smart Investing & Trading Score: 46 | |
| Day Percent Change: 0.32% Day Change: 1.73 | |
| Week Change: -3.89% Year-to-date Change: 2.4% | |
| TMO Links: Profile News Message Board | |
| Charts:- Daily , Weekly | |
| Add TMO to Watchlist: View: Get TMO Trend Analysis ➞ | |
 | IQV IQVIA Holdings Inc. |
| Sector: Health Care | |
| SubSector: Medical Laboratories & Research | |
| MarketCap: 19616.5 Millions | |
| Recent Price: 227.89 Smart Investing & Trading Score: 44 | |
| Day Percent Change: 0.32% Day Change: 0.72 | |
| Week Change: -2.71% Year-to-date Change: -1.5% | |
| IQV Links: Profile News Message Board | |
| Charts:- Daily , Weekly | |
| Add IQV to Watchlist: View: Get IQV Trend Analysis ➞ | |
 | TECH Bio-Techne Corporation |
| Sector: Health Care | |
| SubSector: Biotechnology | |
| MarketCap: 6958.05 Millions | |
| Recent Price: 62.40 Smart Investing & Trading Score: 27 | |
| Day Percent Change: 0.31% Day Change: 0.19 | |
| Week Change: -6.49% Year-to-date Change: -19.1% | |
| TECH Links: Profile News Message Board | |
| Charts:- Daily , Weekly | |
| Add TECH to Watchlist: View: Get TECH Trend Analysis ➞ | |
 | NKE NIKE, Inc. |
| Sector: Consumer Staples | |
| SubSector: Textile - Apparel Footwear & Accessories | |
| MarketCap: 118918 Millions | |
| Recent Price: 96.04 Smart Investing & Trading Score: 74 | |
| Day Percent Change: 0.31% Day Change: 0.30 | |
| Week Change: 4.39% Year-to-date Change: -11.5% | |
| NKE Links: Profile News Message Board | |
| Charts:- Daily , Weekly | |
| Add NKE to Watchlist: View: Get NKE Trend Analysis ➞ | |
 | CE Celanese Corporation |
| Sector: Materials | |
| SubSector: Chemicals - Major Diversified | |
| MarketCap: 8521.06 Millions | |
| Recent Price: 155.10 Smart Investing & Trading Score: 51 | |
| Day Percent Change: 0.31% Day Change: 0.48 | |
| Week Change: -0.6% Year-to-date Change: -0.2% | |
| CE Links: Profile News Message Board | |
| Charts:- Daily , Weekly | |
| Add CE to Watchlist: View: Get CE Trend Analysis ➞ | |
 | PTC PTC Inc. |
| Sector: Technology | |
| SubSector: Technical & System Software | |
| MarketCap: 6166.7 Millions | |
| Recent Price: 176.23 Smart Investing & Trading Score: 10 | |
| Day Percent Change: 0.30% Day Change: 0.53 | |
| Week Change: -2.13% Year-to-date Change: 0.7% | |
| PTC Links: Profile News Message Board | |
| Charts:- Daily , Weekly | |
| Add PTC to Watchlist: View: Get PTC Trend Analysis ➞ | |
 | OTIS Otis Worldwide Corporation |
| Sector: Industrials | |
| SubSector: Specialty Industrial Machinery | |
| MarketCap: 27727 Millions | |
| Recent Price: 95.78 Smart Investing & Trading Score: 49 | |
| Day Percent Change: 0.30% Day Change: 0.29 | |
| Week Change: -0.4% Year-to-date Change: 7.1% | |
| OTIS Links: Profile News Message Board | |
| Charts:- Daily , Weekly | |
| Add OTIS to Watchlist: View: Get OTIS Trend Analysis ➞ | |
 | MAR Marriott International, Inc. |
| Sector: Services & Goods | |
| SubSector: Lodging | |
| MarketCap: 25831.6 Millions | |
| Recent Price: 236.99 Smart Investing & Trading Score: 0 | |
| Day Percent Change: 0.29% Day Change: 0.69 | |
| Week Change: -5.6% Year-to-date Change: 5.1% | |
| MAR Links: Profile News Message Board | |
| Charts:- Daily , Weekly | |
| Add MAR to Watchlist: View: Get MAR Trend Analysis ➞ | |
 | MTD Mettler-Toledo International Inc. |
| Sector: Health Care | |
| SubSector: Medical Instruments & Supplies | |
| MarketCap: 15973.1 Millions | |
| Recent Price: 1196.00 Smart Investing & Trading Score: 33 | |
| Day Percent Change: 0.29% Day Change: 3.44 | |
| Week Change: -5.16% Year-to-date Change: -1.4% | |
| MTD Links: Profile News Message Board | |
| Charts:- Daily , Weekly | |
| Add MTD to Watchlist: View: Get MTD Trend Analysis ➞ | |
 | KDP Keurig Dr Pepper Inc. |
| Sector: Consumer Staples | |
| SubSector: Beverages - Soft Drinks | |
| MarketCap: 35295.2 Millions | |
| Recent Price: 31.22 Smart Investing & Trading Score: 87 | |
| Day Percent Change: 0.29% Day Change: 0.09 | |
| Week Change: 3.31% Year-to-date Change: -6.3% | |
| KDP Links: Profile News Message Board | |
| Charts:- Daily , Weekly | |
| Add KDP to Watchlist: View: Get KDP Trend Analysis ➞ | |
 | PSA Public Storage |
| Sector: Financials | |
| SubSector: REIT - Industrial | |
| MarketCap: 32733.9 Millions | |
| Recent Price: 261.02 Smart Investing & Trading Score: 18 | |
| Day Percent Change: 0.28% Day Change: 0.74 | |
| Week Change: -4.09% Year-to-date Change: -14.4% | |
| PSA Links: Profile News Message Board | |
| Charts:- Daily , Weekly | |
| Add PSA to Watchlist: View: Get PSA Trend Analysis ➞ | |
 | CDW CDW Corporation |
| Sector: Technology | |
| SubSector: Information Technology Services | |
| MarketCap: 12775 Millions | |
| Recent Price: 236.35 Smart Investing & Trading Score: 36 | |
| Day Percent Change: 0.28% Day Change: 0.66 | |
| Week Change: -2.7% Year-to-date Change: 4.0% | |
| CDW Links: Profile News Message Board | |
| Charts:- Daily , Weekly | |
| Add CDW to Watchlist: View: Get CDW Trend Analysis ➞ | |
 | MCK McKesson Corporation |
| Sector: Services & Goods | |
| SubSector: Drugs Wholesale | |
| MarketCap: 24096.7 Millions | |
| Recent Price: 520.15 Smart Investing & Trading Score: 36 | |
| Day Percent Change: 0.26% Day Change: 1.34 | |
| Week Change: -0.55% Year-to-date Change: 12.4% | |
| MCK Links: Profile News Message Board | |
| Charts:- Daily , Weekly | |
| Add MCK to Watchlist: View: Get MCK Trend Analysis ➞ | |
 | SWK Stanley Black & Decker, Inc. |
| Sector: Industrials | |
| SubSector: Machine Tools & Accessories | |
| MarketCap: 14274.8 Millions | |
| Recent Price: 89.55 Smart Investing & Trading Score: 18 | |
| Day Percent Change: 0.26% Day Change: 0.23 | |
| Week Change: -2.11% Year-to-date Change: -8.7% | |
| SWK Links: Profile News Message Board | |
| Charts:- Daily , Weekly | |
| Add SWK to Watchlist: View: Get SWK Trend Analysis ➞ | |
 | MSCI MSCI Inc. |
| Sector: Technology | |
| SubSector: Processing Systems & Products | |
| MarketCap: 21086.3 Millions | |
| Recent Price: 507.06 Smart Investing & Trading Score: 10 | |
| Day Percent Change: 0.26% Day Change: 1.30 | |
| Week Change: -3.71% Year-to-date Change: -10.4% | |
| MSCI Links: Profile News Message Board | |
| Charts:- Daily , Weekly | |
| Add MSCI to Watchlist: View: Get MSCI Trend Analysis ➞ | |
 | NDAQ Nasdaq, Inc. |
| Sector: Financials | |
| SubSector: Diversified Investments | |
| MarketCap: 14885.2 Millions | |
| Recent Price: 60.22 Smart Investing & Trading Score: 54 | |
| Day Percent Change: 0.25% Day Change: 0.15 | |
| Week Change: -2.11% Year-to-date Change: 3.6% | |
| NDAQ Links: Profile News Message Board | |
| Charts:- Daily , Weekly | |
| Add NDAQ to Watchlist: View: Get NDAQ Trend Analysis ➞ | |
 | TFX Teleflex Incorporated |
| Sector: Health Care | |
| SubSector: Medical Instruments & Supplies | |
| MarketCap: 12989.3 Millions | |
| Recent Price: 207.89 Smart Investing & Trading Score: 10 | |
| Day Percent Change: 0.25% Day Change: 0.51 | |
| Week Change: -3.05% Year-to-date Change: -16.6% | |
| TFX Links: Profile News Message Board | |
| Charts:- Daily , Weekly | |
| Add TFX to Watchlist: View: Get TFX Trend Analysis ➞ | |
 | APH Amphenol Corporation |
| Sector: Technology | |
| SubSector: Diversified Electronics | |
| MarketCap: 23422 Millions | |
| Recent Price: 111.16 Smart Investing & Trading Score: 41 | |
| Day Percent Change: 0.25% Day Change: 0.28 | |
| Week Change: -1.91% Year-to-date Change: 12.1% | |
| APH Links: Profile News Message Board | |
| Charts:- Daily , Weekly | |
| Add APH to Watchlist: View: Get APH Trend Analysis ➞ | |
 | PWR Quanta Services, Inc. |
| Sector: Industrials | |
| SubSector: General Contractors | |
| MarketCap: 3936.63 Millions | |
| Recent Price: 246.26 Smart Investing & Trading Score: 48 | |
| Day Percent Change: 0.24% Day Change: 0.58 | |
| Week Change: -3.31% Year-to-date Change: 14.1% | |
| PWR Links: Profile News Message Board | |
| Charts:- Daily , Weekly | |
| Add PWR to Watchlist: View: Get PWR Trend Analysis ➞ | |
 | EXR Extra Space Storage Inc. |
| Sector: Financials | |
| SubSector: REIT - Industrial | |
| MarketCap: 11203.9 Millions | |
| Recent Price: 134.51 Smart Investing & Trading Score: 20 | |
| Day Percent Change: 0.23% Day Change: 0.31 | |
| Week Change: -4.39% Year-to-date Change: -16.1% | |
| EXR Links: Profile News Message Board | |
| Charts:- Daily , Weekly | |
| Add EXR to Watchlist: View: Get EXR Trend Analysis ➞ | |
 | CSGP CoStar Group, Inc. |
| Sector: Financials | |
| SubSector: Property Management | |
| MarketCap: 21454.4 Millions | |
| Recent Price: 84.37 Smart Investing & Trading Score: 36 | |
| Day Percent Change: 0.23% Day Change: 0.19 | |
| Week Change: -6.61% Year-to-date Change: -3.5% | |
| CSGP Links: Profile News Message Board | |
| Charts:- Daily , Weekly | |
| Add CSGP to Watchlist: View: Get CSGP Trend Analysis ➞ | |
 | LIN Linde plc |
| Sector: Materials | |
| SubSector: Specialty Chemicals | |
| MarketCap: 88539.2 Millions | |
| Recent Price: 447.47 Smart Investing & Trading Score: 44 | |
| Day Percent Change: 0.23% Day Change: 1.04 | |
| Week Change: 0.01% Year-to-date Change: 9.0% | |
| LIN Links: Profile News Message Board | |
| Charts:- Daily , Weekly | |
| Add LIN to Watchlist: View: Get LIN Trend Analysis ➞ | |
 | IEX IDEX Corporation |
| Sector: Industrials | |
| SubSector: Diversified Machinery | |
| MarketCap: 9721.46 Millions | |
| Recent Price: 226.59 Smart Investing & Trading Score: 36 | |
| Day Percent Change: 0.22% Day Change: 0.49 | |
| Week Change: -2.61% Year-to-date Change: 4.4% | |
| IEX Links: Profile News Message Board | |
| Charts:- Daily , Weekly | |
| Add IEX to Watchlist: View: Get IEX Trend Analysis ➞ | |
 | POOL Pool Corporation |
| Sector: Consumer Staples | |
| SubSector: Sporting Goods | |
| MarketCap: 7479.64 Millions | |
| Recent Price: 363.69 Smart Investing & Trading Score: 10 | |
| Day Percent Change: 0.22% Day Change: 0.78 | |
| Week Change: -4.34% Year-to-date Change: -8.8% | |
| POOL Links: Profile News Message Board | |
| Charts:- Daily , Weekly | |
| Add POOL to Watchlist: View: Get POOL Trend Analysis ➞ | |
 | CTLT Catalent, Inc. |
| Sector: Health Care | |
| SubSector: Drugs - Generic | |
| MarketCap: 6351.95 Millions | |
| Recent Price: 55.92 Smart Investing & Trading Score: 61 | |
| Day Percent Change: 0.22% Day Change: 0.12 | |
| Week Change: -0.67% Year-to-date Change: 24.5% | |
| CTLT Links: Profile News Message Board | |
| Charts:- Daily , Weekly | |
| Add CTLT to Watchlist: View: Get CTLT Trend Analysis ➞ | |
| For tabular summary view of above stock list: Summary View ➞ 0 - 25 , 25 - 50 , 50 - 75 , 75 - 100 , 100 - 125 , 125 - 150 , 150 - 175 , 175 - 200 , 200 - 225 , 225 - 250 , 250 - 275 , 275 - 300 , 300 - 325 , 325 - 350 , 350 - 375 , 375 - 400 , 400 - 425 , 425 - 450 , 450 - 475 , 475 - 500 | ||
| Click To Change The Sort Order: By Market Cap or Company Size Performance: Year-to-date, Week and Day | |
| Select Chart Type: | ||
|
Best Stocks Today 12Stocks.com |
© 2024 12Stocks.com Terms & Conditions Privacy Contact Us
All Information Provided Only For Education And Not To Be Used For Investing or Trading. See Terms & Conditions


One More Thing ... Get Best Stocks Delivered Daily!
Never Ever Miss A Move With Our Top Ten Stocks Lists
Find Best Stocks In Any Market - Bull or Bear Market
Take A Peek At Our Top Ten Stocks Lists: Daily, Weekly, Year-to-Date & Top Trends
Find Best Stocks In Any Market - Bull or Bear Market
Take A Peek At Our Top Ten Stocks Lists: Daily, Weekly, Year-to-Date & Top Trends
S&P 500 Stocks With Best Up Trends [0-bearish to 100-bullish]: Kinder Morgan[100], Wells Fargo[100], Bunge [100], Consolidated Edison[100], Lockheed Martin[100], Charles Schwab[100], Conagra Brands[100], Genuine Parts[100], United Airlines[100], Dominion [95], Progressive [95]
Best S&P 500 Stocks Year-to-Date:
NVIDIA [66.66%], Constellation [57.45%], Meta Platforms[38.28%], NRG [36.11%], Progressive [34.35%], Marathon [33.2%], Targa Resources[31.03%], Diamondback [30.74%], Western Digital[29.2%], Eaton [28.4%], Micron [27.36%] Best S&P 500 Stocks This Week:
United Airlines[23.18%], UnitedHealth [14.33%], Genuine Parts[10.93%], Globe Life[10.86%], American Airlines[8.4%], ProShares UltraPro[7.66%], Southwest Airlines[7.43%], Wells Fargo[7.31%], V.F [6.11%], Morgan Stanley[5.88%], Centene [5.68%] Best S&P 500 Stocks Daily:
Fifth Third[5.13%], American Express[4.47%], Kinder Morgan[3.51%], Bank of America[3.40%], Wells Fargo[3.17%], Bunge [2.96%], PNC Financial[2.77%], Generac Holdings[2.63%], Synchrony Financial[2.48%], Citizens Financial[2.46%], Truist Financial[2.42%]