
 Login Sign Up


| |||||
 |  | ||||

| 12Stocks.com Market Intelligence |
Best S&P 500 Stocks
|
On this page, you will find the most comprehensive analysis of S&P 500 stocks and ETFs - from latest trends to performances to charts ➞. First, here are the year-to-date (YTD) performances of the most requested S&P 500 stocks at 12Stocks.com (click stock for review):
| NVIDIA 71% | ||
| Caterpillar 21% | ||
| Amazon.com 18% | ||
| Merck 15% | ||
| Walmart 13% | ||
| Google 12% | ||
| Microsoft 8% | ||
| JPMorgan Chase 7% | ||
| Chevron 6% | ||
| Goldman Sachs 4% | ||
| Johnson & Johnson -7% | ||
| McDonald s -9% | ||
| Starbucks -9% | ||
| Apple -13% | ||
| Gilead -18% | ||
| Intel -30% | ||
| Boeing -35% | ||
| Quick: S&P 500 Stocks Lists: Performances & Trends, S&P 500 Stock Charts
Sort S&P 500 stocks: Daily, Weekly, Year-to-Date, Market Cap & Trends. Filter S&P 500 stocks list by sector: Show all, Tech, Finance, Energy, Staples, Retail, Industrial, Materials, Utilities and HealthCare |
| 12Stocks.com S&P 500 Stocks Performances & Trends Daily Report | |||||||||
|
| 
The overall Smart Investing & Trading Score is 36 (0-bearish to 100-bullish) which puts S&P 500 index in short term bearish to neutral trend. The Smart Investing & Trading Score from previous trading session is 26 and hence an improvement of trend. | ||||||||
Here are the Smart Investing & Trading Scores of the most requested S&P 500 stocks at 12Stocks.com (click stock name for detailed review):
|


| 12Stocks.com: Top Performing S&P 500 Index Stocks | ||||||||||||||||||||||||||||||||||||||||||||||||
 The top performing S&P 500 Index stocks year to date are
Now, more recently, over last week, the top performing S&P 500 Index stocks on the move are


|
||||||||||||||||||||||||||||||||||||||||||||||||
| 12Stocks.com: Investing in S&P 500 Index with Stocks | |
|
The following table helps investors and traders sort through current performance and trends (as measured by Smart Investing & Trading Score) of various
stocks in the S&P 500 Index. Quick View: Move mouse or cursor over stock symbol (ticker) to view short-term technical chart and over stock name to view long term chart. Click on  to add stock symbol to your watchlist and to add stock symbol to your watchlist and  to view watchlist. Click on any ticker or stock name for detailed market intelligence report for that stock. to view watchlist. Click on any ticker or stock name for detailed market intelligence report for that stock. |
12Stocks.com Performance of Stocks in S&P 500 Index
| Ticker | Stock Name | Watchlist | Category | Recent Price | Smart Investing & Trading Score | Change % | YTD Change% |
| QRVO | Qorvo |   | Technology | 107.84 | 39 | -1.92 | -4.24% |
| ADSK | Autodesk | | Technology | 210.63 | 0 | -2.00 | -13.49% |
| KEYS | Keysight Technologies | | Technology | 146.89 | 10 | -2.03 | -7.67% |
| STLD | Steel Dynamics | | Materials | 136.07 | 31 | -2.06 | 15.22% |
| FSLR | First Solar | | Technology | 174.29 | 63 | -2.09 | 1.17% |
| KLAC | KLA | | Technology | 644.22 | 26 | -2.24 | 10.82% |
| ORCL | Oracle | | Technology | 116.00 | 26 | -2.25 | 10.03% |
| ALB | Albemarle | | Materials | 111.80 | 10 | -2.26 | -22.62% |
| BX | Blackstone | | Financials | 120.32 | 8 | -2.33 | -8.10% |
| JBHT | J.B. Hunt | | Transports | 164.20 | 0 | -2.34 | -17.79% |
| LYV | Live Nation | | Services & Goods | 89.64 | 26 | -2.37 | -4.23% |
| ON | ON Semiconductor | | Technology | 62.93 | 10 | -2.39 | -24.66% |
| TROW | T. Rowe | | Financials | 108.72 | 18 | -2.40 | 0.96% |
| PSX | Phillips 66 | | Energy | 153.31 | 31 | -2.51 | 15.15% |
| SYK | Stryker | | Health Care | 327.45 | 0 | -2.55 | 9.35% |
| LRCX | Lam Research | | Technology | 888.92 | 26 | -2.56 | 13.49% |
| ENPH | Enphase | | Technology | 109.17 | 36 | -2.57 | -17.38% |
| WDC | Western Digital | | Technology | 68.32 | 44 | -2.64 | 30.46% |
| CDNS | Cadence Design | | Technology | 285.90 | 0 | -2.66 | 4.97% |
| MPWR | Monolithic Power | | Technology | 620.31 | 26 | -2.73 | -1.66% |
| AMAT | Applied Materials | | Technology | 194.32 | 26 | -2.79 | 19.90% |
| VLO | Valero | | Energy | 162.49 | 36 | -2.86 | 24.99% |
| WAT | Waters | | Health Care | 294.23 | 0 | -3.27 | -10.63% |
| NXPI | NXP Semiconductors | | Technology | 219.35 | 26 | -3.34 | -4.50% |
| BIO | Bio-Rad | | Health Care | 281.02 | 0 | -3.38 | -12.97% |
| For chart view version of above stock list: Chart View ➞ 0 - 25 , 25 - 50 , 50 - 75 , 75 - 100 , 100 - 125 , 125 - 150 , 150 - 175 , 175 - 200 , 200 - 225 , 225 - 250 , 250 - 275 , 275 - 300 , 300 - 325 , 325 - 350 , 350 - 375 , 375 - 400 , 400 - 425 , 425 - 450 , 450 - 475 , 475 - 500 | ||
 | Click To Change The Sort Order: By Market Cap or Company Size Performance: Year-to-date, Week and Day |  |
|
Get the most comprehensive stock market coverage daily at 12Stocks.com ➞ Best Stocks Today ➞ Best Stocks Weekly ➞ Best Stocks Year-to-Date ➞ Best Stocks Trends ➞  Best Stocks Today 12Stocks.com Best Nasdaq Stocks ➞ Best S&P 500 Stocks ➞ Best Tech Stocks ➞ Best Biotech Stocks ➞ |
| Detailed Overview of S&P 500 Stocks |
| S&P 500 Technical Overview, Leaders & Laggards, Top S&P 500 ETF Funds & Detailed S&P 500 Stocks List, Charts, Trends & More |
| S&P 500: Technical Analysis, Trends & YTD Performance | |
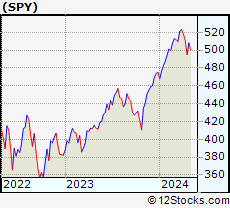
| S&P 500 index as represented by
SPY, an exchange-traded fund [ETF], holds basket of five hundred (mostly largecap) stocks from across all major sectors of the US stock market. The S&P 500 index (contains stocks like Apple and Exxon) is up by 5.09% and is currently outperforming the overall market by 0.9% year-to-date. Below is a quick view of technical charts and trends: | |
 SPY Weekly Chart |
|
| Long Term Trend: Good | |
| Medium Term Trend: Not Good | |
 SPY Daily Chart |
|
| Short Term Trend: Not Good | |
| Overall Trend Score: 36 | |
| YTD Performance: 5.09% | |
| **Trend Scores & Views Are Only For Educational Purposes And Not For Investing | |
| 12Stocks.com: Investing in S&P 500 Index using Exchange Traded Funds | |
|
The following table shows list of key exchange traded funds (ETF) that
help investors track S&P 500 index. The following list also includes leveraged ETF funds that track twice or thrice the daily returns of S&P 500 indices. Short or inverse ETF funds move in the opposite direction to the index they track and are useful during market pullbacks or during bear markets. Quick View: Move mouse or cursor over ETF symbol (ticker) to view short-term technical chart and over ETF name to view long term chart. Click on ticker or stock name for detailed view. Click on to add stock symbol to your watchlist and to view watchlist. |
12Stocks.com List of ETFs that track S&P 500 Index
| Ticker | ETF Name | Watchlist | Recent Price | Smart Investing & Trading Score | Change % | Week % | Year-to-date % |
| SPY | SPDR S&P 500 ETF | | 499.52 | 36 | -0.21 | -2.22 | 5.09% |
| IVV | iShares Core S&P 500 ETF | | 501.88 | 44 | -0.23 | -2.23 | 5.08% |
| VOO | Vanguard 500 ETF | | 458.94 | 44 | -0.23 | -2.26 | 5.07% |
| OEF | iShares S&P 100 | | 237.62 | 36 | -0.13 | -2.27 | 6.37% |
| SSO | ProShares Ultra S&P500 | | 70.33 | 36 | -0.47 | -4.52 | 8.08% |
| UPRO | ProShares UltraPro S&P500 | | 60.78 | 36 | -0.78 | -6.78 | 11.03% |
| SPXL | Direxion Daily S&P500 Bull 3X ETF | | 115.53 | 36 | -0.70 | -6.71 | 11.1% |
| SH | ProShares Short S&P500 | | 12.47 | 74 | 0.24 | 2.3 | -4% |
| SDS | ProShares UltraShort S&P500 | | 27.41 | 74 | 0.51 | 4.74 | -8.39% |
| SPXU | ProShares UltraPro Short S&P500 | | 37.33 | 69 | 0.70 | 7.09 | -13.19% |
| SPXS | Direxion Daily S&P 500 Bear 3X ETF | | 10.11 | 59 | 1.00 | 7.32 | -12.47% |
| 12Stocks.com: Charts, Trends, Fundamental Data and Performances of S&P 500 Stocks | |
|
We now take in-depth look at all S&P 500 stocks including charts, multi-period performances and overall trends (as measured by Smart Investing & Trading Score). One can sort S&P 500 stocks (click link to choose) by Daily, Weekly and by Year-to-Date performances. Also, one can sort by size of the company or by market capitalization. |
| Select Your Default Chart Type: | |||||
| |||||
| Click on stock symbol or name for detailed view. Click on to add stock symbol to your watchlist and to view watchlist. Quick View: Move mouse or cursor over "Daily" to quickly view daily technical stock chart and over "Weekly" to view weekly technical stock chart. | |||||

 | QRVO Qorvo, Inc. |
| Sector: Technology | |
| SubSector: Semiconductor - Broad Line | |
| MarketCap: 9524.32 Millions | |
| Recent Price: 107.84 Smart Investing & Trading Score: 39 | |
| Day Percent Change: -1.92% Day Change: -2.11 | |
| Week Change: -3.16% Year-to-date Change: -4.2% | |
| QRVO Links: Profile News Message Board | |
| Charts:- Daily , Weekly | |
| Add QRVO to Watchlist: View: Get QRVO Trend Analysis ➞ | |
 | ADSK Autodesk, Inc. |
| Sector: Technology | |
| SubSector: Technical & System Software | |
| MarketCap: 36975.8 Millions | |
| Recent Price: 210.63 Smart Investing & Trading Score: 0 | |
| Day Percent Change: -2.00% Day Change: -4.29 | |
| Week Change: -11.12% Year-to-date Change: -13.5% | |
| ADSK Links: Profile News Message Board | |
| Charts:- Daily , Weekly | |
| Add ADSK to Watchlist: View: Get ADSK Trend Analysis ➞ | |
 | KEYS Keysight Technologies, Inc. |
| Sector: Technology | |
| SubSector: Scientific & Technical Instruments | |
| MarketCap: 17355.1 Millions | |
| Recent Price: 146.89 Smart Investing & Trading Score: 10 | |
| Day Percent Change: -2.03% Day Change: -3.04 | |
| Week Change: -5.29% Year-to-date Change: -7.7% | |
| KEYS Links: Profile News Message Board | |
| Charts:- Daily , Weekly | |
| Add KEYS to Watchlist: View: Get KEYS Trend Analysis ➞ | |
 | STLD Steel Dynamics, Inc. |
| Sector: Materials | |
| SubSector: Steel & Iron | |
| MarketCap: 4533.58 Millions | |
| Recent Price: 136.07 Smart Investing & Trading Score: 31 | |
| Day Percent Change: -2.06% Day Change: -2.86 | |
| Week Change: -3.24% Year-to-date Change: 15.2% | |
| STLD Links: Profile News Message Board | |
| Charts:- Daily , Weekly | |
| Add STLD to Watchlist: View: Get STLD Trend Analysis ➞ | |
 | FSLR First Solar, Inc. |
| Sector: Technology | |
| SubSector: Semiconductor - Specialized | |
| MarketCap: 3617.9 Millions | |
| Recent Price: 174.29 Smart Investing & Trading Score: 63 | |
| Day Percent Change: -2.09% Day Change: -3.72 | |
| Week Change: -5.5% Year-to-date Change: 1.2% | |
| FSLR Links: Profile News Message Board | |
| Charts:- Daily , Weekly | |
| Add FSLR to Watchlist: View: Get FSLR Trend Analysis ➞ | |
 | KLAC KLA Corporation |
| Sector: Technology | |
| SubSector: Semiconductor Equipment & Materials | |
| MarketCap: 20663.8 Millions | |
| Recent Price: 644.22 Smart Investing & Trading Score: 26 | |
| Day Percent Change: -2.24% Day Change: -14.76 | |
| Week Change: -5.37% Year-to-date Change: 10.8% | |
| KLAC Links: Profile News Message Board | |
| Charts:- Daily , Weekly | |
| Add KLAC to Watchlist: View: Get KLAC Trend Analysis ➞ | |
 | ORCL Oracle Corporation |
| Sector: Technology | |
| SubSector: Application Software | |
| MarketCap: 164530 Millions | |
| Recent Price: 116.00 Smart Investing & Trading Score: 26 | |
| Day Percent Change: -2.25% Day Change: -2.67 | |
| Week Change: -4.22% Year-to-date Change: 10.0% | |
| ORCL Links: Profile News Message Board | |
| Charts:- Daily , Weekly | |
| Add ORCL to Watchlist: View: Get ORCL Trend Analysis ➞ | |
 | ALB Albemarle Corporation |
| Sector: Materials | |
| SubSector: Specialty Chemicals | |
| MarketCap: 6139.27 Millions | |
| Recent Price: 111.80 Smart Investing & Trading Score: 10 | |
| Day Percent Change: -2.26% Day Change: -2.59 | |
| Week Change: -8.79% Year-to-date Change: -22.6% | |
| ALB Links: Profile News Message Board | |
| Charts:- Daily , Weekly | |
| Add ALB to Watchlist: View: Get ALB Trend Analysis ➞ | |
 | BX The Blackstone Group Inc. |
| Sector: Financials | |
| SubSector: Asset Management | |
| MarketCap: 50957.7 Millions | |
| Recent Price: 120.32 Smart Investing & Trading Score: 8 | |
| Day Percent Change: -2.33% Day Change: -2.87 | |
| Week Change: -2.55% Year-to-date Change: -8.1% | |
| BX Links: Profile News Message Board | |
| Charts:- Daily , Weekly | |
| Add BX to Watchlist: View: Get BX Trend Analysis ➞ | |
 | JBHT J.B. Hunt Transport Services, Inc. |
| Sector: Transports | |
| SubSector: Trucking | |
| MarketCap: 9074 Millions | |
| Recent Price: 164.20 Smart Investing & Trading Score: 0 | |
| Day Percent Change: -2.34% Day Change: -3.93 | |
| Week Change: -11.47% Year-to-date Change: -17.8% | |
| JBHT Links: Profile News Message Board | |
| Charts:- Daily , Weekly | |
| Add JBHT to Watchlist: View: Get JBHT Trend Analysis ➞ | |
 | LYV Live Nation Entertainment, Inc. |
| Sector: Services & Goods | |
| SubSector: Entertainment - Diversified | |
| MarketCap: 8457.17 Millions | |
| Recent Price: 89.64 Smart Investing & Trading Score: 26 | |
| Day Percent Change: -2.37% Day Change: -2.18 | |
| Week Change: -11.28% Year-to-date Change: -4.2% | |
| LYV Links: Profile News Message Board | |
| Charts:- Daily , Weekly | |
| Add LYV to Watchlist: View: Get LYV Trend Analysis ➞ | |
 | ON ON Semiconductor Corporation |
| Sector: Technology | |
| SubSector: Semiconductor - Broad Line | |
| MarketCap: 5183.82 Millions | |
| Recent Price: 62.93 Smart Investing & Trading Score: 10 | |
| Day Percent Change: -2.39% Day Change: -1.54 | |
| Week Change: -5.57% Year-to-date Change: -24.7% | |
| ON Links: Profile News Message Board | |
| Charts:- Daily , Weekly | |
| Add ON to Watchlist: View: Get ON Trend Analysis ➞ | |
 | TROW T. Rowe Price Group, Inc. |
| Sector: Financials | |
| SubSector: Asset Management | |
| MarketCap: 24530 Millions | |
| Recent Price: 108.72 Smart Investing & Trading Score: 18 | |
| Day Percent Change: -2.40% Day Change: -2.67 | |
| Week Change: -5.62% Year-to-date Change: 1.0% | |
| TROW Links: Profile News Message Board | |
| Charts:- Daily , Weekly | |
| Add TROW to Watchlist: View: Get TROW Trend Analysis ➞ | |
 | PSX Phillips 66 |
| Sector: Energy | |
| SubSector: Oil & Gas Refining & Marketing | |
| MarketCap: 25253.6 Millions | |
| Recent Price: 153.31 Smart Investing & Trading Score: 31 | |
| Day Percent Change: -2.51% Day Change: -3.94 | |
| Week Change: -5.65% Year-to-date Change: 15.2% | |
| PSX Links: Profile News Message Board | |
| Charts:- Daily , Weekly | |
| Add PSX to Watchlist: View: Get PSX Trend Analysis ➞ | |
 | SYK Stryker Corporation |
| Sector: Health Care | |
| SubSector: Medical Appliances & Equipment | |
| MarketCap: 59441.3 Millions | |
| Recent Price: 327.45 Smart Investing & Trading Score: 0 | |
| Day Percent Change: -2.55% Day Change: -8.58 | |
| Week Change: -4.27% Year-to-date Change: 9.4% | |
| SYK Links: Profile News Message Board | |
| Charts:- Daily , Weekly | |
| Add SYK to Watchlist: View: Get SYK Trend Analysis ➞ | |
 | LRCX Lam Research Corporation |
| Sector: Technology | |
| SubSector: Semiconductor Equipment & Materials | |
| MarketCap: 31806 Millions | |
| Recent Price: 888.92 Smart Investing & Trading Score: 26 | |
| Day Percent Change: -2.56% Day Change: -23.34 | |
| Week Change: -7.12% Year-to-date Change: 13.5% | |
| LRCX Links: Profile News Message Board | |
| Charts:- Daily , Weekly | |
| Add LRCX to Watchlist: View: Get LRCX Trend Analysis ➞ | |
 | ENPH Enphase Energy, Inc. |
| Sector: Technology | |
| SubSector: Semiconductor Equipment & Materials | |
| MarketCap: 4047.48 Millions | |
| Recent Price: 109.17 Smart Investing & Trading Score: 36 | |
| Day Percent Change: -2.57% Day Change: -2.88 | |
| Week Change: -6.71% Year-to-date Change: -17.4% | |
| ENPH Links: Profile News Message Board | |
| Charts:- Daily , Weekly | |
| Add ENPH to Watchlist: View: Get ENPH Trend Analysis ➞ | |
 | WDC Western Digital Corporation |
| Sector: Technology | |
| SubSector: Data Storage Devices | |
| MarketCap: 10712.9 Millions | |
| Recent Price: 68.32 Smart Investing & Trading Score: 44 | |
| Day Percent Change: -2.64% Day Change: -1.85 | |
| Week Change: -5.18% Year-to-date Change: 30.5% | |
| WDC Links: Profile News Message Board | |
| Charts:- Daily , Weekly | |
| Add WDC to Watchlist: View: Get WDC Trend Analysis ➞ | |
 | CDNS Cadence Design Systems, Inc. |
| Sector: Technology | |
| SubSector: Application Software | |
| MarketCap: 16865.8 Millions | |
| Recent Price: 285.90 Smart Investing & Trading Score: 0 | |
| Day Percent Change: -2.66% Day Change: -7.81 | |
| Week Change: -6.52% Year-to-date Change: 5.0% | |
| CDNS Links: Profile News Message Board | |
| Charts:- Daily , Weekly | |
| Add CDNS to Watchlist: View: Get CDNS Trend Analysis ➞ | |
 | MPWR Monolithic Power Systems, Inc. |
| Sector: Technology | |
| SubSector: Semiconductor - Specialized | |
| MarketCap: 6436.4 Millions | |
| Recent Price: 620.31 Smart Investing & Trading Score: 26 | |
| Day Percent Change: -2.73% Day Change: -17.41 | |
| Week Change: -5.76% Year-to-date Change: -1.7% | |
| MPWR Links: Profile News Message Board | |
| Charts:- Daily , Weekly | |
| Add MPWR to Watchlist: View: Get MPWR Trend Analysis ➞ | |
 | AMAT Applied Materials, Inc. |
| Sector: Technology | |
| SubSector: Semiconductor Equipment & Materials | |
| MarketCap: 40593.8 Millions | |
| Recent Price: 194.32 Smart Investing & Trading Score: 26 | |
| Day Percent Change: -2.79% Day Change: -5.57 | |
| Week Change: -6.51% Year-to-date Change: 19.9% | |
| AMAT Links: Profile News Message Board | |
| Charts:- Daily , Weekly | |
| Add AMAT to Watchlist: View: Get AMAT Trend Analysis ➞ | |
 | VLO Valero Energy Corporation |
| Sector: Energy | |
| SubSector: Oil & Gas Refining & Marketing | |
| MarketCap: 19590.5 Millions | |
| Recent Price: 162.49 Smart Investing & Trading Score: 36 | |
| Day Percent Change: -2.86% Day Change: -4.79 | |
| Week Change: -6.37% Year-to-date Change: 25.0% | |
| VLO Links: Profile News Message Board | |
| Charts:- Daily , Weekly | |
| Add VLO to Watchlist: View: Get VLO Trend Analysis ➞ | |
 | WAT Waters Corporation |
| Sector: Health Care | |
| SubSector: Medical Instruments & Supplies | |
| MarketCap: 11882 Millions | |
| Recent Price: 294.23 Smart Investing & Trading Score: 0 | |
| Day Percent Change: -3.27% Day Change: -9.95 | |
| Week Change: -8.81% Year-to-date Change: -10.6% | |
| WAT Links: Profile News Message Board | |
| Charts:- Daily , Weekly | |
| Add WAT to Watchlist: View: Get WAT Trend Analysis ➞ | |
 | NXPI NXP Semiconductors N.V. |
| Sector: Technology | |
| SubSector: Semiconductor - Broad Line | |
| MarketCap: 22497.9 Millions | |
| Recent Price: 219.35 Smart Investing & Trading Score: 26 | |
| Day Percent Change: -3.34% Day Change: -7.57 | |
| Week Change: -6.1% Year-to-date Change: -4.5% | |
| NXPI Links: Profile News Message Board | |
| Charts:- Daily , Weekly | |
| Add NXPI to Watchlist: View: Get NXPI Trend Analysis ➞ | |
 | BIO Bio-Rad Laboratories, Inc. |
| Sector: Health Care | |
| SubSector: Medical Laboratories & Research | |
| MarketCap: 10660 Millions | |
| Recent Price: 281.02 Smart Investing & Trading Score: 0 | |
| Day Percent Change: -3.38% Day Change: -9.84 | |
| Week Change: -6.47% Year-to-date Change: -13.0% | |
| BIO Links: Profile News Message Board | |
| Charts:- Daily , Weekly | |
| Add BIO to Watchlist: View: Get BIO Trend Analysis ➞ | |
| For tabular summary view of above stock list: Summary View ➞ 0 - 25 , 25 - 50 , 50 - 75 , 75 - 100 , 100 - 125 , 125 - 150 , 150 - 175 , 175 - 200 , 200 - 225 , 225 - 250 , 250 - 275 , 275 - 300 , 300 - 325 , 325 - 350 , 350 - 375 , 375 - 400 , 400 - 425 , 425 - 450 , 450 - 475 , 475 - 500 | ||
| Click To Change The Sort Order: By Market Cap or Company Size Performance: Year-to-date, Week and Day | |
| Select Chart Type: | ||
|
Best Stocks Today 12Stocks.com |
© 2024 12Stocks.com Terms & Conditions Privacy Contact Us
All Information Provided Only For Education And Not To Be Used For Investing or Trading. See Terms & Conditions


One More Thing ... Get Best Stocks Delivered Daily!
Never Ever Miss A Move With Our Top Ten Stocks Lists
Find Best Stocks In Any Market - Bull or Bear Market
Take A Peek At Our Top Ten Stocks Lists: Daily, Weekly, Year-to-Date & Top Trends
Find Best Stocks In Any Market - Bull or Bear Market
Take A Peek At Our Top Ten Stocks Lists: Daily, Weekly, Year-to-Date & Top Trends
S&P 500 Stocks With Best Up Trends [0-bearish to 100-bullish]: Genuine Parts[100], United Airlines[100], Generac Holdings[93], Bunge [93], Charles Schwab[93], Conagra Brands[93], Wells Fargo[90], PepsiCo [85], Lockheed Martin[85], Constellation [83], Progressive [83]
Best S&P 500 Stocks Year-to-Date:
NVIDIA [70.98%], Constellation [59.78%], Meta Platforms[41.76%], NRG [36.4%], Progressive [31.69%], Marathon [31.45%], Micron [31.16%], Western Digital[30.46%], Diamondback [28.71%], Targa Resources[28.68%], Eaton [28.29%] Best S&P 500 Stocks This Week:
United Airlines[23.01%], UnitedHealth [12.29%], Genuine Parts[10.21%], Globe Life[10%], ProShares UltraPro[7.09%], American Airlines[6.62%], Southwest Airlines[5.52%], Morgan Stanley[4.72%], V.F [4.62%], General Mills[4.37%], Estee Lauder[4.33%] Best S&P 500 Stocks Daily:
Genuine Parts[11.22%], United Airlines[5.50%], Estee Lauder[4.90%], Allstate [3.80%], Discover Financial[3.65%], Capital One[3.55%], V.F [3.43%], UnitedHealth [2.96%], Synchrony Financial[2.82%], Globe Life[2.80%], Wells Fargo[2.73%]