
 Login Sign Up


| |||||
 |  | ||||

| 12Stocks.com Market Intelligence |
Best S&P 500 Stocks
|
On this page, you will find the most comprehensive analysis of S&P 500 stocks and ETFs - from latest trends to performances to charts ➞. First, here are the year-to-date (YTD) performances of the most requested S&P 500 stocks at 12Stocks.com (click stock for review):
| NVIDIA 66% | ||
| Caterpillar 22% | ||
| Amazon.com 17% | ||
| Merck 16% | ||
| Google 13% | ||
| Walmart 13% | ||
| JPMorgan Chase 12% | ||
| Goldman Sachs 9% | ||
| Chevron 9% | ||
| Microsoft 9% | ||
| Johnson & Johnson -6% | ||
| McDonald s -8% | ||
| Starbucks -8% | ||
| Apple -13% | ||
| Gilead -18% | ||
| Intel -31% | ||
| Boeing -35% | ||
| Quick: S&P 500 Stocks Lists: Performances & Trends, S&P 500 Stock Charts
Sort S&P 500 stocks: Daily, Weekly, Year-to-Date, Market Cap & Trends. Filter S&P 500 stocks list by sector: Show all, Tech, Finance, Energy, Staples, Retail, Industrial, Materials, Utilities and HealthCare |
| 12Stocks.com S&P 500 Stocks Performances & Trends Daily Report | |||||||||
|
| 
The overall Smart Investing & Trading Score is 58 (0-bearish to 100-bullish) which puts S&P 500 index in short term neutral trend. The Smart Investing & Trading Score from previous trading session is 51 and an improvement of trend continues. | ||||||||
Here are the Smart Investing & Trading Scores of the most requested S&P 500 stocks at 12Stocks.com (click stock name for detailed review):
|


| 12Stocks.com: Top Performing S&P 500 Index Stocks | ||||||||||||||||||||||||||||||||||||||||||||||||
 The top performing S&P 500 Index stocks year to date are
Now, more recently, over last week, the top performing S&P 500 Index stocks on the move are


|
||||||||||||||||||||||||||||||||||||||||||||||||
| 12Stocks.com: Investing in S&P 500 Index with Stocks | |
|
The following table helps investors and traders sort through current performance and trends (as measured by Smart Investing & Trading Score) of various
stocks in the S&P 500 Index. Quick View: Move mouse or cursor over stock symbol (ticker) to view short-term technical chart and over stock name to view long term chart. Click on  to add stock symbol to your watchlist and to add stock symbol to your watchlist and  to view watchlist. Click on any ticker or stock name for detailed market intelligence report for that stock. to view watchlist. Click on any ticker or stock name for detailed market intelligence report for that stock. |
12Stocks.com Performance of Stocks in S&P 500 Index
| Ticker | Stock Name | Watchlist | Category | Recent Price | Smart Investing & Trading Score | Change % | YTD Change% |
| GILD | Gilead |   | Health Care | 66.80 | 28 | -0.34 | -17.54% |
| PM | Philip Morris | | Consumer Staples | 97.33 | 100 | -0.34 | 3.45% |
| SO | Southern | | Utilities | 73.00 | 93 | -0.35 | 4.10% |
| ORCL | Oracle | | Technology | 114.69 | 44 | -0.35 | 8.78% |
| LDOS | Leidos Holdings | | Technology | 128.23 | 83 | -0.35 | 18.47% |
| ROST | Ross Stores | | Services & Goods | 132.60 | 18 | -0.36 | -4.18% |
| HII | Huntington Ingalls | | Industrials | 273.48 | 51 | -0.36 | 5.33% |
| WHR | Whirlpool | | Consumer Staples | 105.01 | 35 | -0.37 | -13.77% |
| TRV | Travelers | | Financials | 213.53 | 44 | -0.37 | 12.10% |
| XYL | Xylem | | Industrials | 130.24 | 90 | -0.37 | 13.89% |
| REG | Regency Centers | | Financials | 59.85 | 64 | -0.38 | -10.67% |
| CMI | Cummins | | Industrials | 291.58 | 68 | -0.38 | 21.71% |
| SRE | Sempra | | Utilities | 71.25 | 75 | -0.38 | -4.66% |
| AMD | Advanced Micro | | Technology | 151.69 | 32 | -0.38 | 2.90% |
| HIG | Hartford Financial | | Financials | 99.64 | 61 | -0.39 | 23.95% |
| MA | Mastercard | | Financials | 461.01 | 58 | -0.39 | 8.09% |
| NWSA | News | | Services & Goods | 24.52 | 45 | -0.39 | -0.14% |
| KMI | Kinder Morgan | | Energy | 18.68 | 63 | -0.40 | 5.92% |
| MS | Morgan Stanley | | Financials | 93.39 | 100 | -0.40 | 0.14% |
| PG | Procter & Gamble | | Consumer Staples | 160.86 | 93 | -0.40 | 9.77% |
| CAT | Caterpillar | | Industrials | 361.76 | 68 | -0.41 | 22.35% |
| CTAS | Cintas | | Services & Goods | 663.50 | 51 | -0.42 | 10.10% |
| PTC | PTC | | Technology | 179.68 | 45 | -0.42 | 2.70% |
| EXC | Exelon | | Utilities | 37.40 | 51 | -0.43 | 4.18% |
| TGT | Target | | Services & Goods | 165.80 | 46 | -0.43 | 16.42% |
| For chart view version of above stock list: Chart View ➞ 0 - 25 , 25 - 50 , 50 - 75 , 75 - 100 , 100 - 125 , 125 - 150 , 150 - 175 , 175 - 200 , 200 - 225 , 225 - 250 , 250 - 275 , 275 - 300 , 300 - 325 , 325 - 350 , 350 - 375 , 375 - 400 , 400 - 425 , 425 - 450 , 450 - 475 | ||
 | Click To Change The Sort Order: By Market Cap or Company Size Performance: Year-to-date, Week and Day |  |
|
Get the most comprehensive stock market coverage daily at 12Stocks.com ➞ Best Stocks Today ➞ Best Stocks Weekly ➞ Best Stocks Year-to-Date ➞ Best Stocks Trends ➞  Best Stocks Today 12Stocks.com Best Nasdaq Stocks ➞ Best S&P 500 Stocks ➞ Best Tech Stocks ➞ Best Biotech Stocks ➞ |
| Detailed Overview of S&P 500 Stocks |
| S&P 500 Technical Overview, Leaders & Laggards, Top S&P 500 ETF Funds & Detailed S&P 500 Stocks List, Charts, Trends & More |
| S&P 500: Technical Analysis, Trends & YTD Performance | |
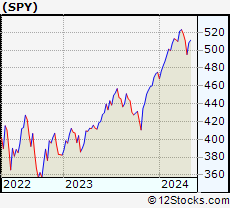
| S&P 500 index as represented by
SPY, an exchange-traded fund [ETF], holds basket of five hundred (mostly largecap) stocks from across all major sectors of the US stock market. The S&P 500 index (contains stocks like Apple and Exxon) is up by 6.15% and is currently outperforming the overall market by 0.81% year-to-date. Below is a quick view of technical charts and trends: | |
 SPY Weekly Chart |
|
| Long Term Trend: Good | |
| Medium Term Trend: Not Good | |
 SPY Daily Chart |
|
| Short Term Trend: Very Good | |
| Overall Trend Score: 58 | |
| YTD Performance: 6.15% | |
| **Trend Scores & Views Are Only For Educational Purposes And Not For Investing | |
| 12Stocks.com: Investing in S&P 500 Index using Exchange Traded Funds | |
|
The following table shows list of key exchange traded funds (ETF) that
help investors track S&P 500 index. The following list also includes leveraged ETF funds that track twice or thrice the daily returns of S&P 500 indices. Short or inverse ETF funds move in the opposite direction to the index they track and are useful during market pullbacks or during bear markets. Quick View: Move mouse or cursor over ETF symbol (ticker) to view short-term technical chart and over ETF name to view long term chart. Click on ticker or stock name for detailed view. Click on to add stock symbol to your watchlist and to view watchlist. |
12Stocks.com List of ETFs that track S&P 500 Index
| Ticker | ETF Name | Watchlist | Recent Price | Smart Investing & Trading Score | Change % | Week % | Year-to-date % |
| SPY | SPDR S&P 500 ETF | | 504.55 | 58 | -0.22 | 1.9 | 6.15% |
| IVV | iShares Core S&P 500 ETF | | 508.76 | 63 | 0.12 | 2.26 | 6.52% |
| VOO | Vanguard 500 ETF | | 465.33 | 63 | 0.11 | 2.25 | 6.53% |
| OEF | iShares S&P 100 | | 239.63 | 58 | -0.13 | 2.11 | 7.27% |
| SSO | ProShares Ultra S&P500 | | 71.69 | 63 | -0.49 | 3.73 | 10.17% |
| UPRO | ProShares UltraPro S&P500 | | 62.49 | 58 | -0.70 | 5.63 | 14.16% |
| SPXL | Direxion Daily S&P500 Bull 3X ETF | | 120.04 | 63 | 0.44 | 6.65 | 15.43% |
| SH | ProShares Short S&P500 | | 12.37 | 42 | 0.20 | -1.79 | -4.81% |
| SDS | ProShares UltraShort S&P500 | | 26.84 | 37 | 0.22 | -3.8 | -10.29% |
| SPXU | ProShares UltraPro Short S&P500 | | 36.25 | 42 | 0.72 | -5.43 | -15.7% |
| SPXS | Direxion Daily S&P 500 Bear 3X ETF | | 9.71 | 32 | -0.41 | -6.27 | -15.93% |
| 12Stocks.com: Charts, Trends, Fundamental Data and Performances of S&P 500 Stocks | |
|
We now take in-depth look at all S&P 500 stocks including charts, multi-period performances and overall trends (as measured by Smart Investing & Trading Score). One can sort S&P 500 stocks (click link to choose) by Daily, Weekly and by Year-to-Date performances. Also, one can sort by size of the company or by market capitalization. |
| Select Your Default Chart Type: | |||||
| |||||
| Click on stock symbol or name for detailed view. Click on to add stock symbol to your watchlist and to view watchlist. Quick View: Move mouse or cursor over "Daily" to quickly view daily technical stock chart and over "Weekly" to view weekly technical stock chart. | |||||

 | GILD Gilead Sciences, Inc. |
| Sector: Health Care | |
| SubSector: Biotechnology | |
| MarketCap: 99485.6 Millions | |
| Recent Price: 66.80 Smart Investing & Trading Score: 28 | |
| Day Percent Change: -0.34% Day Change: -0.23 | |
| Week Change: 0.06% Year-to-date Change: -17.5% | |
| GILD Links: Profile News Message Board | |
| Charts:- Daily , Weekly | |
| Add GILD to Watchlist: View: Get GILD Trend Analysis ➞ | |
 | PM Philip Morris International Inc. |
| Sector: Consumer Staples | |
| SubSector: Cigarettes | |
| MarketCap: 105035 Millions | |
| Recent Price: 97.33 Smart Investing & Trading Score: 100 | |
| Day Percent Change: -0.34% Day Change: -0.33 | |
| Week Change: 3.8% Year-to-date Change: 3.5% | |
| PM Links: Profile News Message Board | |
| Charts:- Daily , Weekly | |
| Add PM to Watchlist: View: Get PM Trend Analysis ➞ | |
 | SO The Southern Company |
| Sector: Utilities | |
| SubSector: Electric Utilities | |
| MarketCap: 54483.6 Millions | |
| Recent Price: 73.00 Smart Investing & Trading Score: 93 | |
| Day Percent Change: -0.35% Day Change: -0.25 | |
| Week Change: 1.17% Year-to-date Change: 4.1% | |
| SO Links: Profile News Message Board | |
| Charts:- Daily , Weekly | |
| Add SO to Watchlist: View: Get SO Trend Analysis ➞ | |
 | ORCL Oracle Corporation |
| Sector: Technology | |
| SubSector: Application Software | |
| MarketCap: 164530 Millions | |
| Recent Price: 114.69 Smart Investing & Trading Score: 44 | |
| Day Percent Change: -0.35% Day Change: -0.40 | |
| Week Change: -0.17% Year-to-date Change: 8.8% | |
| ORCL Links: Profile News Message Board | |
| Charts:- Daily , Weekly | |
| Add ORCL to Watchlist: View: Get ORCL Trend Analysis ➞ | |
 | LDOS Leidos Holdings, Inc. |
| Sector: Technology | |
| SubSector: Information Technology Services | |
| MarketCap: 11707.5 Millions | |
| Recent Price: 128.23 Smart Investing & Trading Score: 83 | |
| Day Percent Change: -0.35% Day Change: -0.45 | |
| Week Change: 2.66% Year-to-date Change: 18.5% | |
| LDOS Links: Profile News Message Board | |
| Charts:- Daily , Weekly | |
| Add LDOS to Watchlist: View: Get LDOS Trend Analysis ➞ | |
 | ROST Ross Stores, Inc. |
| Sector: Services & Goods | |
| SubSector: Apparel Stores | |
| MarketCap: 24938.8 Millions | |
| Recent Price: 132.60 Smart Investing & Trading Score: 18 | |
| Day Percent Change: -0.36% Day Change: -0.49 | |
| Week Change: -0.55% Year-to-date Change: -4.2% | |
| ROST Links: Profile News Message Board | |
| Charts:- Daily , Weekly | |
| Add ROST to Watchlist: View: Get ROST Trend Analysis ➞ | |
 | HII Huntington Ingalls Industries, Inc. |
| Sector: Industrials | |
| SubSector: Aerospace/Defense Products & Services | |
| MarketCap: 7276.11 Millions | |
| Recent Price: 273.48 Smart Investing & Trading Score: 51 | |
| Day Percent Change: -0.36% Day Change: -1.00 | |
| Week Change: 0.67% Year-to-date Change: 5.3% | |
| HII Links: Profile News Message Board | |
| Charts:- Daily , Weekly | |
| Add HII to Watchlist: View: Get HII Trend Analysis ➞ | |
 | WHR Whirlpool Corporation |
| Sector: Consumer Staples | |
| SubSector: Appliances | |
| MarketCap: 5015.08 Millions | |
| Recent Price: 105.01 Smart Investing & Trading Score: 35 | |
| Day Percent Change: -0.37% Day Change: -0.39 | |
| Week Change: 0.32% Year-to-date Change: -13.8% | |
| WHR Links: Profile News Message Board | |
| Charts:- Daily , Weekly | |
| Add WHR to Watchlist: View: Get WHR Trend Analysis ➞ | |
 | TRV The Travelers Companies, Inc. |
| Sector: Financials | |
| SubSector: Property & Casualty Insurance | |
| MarketCap: 25155.9 Millions | |
| Recent Price: 213.53 Smart Investing & Trading Score: 44 | |
| Day Percent Change: -0.37% Day Change: -0.79 | |
| Week Change: -0.25% Year-to-date Change: 12.1% | |
| TRV Links: Profile News Message Board | |
| Charts:- Daily , Weekly | |
| Add TRV to Watchlist: View: Get TRV Trend Analysis ➞ | |
 | XYL Xylem Inc. |
| Sector: Industrials | |
| SubSector: Diversified Machinery | |
| MarketCap: 12195.1 Millions | |
| Recent Price: 130.24 Smart Investing & Trading Score: 90 | |
| Day Percent Change: -0.37% Day Change: -0.48 | |
| Week Change: 1.88% Year-to-date Change: 13.9% | |
| XYL Links: Profile News Message Board | |
| Charts:- Daily , Weekly | |
| Add XYL to Watchlist: View: Get XYL Trend Analysis ➞ | |
 | REG Regency Centers Corporation |
| Sector: Financials | |
| SubSector: REIT - Retail | |
| MarketCap: 6345.84 Millions | |
| Recent Price: 59.85 Smart Investing & Trading Score: 64 | |
| Day Percent Change: -0.38% Day Change: -0.23 | |
| Week Change: 2.54% Year-to-date Change: -10.7% | |
| REG Links: Profile News Message Board | |
| Charts:- Daily , Weekly | |
| Add REG to Watchlist: View: Get REG Trend Analysis ➞ | |
 | CMI Cummins Inc. |
| Sector: Industrials | |
| SubSector: Diversified Machinery | |
| MarketCap: 19127.1 Millions | |
| Recent Price: 291.58 Smart Investing & Trading Score: 68 | |
| Day Percent Change: -0.38% Day Change: -1.12 | |
| Week Change: 1.4% Year-to-date Change: 21.7% | |
| CMI Links: Profile News Message Board | |
| Charts:- Daily , Weekly | |
| Add CMI to Watchlist: View: Get CMI Trend Analysis ➞ | |
 | SRE Sempra Energy |
| Sector: Utilities | |
| SubSector: Diversified Utilities | |
| MarketCap: 34339.9 Millions | |
| Recent Price: 71.25 Smart Investing & Trading Score: 75 | |
| Day Percent Change: -0.38% Day Change: -0.27 | |
| Week Change: 1.67% Year-to-date Change: -4.7% | |
| SRE Links: Profile News Message Board | |
| Charts:- Daily , Weekly | |
| Add SRE to Watchlist: View: Get SRE Trend Analysis ➞ | |
 | AMD Advanced Micro Devices, Inc. |
| Sector: Technology | |
| SubSector: Semiconductor - Broad Line | |
| MarketCap: 54275.1 Millions | |
| Recent Price: 151.69 Smart Investing & Trading Score: 32 | |
| Day Percent Change: -0.38% Day Change: -0.58 | |
| Week Change: 3.44% Year-to-date Change: 2.9% | |
| AMD Links: Profile News Message Board | |
| Charts:- Daily , Weekly | |
| Add AMD to Watchlist: View: Get AMD Trend Analysis ➞ | |
 | HIG The Hartford Financial Services Group, Inc. |
| Sector: Financials | |
| SubSector: Property & Casualty Insurance | |
| MarketCap: 12582.8 Millions | |
| Recent Price: 99.64 Smart Investing & Trading Score: 61 | |
| Day Percent Change: -0.39% Day Change: -0.39 | |
| Week Change: 0.69% Year-to-date Change: 24.0% | |
| HIG Links: Profile News Message Board | |
| Charts:- Daily , Weekly | |
| Add HIG to Watchlist: View: Get HIG Trend Analysis ➞ | |
 | MA Mastercard Incorporated |
| Sector: Financials | |
| SubSector: Credit Services | |
| MarketCap: 234809 Millions | |
| Recent Price: 461.01 Smart Investing & Trading Score: 58 | |
| Day Percent Change: -0.39% Day Change: -1.81 | |
| Week Change: 1.23% Year-to-date Change: 8.1% | |
| MA Links: Profile News Message Board | |
| Charts:- Daily , Weekly | |
| Add MA to Watchlist: View: Get MA Trend Analysis ➞ | |
 | NWSA News Corporation |
| Sector: Services & Goods | |
| SubSector: Broadcasting - TV | |
| MarketCap: 5857.53 Millions | |
| Recent Price: 24.52 Smart Investing & Trading Score: 45 | |
| Day Percent Change: -0.39% Day Change: -0.09 | |
| Week Change: 2.06% Year-to-date Change: -0.1% | |
| NWSA Links: Profile News Message Board | |
| Charts:- Daily , Weekly | |
| Add NWSA to Watchlist: View: Get NWSA Trend Analysis ➞ | |
 | KMI Kinder Morgan, Inc. |
| Sector: Energy | |
| SubSector: Oil & Gas Pipelines | |
| MarketCap: 31283.5 Millions | |
| Recent Price: 18.68 Smart Investing & Trading Score: 63 | |
| Day Percent Change: -0.40% Day Change: -0.08 | |
| Week Change: -0.82% Year-to-date Change: 5.9% | |
| KMI Links: Profile News Message Board | |
| Charts:- Daily , Weekly | |
| Add KMI to Watchlist: View: Get KMI Trend Analysis ➞ | |
 | MS Morgan Stanley |
| Sector: Financials | |
| SubSector: Investment Brokerage - National | |
| MarketCap: 55876.7 Millions | |
| Recent Price: 93.39 Smart Investing & Trading Score: 100 | |
| Day Percent Change: -0.40% Day Change: -0.38 | |
| Week Change: 3.01% Year-to-date Change: 0.1% | |
| MS Links: Profile News Message Board | |
| Charts:- Daily , Weekly | |
| Add MS to Watchlist: View: Get MS Trend Analysis ➞ | |
 | PG The Procter & Gamble Company |
| Sector: Consumer Staples | |
| SubSector: Personal Products | |
| MarketCap: 277162 Millions | |
| Recent Price: 160.86 Smart Investing & Trading Score: 93 | |
| Day Percent Change: -0.40% Day Change: -0.64 | |
| Week Change: 1.72% Year-to-date Change: 9.8% | |
| PG Links: Profile News Message Board | |
| Charts:- Daily , Weekly | |
| Add PG to Watchlist: View: Get PG Trend Analysis ➞ | |
 | CAT Caterpillar Inc. |
| Sector: Industrials | |
| SubSector: Farm & Construction Machinery | |
| MarketCap: 58636 Millions | |
| Recent Price: 361.76 Smart Investing & Trading Score: 68 | |
| Day Percent Change: -0.41% Day Change: -1.49 | |
| Week Change: 2% Year-to-date Change: 22.4% | |
| CAT Links: Profile News Message Board | |
| Charts:- Daily , Weekly | |
| Add CAT to Watchlist: View: Get CAT Trend Analysis ➞ | |
 | CTAS Cintas Corporation |
| Sector: Services & Goods | |
| SubSector: Business Services | |
| MarketCap: 20154.6 Millions | |
| Recent Price: 663.50 Smart Investing & Trading Score: 51 | |
| Day Percent Change: -0.42% Day Change: -2.83 | |
| Week Change: 0.33% Year-to-date Change: 10.1% | |
| CTAS Links: Profile News Message Board | |
| Charts:- Daily , Weekly | |
| Add CTAS to Watchlist: View: Get CTAS Trend Analysis ➞ | |
 | PTC PTC Inc. |
| Sector: Technology | |
| SubSector: Technical & System Software | |
| MarketCap: 6166.7 Millions | |
| Recent Price: 179.68 Smart Investing & Trading Score: 45 | |
| Day Percent Change: -0.42% Day Change: -0.76 | |
| Week Change: 1.88% Year-to-date Change: 2.7% | |
| PTC Links: Profile News Message Board | |
| Charts:- Daily , Weekly | |
| Add PTC to Watchlist: View: Get PTC Trend Analysis ➞ | |
 | EXC Exelon Corporation |
| Sector: Utilities | |
| SubSector: Diversified Utilities | |
| MarketCap: 34091.9 Millions | |
| Recent Price: 37.40 Smart Investing & Trading Score: 51 | |
| Day Percent Change: -0.43% Day Change: -0.16 | |
| Week Change: -0.4% Year-to-date Change: 4.2% | |
| EXC Links: Profile News Message Board | |
| Charts:- Daily , Weekly | |
| Add EXC to Watchlist: View: Get EXC Trend Analysis ➞ | |
 | TGT Target Corporation |
| Sector: Services & Goods | |
| SubSector: Discount, Variety Stores | |
| MarketCap: 55980.6 Millions | |
| Recent Price: 165.80 Smart Investing & Trading Score: 46 | |
| Day Percent Change: -0.43% Day Change: -0.71 | |
| Week Change: -1.49% Year-to-date Change: 16.4% | |
| TGT Links: Profile News Message Board | |
| Charts:- Daily , Weekly | |
| Add TGT to Watchlist: View: Get TGT Trend Analysis ➞ | |
| For tabular summary view of above stock list: Summary View ➞ 0 - 25 , 25 - 50 , 50 - 75 , 75 - 100 , 100 - 125 , 125 - 150 , 150 - 175 , 175 - 200 , 200 - 225 , 225 - 250 , 250 - 275 , 275 - 300 , 300 - 325 , 325 - 350 , 350 - 375 , 375 - 400 , 400 - 425 , 425 - 450 , 450 - 475 | ||
| Click To Change The Sort Order: By Market Cap or Company Size Performance: Year-to-date, Week and Day | |
| Select Chart Type: | ||
|
Best Stocks Today 12Stocks.com |
© 2024 12Stocks.com Terms & Conditions Privacy Contact Us
All Information Provided Only For Education And Not To Be Used For Investing or Trading. See Terms & Conditions


One More Thing ... Get Best Stocks Delivered Daily!
Never Ever Miss A Move With Our Top Ten Stocks Lists
Find Best Stocks In Any Market - Bull or Bear Market
Take A Peek At Our Top Ten Stocks Lists: Daily, Weekly, Year-to-Date & Top Trends
Find Best Stocks In Any Market - Bull or Bear Market
Take A Peek At Our Top Ten Stocks Lists: Daily, Weekly, Year-to-Date & Top Trends
S&P 500 Stocks With Best Up Trends [0-bearish to 100-bullish]: Hasbro [100], Wabtec [100], Texas Instruments[100], Boston Scientific[100], Analog Devices[100], Microchip [100], EQT [100], Synchrony Financial[100], Equity Residential[100], Citizens Financial[100], Generac Holdings[100]
Best S&P 500 Stocks Year-to-Date:
NVIDIA [65.69%], Constellation [59.4%], NRG [40.19%], Meta Platforms[39.28%], Progressive [33.59%], Targa Resources[33.28%], Marathon [33.13%], Diamondback [32.05%], Eaton [31.49%], Western Digital[30.58%], Micron [29.04%] Best S&P 500 Stocks This Week:
Hasbro [18.51%], Wabtec [12.21%], Tesla [10.36%], Texas Instruments[10.25%], Microchip [10%], NXP Semiconductors[8.95%], Boston Scientific[8.84%], Analog Devices[8.62%], CoStar [8.08%], NVIDIA [7.68%], Kimberly-Clark [7.33%] Best S&P 500 Stocks Daily:
Hasbro [12.66%], Tesla [12.16%], Wabtec [8.95%], CoStar [7.62%], Texas Instruments[6.40%], Boston Scientific[6.22%], ON Semiconductor[5.52%], Hilton Worldwide[5.33%], Analog Devices[4.86%], Biogen [4.77%], Microchip [4.25%]