
 Login Sign Up


| |||||
 |  | ||||

| 12Stocks.com Market Intelligence |
Best S&P 500 Stocks
|
On this page, you will find the most comprehensive analysis of S&P 500 stocks and ETFs - from latest trends to performances to charts ➞. First, here are the year-to-date (YTD) performances of the most requested S&P 500 stocks at 12Stocks.com (click stock for review):
| NVIDIA 68% | ||
| Merck 18% | ||
| Amazon.com 18% | ||
| Google 17% | ||
| JPMorgan Chase 13% | ||
| Walmart 12% | ||
| Caterpillar 12% | ||
| Goldman Sachs 11% | ||
| Chevron 7% | ||
| Microsoft 5% | ||
| Johnson & Johnson -4% | ||
| McDonald s -7% | ||
| Apple -12% | ||
| Gilead -19% | ||
| Starbucks -22% | ||
| Boeing -34% | ||
| Intel -40% | ||
| Quick: S&P 500 Stocks Lists: Performances & Trends, S&P 500 Stock Charts
Sort S&P 500 stocks: Daily, Weekly, Year-to-Date, Market Cap & Trends. Filter S&P 500 stocks list by sector: Show all, Tech, Finance, Energy, Staples, Retail, Industrial, Materials, Utilities and HealthCare |
| 12Stocks.com S&P 500 Stocks Performances & Trends Daily Report | |||||||||
|
| 
The overall Smart Investing & Trading Score is 38 (0-bearish to 100-bullish) which puts S&P 500 index in short term bearish to neutral trend. The Smart Investing & Trading Score from previous trading session is 41 and hence a deterioration of trend. | ||||||||
Here are the Smart Investing & Trading Scores of the most requested S&P 500 stocks at 12Stocks.com (click stock name for detailed review):
|


| 12Stocks.com: Top Performing S&P 500 Index Stocks | ||||||||||||||||||||||||||||||||||||||||||||||||
 The top performing S&P 500 Index stocks year to date are
Now, more recently, over last week, the top performing S&P 500 Index stocks on the move are


|
||||||||||||||||||||||||||||||||||||||||||||||||
| 12Stocks.com: Investing in S&P 500 Index with Stocks | |
|
The following table helps investors and traders sort through current performance and trends (as measured by Smart Investing & Trading Score) of various
stocks in the S&P 500 Index. Quick View: Move mouse or cursor over stock symbol (ticker) to view short-term technical chart and over stock name to view long term chart. Click on  to add stock symbol to your watchlist and to add stock symbol to your watchlist and  to view watchlist. Click on any ticker or stock name for detailed market intelligence report for that stock. to view watchlist. Click on any ticker or stock name for detailed market intelligence report for that stock. |
12Stocks.com Performance of Stocks in S&P 500 Index
| Ticker | Stock Name | Watchlist | Category | Recent Price | Smart Investing & Trading Score | Change % | YTD Change% |
| TXT | Textron |   | Industrials | 84.77 | 10 | 0.21 | 5.41% |
| IPG | Interpublic | | Services & Goods | 30.50 | 25 | 0.20 | -6.56% |
| JNPR | Juniper Networks | | Technology | 34.89 | 18 | 0.20 | 18.35% |
| XYL | Xylem | | Industrials | 130.96 | 76 | 0.20 | 14.52% |
| MAS | Masco | | Industrials | 68.58 | 18 | 0.19 | 2.39% |
| STZ | Constellation Brands | | Consumer Staples | 253.95 | 41 | 0.19 | 5.05% |
| T | AT&T | | Technology | 16.92 | 90 | 0.18 | 0.83% |
| MMC | Marsh & McLennan | | Financials | 199.77 | 47 | 0.17 | 5.44% |
| MNST | Monster Beverage | | Consumer Staples | 53.54 | 25 | 0.17 | -7.06% |
| RHI | Robert Half | | Services & Goods | 69.25 | 42 | 0.16 | -21.24% |
| XEL | Xcel | | Utilities | 53.81 | 69 | 0.16 | -13.08% |
| AIZ | Assurant | | Financials | 174.65 | 64 | 0.14 | 3.66% |
| PG | Procter & Gamble | | Consumer Staples | 163.40 | 95 | 0.12 | 11.51% |
| FRT | Federal Realty | | Financials | 104.28 | 100 | 0.11 | 1.19% |
| DHR | Danaher | | Industrials | 246.89 | 62 | 0.11 | 6.72% |
| NSC | Norfolk Southern | | Transports | 230.58 | 0 | 0.11 | -2.45% |
| NWSA | News | | Services & Goods | 23.82 | 10 | 0.11 | -2.95% |
| WY | Weyerhaeuser | | Industrials | 30.20 | 10 | 0.10 | -13.14% |
| TDG | TransDigm | | Industrials | 1249.32 | 76 | 0.10 | 23.50% |
| SPGI | S&P Global | | Services & Goods | 416.20 | 49 | 0.09 | -5.52% |
| UNH | UnitedHealth | | Health Care | 484.11 | 35 | 0.08 | -8.05% |
| NUE | Nucor | | Materials | 168.67 | 10 | 0.08 | -3.09% |
| JPM | JPMorgan Chase | | Financials | 191.86 | 66 | 0.06 | 12.79% |
| GS | Goldman Sachs | | Financials | 426.95 | 95 | 0.06 | 10.67% |
| HII | Huntington Ingalls | | Industrials | 277.06 | 40 | 0.05 | 6.71% |
| For chart view version of above stock list: Chart View ➞ 0 - 25 , 25 - 50 , 50 - 75 , 75 - 100 , 100 - 125 , 125 - 150 , 150 - 175 , 175 - 200 , 200 - 225 , 225 - 250 , 250 - 275 , 275 - 300 , 300 - 325 , 325 - 350 , 350 - 375 , 375 - 400 , 400 - 425 , 425 - 450 , 450 - 475 , 475 - 500 | ||
 | Click To Change The Sort Order: By Market Cap or Company Size Performance: Year-to-date, Week and Day |  |
|
Get the most comprehensive stock market coverage daily at 12Stocks.com ➞ Best Stocks Today ➞ Best Stocks Weekly ➞ Best Stocks Year-to-Date ➞ Best Stocks Trends ➞  Best Stocks Today 12Stocks.com Best Nasdaq Stocks ➞ Best S&P 500 Stocks ➞ Best Tech Stocks ➞ Best Biotech Stocks ➞ |
| Detailed Overview of S&P 500 Stocks |
| S&P 500 Technical Overview, Leaders & Laggards, Top S&P 500 ETF Funds & Detailed S&P 500 Stocks List, Charts, Trends & More |
| S&P 500: Technical Analysis, Trends & YTD Performance | |
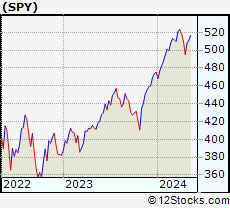
| S&P 500 index as represented by
SPY, an exchange-traded fund [ETF], holds basket of five hundred (mostly largecap) stocks from across all major sectors of the US stock market. The S&P 500 index (contains stocks like Apple and Exxon) is up by 5.27% and is currently outperforming the overall market by 0.73% year-to-date. Below is a quick view of technical charts and trends: | |
 SPY Weekly Chart |
|
| Long Term Trend: Not Good | |
| Medium Term Trend: Not Good | |
 SPY Daily Chart |
|
| Short Term Trend: Deteriorating | |
| Overall Trend Score: 38 | |
| YTD Performance: 5.27% | |
| **Trend Scores & Views Are Only For Educational Purposes And Not For Investing | |
| 12Stocks.com: Investing in S&P 500 Index using Exchange Traded Funds | |
|
The following table shows list of key exchange traded funds (ETF) that
help investors track S&P 500 index. The following list also includes leveraged ETF funds that track twice or thrice the daily returns of S&P 500 indices. Short or inverse ETF funds move in the opposite direction to the index they track and are useful during market pullbacks or during bear markets. Quick View: Move mouse or cursor over ETF symbol (ticker) to view short-term technical chart and over ETF name to view long term chart. Click on ticker or stock name for detailed view. Click on to add stock symbol to your watchlist and to view watchlist. |
12Stocks.com List of ETFs that track S&P 500 Index
| Ticker | ETF Name | Watchlist | Recent Price | Smart Investing & Trading Score | Change % | Week % | Year-to-date % |
| SPY | SPDR S&P 500 ETF | | 500.35 | 38 | -0.32 | -1.56 | 5.27% |
| IVV | iShares Core S&P 500 ETF | | 502.58 | 7 | -0.37 | -1.6 | 5.22% |
| VOO | Vanguard 500 ETF | | 459.94 | 7 | -0.32 | -1.56 | 5.3% |
| OEF | iShares S&P 100 | | 237.48 | 38 | -0.40 | -1.69 | 6.31% |
| SSO | ProShares Ultra S&P500 | | 70.39 | 17 | -0.68 | -3.19 | 8.18% |
| UPRO | ProShares UltraPro S&P500 | | 60.70 | 17 | -1.14 | -4.89 | 10.89% |
| SPXL | Direxion Daily S&P500 Bull 3X ETF | | 115.22 | 7 | -1.20 | -4.89 | 10.8% |
| SH | ProShares Short S&P500 | | 12.49 | 70 | 0.48 | 1.71 | -3.85% |
| SDS | ProShares UltraShort S&P500 | | 27.40 | 70 | 0.74 | 3.28 | -8.42% |
| SPXU | ProShares UltraPro Short S&P500 | | 37.21 | 65 | 0.98 | 4.82 | -13.47% |
| SPXS | Direxion Daily S&P 500 Bear 3X ETF | | 10.06 | 88 | 0.95 | 4.63 | -12.94% |
| 12Stocks.com: Charts, Trends, Fundamental Data and Performances of S&P 500 Stocks | |
|
We now take in-depth look at all S&P 500 stocks including charts, multi-period performances and overall trends (as measured by Smart Investing & Trading Score). One can sort S&P 500 stocks (click link to choose) by Daily, Weekly and by Year-to-Date performances. Also, one can sort by size of the company or by market capitalization. |
| Select Your Default Chart Type: | |||||
| |||||
| Click on stock symbol or name for detailed view. Click on to add stock symbol to your watchlist and to view watchlist. Quick View: Move mouse or cursor over "Daily" to quickly view daily technical stock chart and over "Weekly" to view weekly technical stock chart. | |||||

 | TXT Textron Inc. |
| Sector: Industrials | |
| SubSector: Aerospace/Defense - Major Diversified | |
| MarketCap: 6123.09 Millions | |
| Recent Price: 84.77 Smart Investing & Trading Score: 10 | |
| Day Percent Change: 0.21% Day Change: 0.18 | |
| Week Change: -2.01% Year-to-date Change: 5.4% | |
| TXT Links: Profile News Message Board | |
| Charts:- Daily , Weekly | |
| Add TXT to Watchlist: View: Get TXT Trend Analysis ➞ | |
 | IPG The Interpublic Group of Companies, Inc. |
| Sector: Services & Goods | |
| SubSector: Advertising Agencies | |
| MarketCap: 5730.55 Millions | |
| Recent Price: 30.50 Smart Investing & Trading Score: 25 | |
| Day Percent Change: 0.20% Day Change: 0.06 | |
| Week Change: -3.08% Year-to-date Change: -6.6% | |
| IPG Links: Profile News Message Board | |
| Charts:- Daily , Weekly | |
| Add IPG to Watchlist: View: Get IPG Trend Analysis ➞ | |
 | JNPR Juniper Networks, Inc. |
| Sector: Technology | |
| SubSector: Communication Equipment | |
| MarketCap: 6161.49 Millions | |
| Recent Price: 34.89 Smart Investing & Trading Score: 18 | |
| Day Percent Change: 0.20% Day Change: 0.07 | |
| Week Change: 0.52% Year-to-date Change: 18.4% | |
| JNPR Links: Profile News Message Board | |
| Charts:- Daily , Weekly | |
| Add JNPR to Watchlist: View: Get JNPR Trend Analysis ➞ | |
 | XYL Xylem Inc. |
| Sector: Industrials | |
| SubSector: Diversified Machinery | |
| MarketCap: 12195.1 Millions | |
| Recent Price: 130.96 Smart Investing & Trading Score: 76 | |
| Day Percent Change: 0.20% Day Change: 0.26 | |
| Week Change: -1.09% Year-to-date Change: 14.5% | |
| XYL Links: Profile News Message Board | |
| Charts:- Daily , Weekly | |
| Add XYL to Watchlist: View: Get XYL Trend Analysis ➞ | |
 | MAS Masco Corporation |
| Sector: Industrials | |
| SubSector: General Building Materials | |
| MarketCap: 8655.63 Millions | |
| Recent Price: 68.58 Smart Investing & Trading Score: 18 | |
| Day Percent Change: 0.19% Day Change: 0.13 | |
| Week Change: -1.82% Year-to-date Change: 2.4% | |
| MAS Links: Profile News Message Board | |
| Charts:- Daily , Weekly | |
| Add MAS to Watchlist: View: Get MAS Trend Analysis ➞ | |
 | STZ Constellation Brands, Inc. |
| Sector: Consumer Staples | |
| SubSector: Beverages - Wineries & Distillers | |
| MarketCap: 27394.5 Millions | |
| Recent Price: 253.95 Smart Investing & Trading Score: 41 | |
| Day Percent Change: 0.19% Day Change: 0.49 | |
| Week Change: -2.34% Year-to-date Change: 5.1% | |
| STZ Links: Profile News Message Board | |
| Charts:- Daily , Weekly | |
| Add STZ to Watchlist: View: Get STZ Trend Analysis ➞ | |
 | T AT&T Inc. |
| Sector: Technology | |
| SubSector: Telecom Services - Domestic | |
| MarketCap: 224847 Millions | |
| Recent Price: 16.92 Smart Investing & Trading Score: 90 | |
| Day Percent Change: 0.18% Day Change: 0.03 | |
| Week Change: 1.01% Year-to-date Change: 0.8% | |
| T Links: Profile News Message Board | |
| Charts:- Daily , Weekly | |
| Add T to Watchlist: View: Get T Trend Analysis ➞ | |
 | MMC Marsh & McLennan Companies, Inc. |
| Sector: Financials | |
| SubSector: Insurance Brokers | |
| MarketCap: 42821.8 Millions | |
| Recent Price: 199.77 Smart Investing & Trading Score: 47 | |
| Day Percent Change: 0.17% Day Change: 0.34 | |
| Week Change: 0.92% Year-to-date Change: 5.4% | |
| MMC Links: Profile News Message Board | |
| Charts:- Daily , Weekly | |
| Add MMC to Watchlist: View: Get MMC Trend Analysis ➞ | |
 | MNST Monster Beverage Corporation |
| Sector: Consumer Staples | |
| SubSector: Beverages - Soft Drinks | |
| MarketCap: 30126.8 Millions | |
| Recent Price: 53.54 Smart Investing & Trading Score: 25 | |
| Day Percent Change: 0.17% Day Change: 0.09 | |
| Week Change: 0.32% Year-to-date Change: -7.1% | |
| MNST Links: Profile News Message Board | |
| Charts:- Daily , Weekly | |
| Add MNST to Watchlist: View: Get MNST Trend Analysis ➞ | |
 | RHI Robert Half International Inc. |
| Sector: Services & Goods | |
| SubSector: Staffing & Outsourcing Services | |
| MarketCap: 4302 Millions | |
| Recent Price: 69.25 Smart Investing & Trading Score: 42 | |
| Day Percent Change: 0.16% Day Change: 0.11 | |
| Week Change: -0.14% Year-to-date Change: -21.2% | |
| RHI Links: Profile News Message Board | |
| Charts:- Daily , Weekly | |
| Add RHI to Watchlist: View: Get RHI Trend Analysis ➞ | |
 | XEL Xcel Energy Inc. |
| Sector: Utilities | |
| SubSector: Electric Utilities | |
| MarketCap: 28960.8 Millions | |
| Recent Price: 53.81 Smart Investing & Trading Score: 69 | |
| Day Percent Change: 0.16% Day Change: 0.09 | |
| Week Change: -0.27% Year-to-date Change: -13.1% | |
| XEL Links: Profile News Message Board | |
| Charts:- Daily , Weekly | |
| Add XEL to Watchlist: View: Get XEL Trend Analysis ➞ | |
 | AIZ Assurant, Inc. |
| Sector: Financials | |
| SubSector: Accident & Health Insurance | |
| MarketCap: 6110.3 Millions | |
| Recent Price: 174.65 Smart Investing & Trading Score: 64 | |
| Day Percent Change: 0.14% Day Change: 0.25 | |
| Week Change: 1.02% Year-to-date Change: 3.7% | |
| AIZ Links: Profile News Message Board | |
| Charts:- Daily , Weekly | |
| Add AIZ to Watchlist: View: Get AIZ Trend Analysis ➞ | |
 | PG The Procter & Gamble Company |
| Sector: Consumer Staples | |
| SubSector: Personal Products | |
| MarketCap: 277162 Millions | |
| Recent Price: 163.40 Smart Investing & Trading Score: 95 | |
| Day Percent Change: 0.12% Day Change: 0.20 | |
| Week Change: 1.31% Year-to-date Change: 11.5% | |
| PG Links: Profile News Message Board | |
| Charts:- Daily , Weekly | |
| Add PG to Watchlist: View: Get PG Trend Analysis ➞ | |
 | FRT Federal Realty Investment Trust |
| Sector: Financials | |
| SubSector: REIT - Retail | |
| MarketCap: 5878.64 Millions | |
| Recent Price: 104.28 Smart Investing & Trading Score: 100 | |
| Day Percent Change: 0.11% Day Change: 0.11 | |
| Week Change: 2.05% Year-to-date Change: 1.2% | |
| FRT Links: Profile News Message Board | |
| Charts:- Daily , Weekly | |
| Add FRT to Watchlist: View: Get FRT Trend Analysis ➞ | |
 | DHR Danaher Corporation |
| Sector: Industrials | |
| SubSector: Diversified Machinery | |
| MarketCap: 93210.3 Millions | |
| Recent Price: 246.89 Smart Investing & Trading Score: 62 | |
| Day Percent Change: 0.11% Day Change: 0.27 | |
| Week Change: 0.13% Year-to-date Change: 6.7% | |
| DHR Links: Profile News Message Board | |
| Charts:- Daily , Weekly | |
| Add DHR to Watchlist: View: Get DHR Trend Analysis ➞ | |
 | NSC Norfolk Southern Corporation |
| Sector: Transports | |
| SubSector: Railroads | |
| MarketCap: 36165.4 Millions | |
| Recent Price: 230.58 Smart Investing & Trading Score: 0 | |
| Day Percent Change: 0.11% Day Change: 0.26 | |
| Week Change: -3.9% Year-to-date Change: -2.5% | |
| NSC Links: Profile News Message Board | |
| Charts:- Daily , Weekly | |
| Add NSC to Watchlist: View: Get NSC Trend Analysis ➞ | |
 | NWSA News Corporation |
| Sector: Services & Goods | |
| SubSector: Broadcasting - TV | |
| MarketCap: 5857.53 Millions | |
| Recent Price: 23.82 Smart Investing & Trading Score: 10 | |
| Day Percent Change: 0.11% Day Change: 0.02 | |
| Week Change: -1.63% Year-to-date Change: -3.0% | |
| NWSA Links: Profile News Message Board | |
| Charts:- Daily , Weekly | |
| Add NWSA to Watchlist: View: Get NWSA Trend Analysis ➞ | |
 | WY Weyerhaeuser Company |
| Sector: Industrials | |
| SubSector: Lumber, Wood Production | |
| MarketCap: 13244.8 Millions | |
| Recent Price: 30.20 Smart Investing & Trading Score: 10 | |
| Day Percent Change: 0.10% Day Change: 0.03 | |
| Week Change: -2.74% Year-to-date Change: -13.1% | |
| WY Links: Profile News Message Board | |
| Charts:- Daily , Weekly | |
| Add WY to Watchlist: View: Get WY Trend Analysis ➞ | |
 | TDG TransDigm Group Incorporated |
| Sector: Industrials | |
| SubSector: Aerospace/Defense Products & Services | |
| MarketCap: 18441 Millions | |
| Recent Price: 1249.32 Smart Investing & Trading Score: 76 | |
| Day Percent Change: 0.10% Day Change: 1.29 | |
| Week Change: -0.78% Year-to-date Change: 23.5% | |
| TDG Links: Profile News Message Board | |
| Charts:- Daily , Weekly | |
| Add TDG to Watchlist: View: Get TDG Trend Analysis ➞ | |
 | SPGI S&P Global Inc. |
| Sector: Services & Goods | |
| SubSector: Business Services | |
| MarketCap: 55247.9 Millions | |
| Recent Price: 416.20 Smart Investing & Trading Score: 49 | |
| Day Percent Change: 0.09% Day Change: 0.37 | |
| Week Change: 0.1% Year-to-date Change: -5.5% | |
| SPGI Links: Profile News Message Board | |
| Charts:- Daily , Weekly | |
| Add SPGI to Watchlist: View: Get SPGI Trend Analysis ➞ | |
 | UNH UnitedHealth Group Incorporated |
| Sector: Health Care | |
| SubSector: Health Care Plans | |
| MarketCap: 217384 Millions | |
| Recent Price: 484.11 Smart Investing & Trading Score: 35 | |
| Day Percent Change: 0.08% Day Change: 0.41 | |
| Week Change: -2.27% Year-to-date Change: -8.1% | |
| UNH Links: Profile News Message Board | |
| Charts:- Daily , Weekly | |
| Add UNH to Watchlist: View: Get UNH Trend Analysis ➞ | |
 | NUE Nucor Corporation |
| Sector: Materials | |
| SubSector: Steel & Iron | |
| MarketCap: 10281.8 Millions | |
| Recent Price: 168.67 Smart Investing & Trading Score: 10 | |
| Day Percent Change: 0.08% Day Change: 0.14 | |
| Week Change: -3.85% Year-to-date Change: -3.1% | |
| NUE Links: Profile News Message Board | |
| Charts:- Daily , Weekly | |
| Add NUE to Watchlist: View: Get NUE Trend Analysis ➞ | |
 | JPM JPMorgan Chase & Co. |
| Sector: Financials | |
| SubSector: Money Center Banks | |
| MarketCap: 279736 Millions | |
| Recent Price: 191.86 Smart Investing & Trading Score: 66 | |
| Day Percent Change: 0.06% Day Change: 0.12 | |
| Week Change: -0.84% Year-to-date Change: 12.8% | |
| JPM Links: Profile News Message Board | |
| Charts:- Daily , Weekly | |
| Add JPM to Watchlist: View: Get JPM Trend Analysis ➞ | |
 | GS The Goldman Sachs Group, Inc. |
| Sector: Financials | |
| SubSector: Investment Brokerage - National | |
| MarketCap: 54579.3 Millions | |
| Recent Price: 426.95 Smart Investing & Trading Score: 95 | |
| Day Percent Change: 0.06% Day Change: 0.24 | |
| Week Change: -0.15% Year-to-date Change: 10.7% | |
| GS Links: Profile News Message Board | |
| Charts:- Daily , Weekly | |
| Add GS to Watchlist: View: Get GS Trend Analysis ➞ | |
 | HII Huntington Ingalls Industries, Inc. |
| Sector: Industrials | |
| SubSector: Aerospace/Defense Products & Services | |
| MarketCap: 7276.11 Millions | |
| Recent Price: 277.06 Smart Investing & Trading Score: 40 | |
| Day Percent Change: 0.05% Day Change: 0.13 | |
| Week Change: 0.03% Year-to-date Change: 6.7% | |
| HII Links: Profile News Message Board | |
| Charts:- Daily , Weekly | |
| Add HII to Watchlist: View: Get HII Trend Analysis ➞ | |
| For tabular summary view of above stock list: Summary View ➞ 0 - 25 , 25 - 50 , 50 - 75 , 75 - 100 , 100 - 125 , 125 - 150 , 150 - 175 , 175 - 200 , 200 - 225 , 225 - 250 , 250 - 275 , 275 - 300 , 300 - 325 , 325 - 350 , 350 - 375 , 375 - 400 , 400 - 425 , 425 - 450 , 450 - 475 , 475 - 500 | ||
| Click To Change The Sort Order: By Market Cap or Company Size Performance: Year-to-date, Week and Day | |
| Select Chart Type: | ||
|
Best Stocks Today 12Stocks.com |
© 2024 12Stocks.com Terms & Conditions Privacy Contact Us
All Information Provided Only For Education And Not To Be Used For Investing or Trading. See Terms & Conditions


One More Thing ... Get Best Stocks Delivered Daily!
Never Ever Miss A Move With Our Top Ten Stocks Lists
Find Best Stocks In Any Market - Bull or Bear Market
Take A Peek At Our Top Ten Stocks Lists: Daily, Weekly, Year-to-Date & Top Trends
Find Best Stocks In Any Market - Bull or Bear Market
Take A Peek At Our Top Ten Stocks Lists: Daily, Weekly, Year-to-Date & Top Trends
S&P 500 Stocks With Best Up Trends [0-bearish to 100-bullish]: Bio-Techne [100], Garmin [100], Amcor [100], DuPont de[100], Pfizer [100], Zions Ban[100], American Electric[100], NextEra [100], Arch Capital[100], American Water[100], 3M [100]
Best S&P 500 Stocks Year-to-Date:
NVIDIA [67.69%], Constellation [57.66%], NRG [42.48%], Chipotle Mexican[37.24%], Western Digital[34.63%], DaVita [33.4%], Eli Lilly[33.25%], Progressive [32.97%], Leidos Holdings[31.37%], Eaton [29.57%], Targa Resources[29.4%] Best S&P 500 Stocks This Week:
Bio-Techne [14.64%], Garmin [13.92%], Amcor [9.25%], Leidos Holdings[9.07%], 3M [7.2%], Pfizer [7.01%], Tesla [6.96%], Corning [6.86%], DuPont de[6.24%], Eli Lilly[5.89%], Cincinnati Financial[5.78%] Best S&P 500 Stocks Daily:
Bio-Techne [16.18%], Garmin [13.12%], Amcor [9.62%], DuPont de[8.01%], Verisk Analytics[6.87%], Pfizer [6.09%], Johnson & Johnson[4.56%], Globe Life[4.35%], Humana [4.01%], Extra Space[3.29%], American Tower[3.08%]