
 Login Sign Up


| |||||
 |  | ||||

| 12Stocks.com Market Intelligence |
Best S&P 500 Stocks
|
On this page, you will find the most comprehensive analysis of S&P 500 stocks and ETFs - from latest trends to performances to charts ➞. First, here are the year-to-date (YTD) performances of the most requested S&P 500 stocks at 12Stocks.com (click stock for review):
| NVIDIA 68% | ||
| Merck 18% | ||
| Amazon.com 18% | ||
| Google 17% | ||
| JPMorgan Chase 13% | ||
| Walmart 12% | ||
| Caterpillar 12% | ||
| Goldman Sachs 11% | ||
| Chevron 7% | ||
| Microsoft 5% | ||
| Johnson & Johnson -4% | ||
| McDonald s -7% | ||
| Apple -12% | ||
| Gilead -19% | ||
| Starbucks -22% | ||
| Boeing -34% | ||
| Intel -40% | ||
| Quick: S&P 500 Stocks Lists: Performances & Trends, S&P 500 Stock Charts
Sort S&P 500 stocks: Daily, Weekly, Year-to-Date, Market Cap & Trends. Filter S&P 500 stocks list by sector: Show all, Tech, Finance, Energy, Staples, Retail, Industrial, Materials, Utilities and HealthCare |
| 12Stocks.com S&P 500 Stocks Performances & Trends Daily Report | |||||||||
|
| 
The overall Smart Investing & Trading Score is 7 (0-bearish to 100-bullish) which puts S&P 500 index in short term bearish trend. The Smart Investing & Trading Score from previous trading session is 41 and hence a deterioration of trend. | ||||||||
Here are the Smart Investing & Trading Scores of the most requested S&P 500 stocks at 12Stocks.com (click stock name for detailed review):
|


| 12Stocks.com: Top Performing S&P 500 Index Stocks | ||||||||||||||||||||||||||||||||||||||||||||||||
 The top performing S&P 500 Index stocks year to date are
Now, more recently, over last week, the top performing S&P 500 Index stocks on the move are


|
||||||||||||||||||||||||||||||||||||||||||||||||
| 12Stocks.com: Investing in S&P 500 Index with Stocks | |
|
The following table helps investors and traders sort through current performance and trends (as measured by Smart Investing & Trading Score) of various
stocks in the S&P 500 Index. Quick View: Move mouse or cursor over stock symbol (ticker) to view short-term technical chart and over stock name to view long term chart. Click on  to add stock symbol to your watchlist and to add stock symbol to your watchlist and  to view watchlist. Click on any ticker or stock name for detailed market intelligence report for that stock. to view watchlist. Click on any ticker or stock name for detailed market intelligence report for that stock. |
12Stocks.com Performance of Stocks in S&P 500 Index
| Ticker | Stock Name | Watchlist | Category | Recent Price | Smart Investing & Trading Score | Change % | YTD Change% |
| HIG | Hartford Financial |   | Financials | 97.22 | 66 | 0.34 | 20.95% |
| D | Dominion | | Utilities | 51.15 | 90 | 0.33 | 8.83% |
| BWA | BorgWarner | | Consumer Staples | 32.87 | 53 | 0.31 | -8.31% |
| EIX | Edison | | Utilities | 71.28 | 88 | 0.31 | -0.29% |
| ABT | Abbott | | Health Care | 106.29 | 24 | 0.30 | -3.43% |
| GLW | Corning | | Technology | 33.48 | 93 | 0.30 | 9.95% |
| ETR | Entergy | | Utilities | 106.98 | 71 | 0.29 | 5.72% |
| ISRG | Intuitive Surgical | | Health Care | 371.70 | 17 | 0.29 | 10.18% |
| NOC | Northrop Grumman | | Industrials | 486.37 | 90 | 0.28 | 3.89% |
| PSA | Public Storage | | Financials | 260.15 | 39 | 0.27 | -14.70% |
| ROL | Rollins | | Services & Goods | 44.68 | 58 | 0.27 | 2.31% |
| CTLT | Catalent | | Health Care | 56.00 | 42 | 0.27 | 24.64% |
| KO | Coca-Cola | | Consumer Staples | 61.93 | 76 | 0.26 | 5.09% |
| DLTR | Dollar Tree | | Services & Goods | 118.56 | 17 | 0.26 | -16.54% |
| AVY | Avery Dennison | | Consumer Staples | 217.83 | 60 | 0.25 | 7.75% |
| OTIS | Otis Worldwide | | Industrials | 91.43 | 10 | 0.25 | 2.19% |
| NVR | NVR | | Industrials | 7457.00 | 7 | 0.24 | 6.52% |
| CPRT | Copart | | Services & Goods | 54.44 | 33 | 0.24 | 11.10% |
| CMCSA | Comcast | | Services & Goods | 38.20 | 10 | 0.24 | -12.88% |
| STE | STERIS | | Health Care | 205.04 | 49 | 0.23 | -6.74% |
| HLT | Hilton Worldwide | | Services & Goods | 197.74 | 7 | 0.23 | 8.59% |
| FTV | Fortive | | Technology | 75.44 | 18 | 0.23 | 2.46% |
| EFX | Equifax | | Financials | 220.67 | 10 | 0.22 | -10.76% |
| PCAR | PACCAR Inc | | Consumer Staples | 106.34 | 0 | 0.22 | 8.90% |
| TXT | Textron | | Industrials | 84.77 | 10 | 0.21 | 5.41% |
| For chart view version of above stock list: Chart View ➞ 0 - 25 , 25 - 50 , 50 - 75 , 75 - 100 , 100 - 125 , 125 - 150 , 150 - 175 , 175 - 200 , 200 - 225 , 225 - 250 , 250 - 275 , 275 - 300 , 300 - 325 , 325 - 350 , 350 - 375 , 375 - 400 , 400 - 425 , 425 - 450 , 450 - 475 , 475 - 500 | ||
 | Click To Change The Sort Order: By Market Cap or Company Size Performance: Year-to-date, Week and Day |  |
|
Get the most comprehensive stock market coverage daily at 12Stocks.com ➞ Best Stocks Today ➞ Best Stocks Weekly ➞ Best Stocks Year-to-Date ➞ Best Stocks Trends ➞  Best Stocks Today 12Stocks.com Best Nasdaq Stocks ➞ Best S&P 500 Stocks ➞ Best Tech Stocks ➞ Best Biotech Stocks ➞ |
| Detailed Overview of S&P 500 Stocks |
| S&P 500 Technical Overview, Leaders & Laggards, Top S&P 500 ETF Funds & Detailed S&P 500 Stocks List, Charts, Trends & More |
| S&P 500: Technical Analysis, Trends & YTD Performance | |
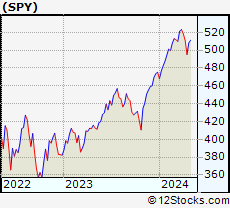
| S&P 500 index as represented by
SPY, an exchange-traded fund [ETF], holds basket of five hundred (mostly largecap) stocks from across all major sectors of the US stock market. The S&P 500 index (contains stocks like Apple and Exxon) is up by 5.27% and is currently outperforming the overall market by 0.73% year-to-date. Below is a quick view of technical charts and trends: | |
 SPY Weekly Chart |
|
| Long Term Trend: Not Good | |
| Medium Term Trend: Not Good | |
 SPY Daily Chart |
|
| Short Term Trend: Not Good | |
| Overall Trend Score: 7 | |
| YTD Performance: 5.27% | |
| **Trend Scores & Views Are Only For Educational Purposes And Not For Investing | |
| 12Stocks.com: Investing in S&P 500 Index using Exchange Traded Funds | |
|
The following table shows list of key exchange traded funds (ETF) that
help investors track S&P 500 index. The following list also includes leveraged ETF funds that track twice or thrice the daily returns of S&P 500 indices. Short or inverse ETF funds move in the opposite direction to the index they track and are useful during market pullbacks or during bear markets. Quick View: Move mouse or cursor over ETF symbol (ticker) to view short-term technical chart and over ETF name to view long term chart. Click on ticker or stock name for detailed view. Click on to add stock symbol to your watchlist and to view watchlist. |
12Stocks.com List of ETFs that track S&P 500 Index
| Ticker | ETF Name | Watchlist | Recent Price | Smart Investing & Trading Score | Change % | Week % | Year-to-date % |
| SPY | SPDR S&P 500 ETF | | 500.35 | 7 | -0.32 | -1.56 | 5.27% |
| IVV | iShares Core S&P 500 ETF | | 502.86 | 7 | -0.31 | -1.55 | 5.28% |
| VOO | Vanguard 500 ETF | | 459.93 | 7 | -0.33 | -1.56 | 5.3% |
| OEF | iShares S&P 100 | | 237.48 | 7 | -0.40 | -1.69 | 6.31% |
| SSO | ProShares Ultra S&P500 | | 70.39 | 7 | -0.68 | -3.19 | 8.18% |
| UPRO | ProShares UltraPro S&P500 | | 60.70 | 7 | -1.14 | -4.89 | 10.89% |
| SPXL | Direxion Daily S&P500 Bull 3X ETF | | 115.35 | 7 | -1.09 | -4.78 | 10.92% |
| SH | ProShares Short S&P500 | | 12.49 | 93 | 0.48 | 1.71 | -3.85% |
| SDS | ProShares UltraShort S&P500 | | 27.40 | 93 | 0.74 | 3.28 | -8.42% |
| SPXU | ProShares UltraPro Short S&P500 | | 37.21 | 88 | 0.98 | 4.82 | -13.47% |
| SPXS | Direxion Daily S&P 500 Bear 3X ETF | | 10.07 | 88 | 1.10 | 4.79 | -12.81% |
| 12Stocks.com: Charts, Trends, Fundamental Data and Performances of S&P 500 Stocks | |
|
We now take in-depth look at all S&P 500 stocks including charts, multi-period performances and overall trends (as measured by Smart Investing & Trading Score). One can sort S&P 500 stocks (click link to choose) by Daily, Weekly and by Year-to-Date performances. Also, one can sort by size of the company or by market capitalization. |
| Select Your Default Chart Type: | |||||
| |||||
| Click on stock symbol or name for detailed view. Click on to add stock symbol to your watchlist and to view watchlist. Quick View: Move mouse or cursor over "Daily" to quickly view daily technical stock chart and over "Weekly" to view weekly technical stock chart. | |||||

 | HIG The Hartford Financial Services Group, Inc. |
| Sector: Financials | |
| SubSector: Property & Casualty Insurance | |
| MarketCap: 12582.8 Millions | |
| Recent Price: 97.22 Smart Investing & Trading Score: 66 | |
| Day Percent Change: 0.34% Day Change: 0.33 | |
| Week Change: 2.01% Year-to-date Change: 21.0% | |
| HIG Links: Profile News Message Board | |
| Charts:- Daily , Weekly | |
| Add HIG to Watchlist: View: Get HIG Trend Analysis ➞ | |
 | D Dominion Energy, Inc. |
| Sector: Utilities | |
| SubSector: Electric Utilities | |
| MarketCap: 62365.3 Millions | |
| Recent Price: 51.15 Smart Investing & Trading Score: 90 | |
| Day Percent Change: 0.33% Day Change: 0.17 | |
| Week Change: 1.39% Year-to-date Change: 8.8% | |
| D Links: Profile News Message Board | |
| Charts:- Daily , Weekly | |
| Add D to Watchlist: View: Get D Trend Analysis ➞ | |
 | BWA BorgWarner Inc. |
| Sector: Consumer Staples | |
| SubSector: Auto Parts | |
| MarketCap: 4604.09 Millions | |
| Recent Price: 32.87 Smart Investing & Trading Score: 53 | |
| Day Percent Change: 0.31% Day Change: 0.10 | |
| Week Change: -0.96% Year-to-date Change: -8.3% | |
| BWA Links: Profile News Message Board | |
| Charts:- Daily , Weekly | |
| Add BWA to Watchlist: View: Get BWA Trend Analysis ➞ | |
 | EIX Edison International |
| Sector: Utilities | |
| SubSector: Electric Utilities | |
| MarketCap: 19358.1 Millions | |
| Recent Price: 71.28 Smart Investing & Trading Score: 88 | |
| Day Percent Change: 0.31% Day Change: 0.22 | |
| Week Change: 1.63% Year-to-date Change: -0.3% | |
| EIX Links: Profile News Message Board | |
| Charts:- Daily , Weekly | |
| Add EIX to Watchlist: View: Get EIX Trend Analysis ➞ | |
 | ABT Abbott Laboratories |
| Sector: Health Care | |
| SubSector: Medical Appliances & Equipment | |
| MarketCap: 125288 Millions | |
| Recent Price: 106.29 Smart Investing & Trading Score: 24 | |
| Day Percent Change: 0.30% Day Change: 0.32 | |
| Week Change: -1.15% Year-to-date Change: -3.4% | |
| ABT Links: Profile News Message Board | |
| Charts:- Daily , Weekly | |
| Add ABT to Watchlist: View: Get ABT Trend Analysis ➞ | |
 | GLW Corning Incorporated |
| Sector: Technology | |
| SubSector: Diversified Electronics | |
| MarketCap: 16287.6 Millions | |
| Recent Price: 33.48 Smart Investing & Trading Score: 93 | |
| Day Percent Change: 0.30% Day Change: 0.10 | |
| Week Change: 6.86% Year-to-date Change: 10.0% | |
| GLW Links: Profile News Message Board | |
| Charts:- Daily , Weekly | |
| Add GLW to Watchlist: View: Get GLW Trend Analysis ➞ | |
 | ETR Entergy Corporation |
| Sector: Utilities | |
| SubSector: Electric Utilities | |
| MarketCap: 17545 Millions | |
| Recent Price: 106.98 Smart Investing & Trading Score: 71 | |
| Day Percent Change: 0.29% Day Change: 0.31 | |
| Week Change: 0.45% Year-to-date Change: 5.7% | |
| ETR Links: Profile News Message Board | |
| Charts:- Daily , Weekly | |
| Add ETR to Watchlist: View: Get ETR Trend Analysis ➞ | |
 | ISRG Intuitive Surgical, Inc. |
| Sector: Health Care | |
| SubSector: Medical Instruments & Supplies | |
| MarketCap: 50917.5 Millions | |
| Recent Price: 371.70 Smart Investing & Trading Score: 17 | |
| Day Percent Change: 0.29% Day Change: 1.08 | |
| Week Change: -0.97% Year-to-date Change: 10.2% | |
| ISRG Links: Profile News Message Board | |
| Charts:- Daily , Weekly | |
| Add ISRG to Watchlist: View: Get ISRG Trend Analysis ➞ | |
 | NOC Northrop Grumman Corporation |
| Sector: Industrials | |
| SubSector: Aerospace/Defense - Major Diversified | |
| MarketCap: 52094.9 Millions | |
| Recent Price: 486.37 Smart Investing & Trading Score: 90 | |
| Day Percent Change: 0.28% Day Change: 1.34 | |
| Week Change: 1.23% Year-to-date Change: 3.9% | |
| NOC Links: Profile News Message Board | |
| Charts:- Daily , Weekly | |
| Add NOC to Watchlist: View: Get NOC Trend Analysis ➞ | |
 | PSA Public Storage |
| Sector: Financials | |
| SubSector: REIT - Industrial | |
| MarketCap: 32733.9 Millions | |
| Recent Price: 260.15 Smart Investing & Trading Score: 39 | |
| Day Percent Change: 0.27% Day Change: 0.70 | |
| Week Change: 0.94% Year-to-date Change: -14.7% | |
| PSA Links: Profile News Message Board | |
| Charts:- Daily , Weekly | |
| Add PSA to Watchlist: View: Get PSA Trend Analysis ➞ | |
 | ROL Rollins, Inc. |
| Sector: Services & Goods | |
| SubSector: Business Services | |
| MarketCap: 12827.4 Millions | |
| Recent Price: 44.68 Smart Investing & Trading Score: 58 | |
| Day Percent Change: 0.27% Day Change: 0.12 | |
| Week Change: -0.49% Year-to-date Change: 2.3% | |
| ROL Links: Profile News Message Board | |
| Charts:- Daily , Weekly | |
| Add ROL to Watchlist: View: Get ROL Trend Analysis ➞ | |
 | CTLT Catalent, Inc. |
| Sector: Health Care | |
| SubSector: Drugs - Generic | |
| MarketCap: 6351.95 Millions | |
| Recent Price: 56.00 Smart Investing & Trading Score: 42 | |
| Day Percent Change: 0.27% Day Change: 0.15 | |
| Week Change: 0.14% Year-to-date Change: 24.6% | |
| CTLT Links: Profile News Message Board | |
| Charts:- Daily , Weekly | |
| Add CTLT to Watchlist: View: Get CTLT Trend Analysis ➞ | |
 | KO The Coca-Cola Company |
| Sector: Consumer Staples | |
| SubSector: Beverages - Soft Drinks | |
| MarketCap: 182046 Millions | |
| Recent Price: 61.93 Smart Investing & Trading Score: 76 | |
| Day Percent Change: 0.26% Day Change: 0.16 | |
| Week Change: 0.31% Year-to-date Change: 5.1% | |
| KO Links: Profile News Message Board | |
| Charts:- Daily , Weekly | |
| Add KO to Watchlist: View: Get KO Trend Analysis ➞ | |
 | DLTR Dollar Tree, Inc. |
| Sector: Services & Goods | |
| SubSector: Discount, Variety Stores | |
| MarketCap: 21383.2 Millions | |
| Recent Price: 118.56 Smart Investing & Trading Score: 17 | |
| Day Percent Change: 0.26% Day Change: 0.31 | |
| Week Change: -2.61% Year-to-date Change: -16.5% | |
| DLTR Links: Profile News Message Board | |
| Charts:- Daily , Weekly | |
| Add DLTR to Watchlist: View: Get DLTR Trend Analysis ➞ | |
 | AVY Avery Dennison Corporation |
| Sector: Consumer Staples | |
| SubSector: Business Equipment | |
| MarketCap: 8051.27 Millions | |
| Recent Price: 217.83 Smart Investing & Trading Score: 60 | |
| Day Percent Change: 0.25% Day Change: 0.55 | |
| Week Change: -0.55% Year-to-date Change: 7.8% | |
| AVY Links: Profile News Message Board | |
| Charts:- Daily , Weekly | |
| Add AVY to Watchlist: View: Get AVY Trend Analysis ➞ | |
 | OTIS Otis Worldwide Corporation |
| Sector: Industrials | |
| SubSector: Specialty Industrial Machinery | |
| MarketCap: 27727 Millions | |
| Recent Price: 91.43 Smart Investing & Trading Score: 10 | |
| Day Percent Change: 0.25% Day Change: 0.23 | |
| Week Change: -0.84% Year-to-date Change: 2.2% | |
| OTIS Links: Profile News Message Board | |
| Charts:- Daily , Weekly | |
| Add OTIS to Watchlist: View: Get OTIS Trend Analysis ➞ | |
 | NVR NVR, Inc. |
| Sector: Industrials | |
| SubSector: Residential Construction | |
| MarketCap: 9912.56 Millions | |
| Recent Price: 7457.00 Smart Investing & Trading Score: 7 | |
| Day Percent Change: 0.24% Day Change: 18.15 | |
| Week Change: -2.49% Year-to-date Change: 6.5% | |
| NVR Links: Profile News Message Board | |
| Charts:- Daily , Weekly | |
| Add NVR to Watchlist: View: Get NVR Trend Analysis ➞ | |
 | CPRT Copart, Inc. |
| Sector: Services & Goods | |
| SubSector: Auto Dealerships | |
| MarketCap: 15462.1 Millions | |
| Recent Price: 54.44 Smart Investing & Trading Score: 33 | |
| Day Percent Change: 0.24% Day Change: 0.13 | |
| Week Change: -2.31% Year-to-date Change: 11.1% | |
| CPRT Links: Profile News Message Board | |
| Charts:- Daily , Weekly | |
| Add CPRT to Watchlist: View: Get CPRT Trend Analysis ➞ | |
 | CMCSA Comcast Corporation |
| Sector: Services & Goods | |
| SubSector: Entertainment - Diversified | |
| MarketCap: 164849 Millions | |
| Recent Price: 38.20 Smart Investing & Trading Score: 10 | |
| Day Percent Change: 0.24% Day Change: 0.09 | |
| Week Change: -0.96% Year-to-date Change: -12.9% | |
| CMCSA Links: Profile News Message Board | |
| Charts:- Daily , Weekly | |
| Add CMCSA to Watchlist: View: Get CMCSA Trend Analysis ➞ | |
 | STE STERIS plc |
| Sector: Health Care | |
| SubSector: Medical Instruments & Supplies | |
| MarketCap: 10875 Millions | |
| Recent Price: 205.04 Smart Investing & Trading Score: 49 | |
| Day Percent Change: 0.23% Day Change: 0.48 | |
| Week Change: 0.56% Year-to-date Change: -6.7% | |
| STE Links: Profile News Message Board | |
| Charts:- Daily , Weekly | |
| Add STE to Watchlist: View: Get STE Trend Analysis ➞ | |
 | HLT Hilton Worldwide Holdings Inc. |
| Sector: Services & Goods | |
| SubSector: Lodging | |
| MarketCap: 18064.6 Millions | |
| Recent Price: 197.74 Smart Investing & Trading Score: 7 | |
| Day Percent Change: 0.23% Day Change: 0.46 | |
| Week Change: -2.17% Year-to-date Change: 8.6% | |
| HLT Links: Profile News Message Board | |
| Charts:- Daily , Weekly | |
| Add HLT to Watchlist: View: Get HLT Trend Analysis ➞ | |
 | FTV Fortive Corporation |
| Sector: Technology | |
| SubSector: Scientific & Technical Instruments | |
| MarketCap: 16351.9 Millions | |
| Recent Price: 75.44 Smart Investing & Trading Score: 18 | |
| Day Percent Change: 0.23% Day Change: 0.17 | |
| Week Change: -0.7% Year-to-date Change: 2.5% | |
| FTV Links: Profile News Message Board | |
| Charts:- Daily , Weekly | |
| Add FTV to Watchlist: View: Get FTV Trend Analysis ➞ | |
 | EFX Equifax Inc. |
| Sector: Financials | |
| SubSector: Credit Services | |
| MarketCap: 13754.6 Millions | |
| Recent Price: 220.67 Smart Investing & Trading Score: 10 | |
| Day Percent Change: 0.22% Day Change: 0.48 | |
| Week Change: -1.23% Year-to-date Change: -10.8% | |
| EFX Links: Profile News Message Board | |
| Charts:- Daily , Weekly | |
| Add EFX to Watchlist: View: Get EFX Trend Analysis ➞ | |
 | PCAR PACCAR Inc |
| Sector: Consumer Staples | |
| SubSector: Trucks & Other Vehicles | |
| MarketCap: 19117.7 Millions | |
| Recent Price: 106.34 Smart Investing & Trading Score: 0 | |
| Day Percent Change: 0.22% Day Change: 0.23 | |
| Week Change: -5.02% Year-to-date Change: 8.9% | |
| PCAR Links: Profile News Message Board | |
| Charts:- Daily , Weekly | |
| Add PCAR to Watchlist: View: Get PCAR Trend Analysis ➞ | |
 | TXT Textron Inc. |
| Sector: Industrials | |
| SubSector: Aerospace/Defense - Major Diversified | |
| MarketCap: 6123.09 Millions | |
| Recent Price: 84.77 Smart Investing & Trading Score: 10 | |
| Day Percent Change: 0.21% Day Change: 0.18 | |
| Week Change: -2.01% Year-to-date Change: 5.4% | |
| TXT Links: Profile News Message Board | |
| Charts:- Daily , Weekly | |
| Add TXT to Watchlist: View: Get TXT Trend Analysis ➞ | |
| For tabular summary view of above stock list: Summary View ➞ 0 - 25 , 25 - 50 , 50 - 75 , 75 - 100 , 100 - 125 , 125 - 150 , 150 - 175 , 175 - 200 , 200 - 225 , 225 - 250 , 250 - 275 , 275 - 300 , 300 - 325 , 325 - 350 , 350 - 375 , 375 - 400 , 400 - 425 , 425 - 450 , 450 - 475 , 475 - 500 | ||
| Click To Change The Sort Order: By Market Cap or Company Size Performance: Year-to-date, Week and Day | |
| Select Chart Type: | ||
|
Best Stocks Today 12Stocks.com |
© 2024 12Stocks.com Terms & Conditions Privacy Contact Us
All Information Provided Only For Education And Not To Be Used For Investing or Trading. See Terms & Conditions


One More Thing ... Get Best Stocks Delivered Daily!
Never Ever Miss A Move With Our Top Ten Stocks Lists
Find Best Stocks In Any Market - Bull or Bear Market
Take A Peek At Our Top Ten Stocks Lists: Daily, Weekly, Year-to-Date & Top Trends
Find Best Stocks In Any Market - Bull or Bear Market
Take A Peek At Our Top Ten Stocks Lists: Daily, Weekly, Year-to-Date & Top Trends
S&P 500 Stocks With Best Up Trends [0-bearish to 100-bullish]: Garmin [100], Amcor [100], DuPont de[100], Pfizer [100], American Electric[100], NextEra [100], Arch Capital[100], American Water[100], 3M [100], PPL [100], Pinnacle West[100]
Best S&P 500 Stocks Year-to-Date:
NVIDIA [67.69%], Constellation [57.66%], NRG [42.48%], Chipotle Mexican[37.24%], Western Digital[34.64%], DaVita [33.4%], Eli Lilly[33.25%], Progressive [32.97%], Leidos Holdings[31.37%], Eaton [29.57%], Targa Resources[29.4%] Best S&P 500 Stocks This Week:
Bio-Techne [14.67%], Garmin [13.92%], Amcor [9.25%], Leidos Holdings[9.07%], 3M [7.2%], Pfizer [7.01%], Tesla [6.95%], Corning [6.86%], DuPont de[6.24%], Eli Lilly[5.89%], Cincinnati Financial[5.79%] Best S&P 500 Stocks Daily:
Bio-Techne [16.22%], Garmin [13.12%], Amcor [9.62%], DuPont de[8.01%], Verisk Analytics[6.81%], Pfizer [6.09%], Johnson & Johnson[4.56%], Globe Life[4.35%], Humana [4.01%], Extra Space[3.29%], American Tower[3.08%]