
 Login Sign Up


| |||||
 |  | ||||

| 12Stocks.com Market Intelligence |
Best Healthcare Stocks
 | "Discover best trending healthcare stocks with 12Stocks.com." |
| - Subu Vdaygiri, Founder, 12Stocks.com |
| In a hurry? Healthcare Stocks Lists: Performance Trends Table, Stock Charts
Sort Healthcare stocks: Daily, Weekly, Year-to-Date, Market Cap & Trends. Filter Healthcare stocks list by size:All Healthcare Large Mid-Range Small |
| 12Stocks.com Healthcare Stocks Performances & Trends Daily | |||||||||
|
|  The overall Smart Investing & Trading Score is 57 (0-bearish to 100-bullish) which puts Healthcare sector in short term neutral trend. The Smart Investing & Trading Score from previous trading session is 60 and a deterioration of trend continues.
| ||||||||
Here are the Smart Investing & Trading Scores of the most requested Healthcare stocks at 12Stocks.com (click stock name for detailed review):
|


| 12Stocks.com: Investing in Healthcare sector with Stocks | |
|
The following table helps investors and traders sort through current performance and trends (as measured by Smart Investing & Trading Score) of various
stocks in the Healthcare sector. Quick View: Move mouse or cursor over stock symbol (ticker) to view short-term Technical chart and over stock name to view long term chart. Click on  to add stock symbol to your watchlist and to add stock symbol to your watchlist and  to view watchlist. Click on any ticker or stock name for detailed market intelligence report for that stock. to view watchlist. Click on any ticker or stock name for detailed market intelligence report for that stock. |
12Stocks.com Performance of Stocks in Healthcare Sector
| Ticker | Stock Name | Watchlist | Category | Recent Price | Smart Investing & Trading Score | Change % | Weekly Change% |
| MNOV | MediciNova |   | Biotechnology | 1.31 | 20 | 0.00% | 0.00% |
| NCNA | NuCana | | Biotechnology | 4.00 | 90 | 0.88% | 0.00% |
| DCGO | DocGo | | Medical Care Facilities | 3.61 | 74 | 6.33% | 0.00% |
| GRTX | Galera | | Biotechnology | 0.19 | 42 | -3.93% | -0.05% |
| SGRY | Surgery Partners | | Hospitals | 24.53 | 29 | -1.88% | -0.08% |
| CYTK | Cytokinetics | | Biotechnology | 65.27 | 32 | 1.45% | -0.11% |
| SLGL | Sol-Gel Technologies | | Biotechnology | 0.85 | 57 | 0.00% | -0.12% |
| CRBU | Caribou Biosciences | | Biotechnology | 3.71 | 42 | 1.37% | -0.13% |
| NVS | Novartis AG | | Pharmaceutical | 97.27 | 47 | -0.07% | -0.17% |
| TCMD | Tactile Systems | | Instruments | 14.28 | 32 | -1.14% | -0.17% |
| PHVS | Pharvaris N.V | | Biotechnology | 23.31 | 51 | -3.52% | -0.17% |
| VERO | Venus Concept | | Equipment | 0.68 | 50 | -1.68% | -0.18% |
| TMO | Thermo Fisher | | Laboratories | 572.38 | 60 | 0.20% | -0.21% |
| SNY | Sanofi | | Pharmaceutical | 49.01 | 83 | -0.91% | -0.24% |
| PRAX | Praxis Precision | | Biotechnology | 54.67 | 46 | 0.94% | -0.24% |
| NVRO | Nevro | | Equipment | 11.29 | 52 | 1.26% | -0.27% |
| OGI | OrganiGram | | Pharmaceutical | 1.86 | 7 | -1.33% | -0.27% |
| ENSG | Ensign | | Long-Term | 116.89 | 7 | 0.29% | -0.31% |
| RGC | Regencell Bioscience | | Drug Manufacturers - Specialty & Generic | 5.33 | 10 | -17.87% | -0.37% |
| INVA | Innoviva | | Biotechnology | 15.20 | 60 | -1.11% | -0.39% |
| AKRO | Akero | | Biotechnology | 19.66 | 20 | -0.25% | -0.41% |
| BSX | Boston Scientific | | Equipment | 72.85 | 85 | 1.14% | -0.44% |
| EMBC | Embecta | | Instruments | 10.26 | 60 | 0.20% | -0.48% |
| RMD | ResMed | | Instruments | 216.98 | 90 | -0.54% | -0.50% |
| TARA | ArTara | | Biotechnology | 2.91 | 10 | 0.69% | -0.51% |
| For chart view version of above stock list: Chart View ➞ 0 - 25 , 25 - 50 , 50 - 75 , 75 - 100 , 100 - 125 , 125 - 150 , 150 - 175 , 175 - 200 , 200 - 225 , 225 - 250 , 250 - 275 , 275 - 300 , 300 - 325 , 325 - 350 , 350 - 375 , 375 - 400 , 400 - 425 , 425 - 450 , 450 - 475 , 475 - 500 , 500 - 525 , 525 - 550 , 550 - 575 , 575 - 600 , 600 - 625 , 625 - 650 , 650 - 675 , 675 - 700 , 700 - 725 | ||
 | Click To Change The Sort Order: By Market Cap or Company Size Performance: Year-to-date, Week and Day |  |
|
Get the most comprehensive stock market coverage daily at 12Stocks.com ➞ Best Stocks Today ➞ Best Stocks Weekly ➞ Best Stocks Year-to-Date ➞ Best Stocks Trends ➞  Best Stocks Today 12Stocks.com Best Nasdaq Stocks ➞ Best S&P 500 Stocks ➞ Best Tech Stocks ➞ Best Biotech Stocks ➞ |
| Detailed Overview of Healthcare Stocks |
| Healthcare Technical Overview, Leaders & Laggards, Top Healthcare ETF Funds & Detailed Healthcare Stocks List, Charts, Trends & More |
| Healthcare Sector: Technical Analysis, Trends & YTD Performance | |
| Healthcare sector is composed of stocks
from pharmaceutical, biotech, diagnostics labs, insurance providers
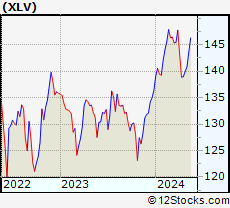
and healthcare services. Healthcare sector, as represented by XLV, an exchange-traded fund [ETF] that holds basket of Healthcare stocks (e.g, Merck, Amgen) is up by 3.26% and is currently underperforming the overall market by -3.62% year-to-date. Below is a quick view of Technical charts and trends: |
|
 XLV Weekly Chart |
|
| Long Term Trend: Not Good | |
| Medium Term Trend: Good | |
 XLV Daily Chart |
|
| Short Term Trend: Very Good | |
| Overall Trend Score: 57 | |
| YTD Performance: 3.26% | |
| **Trend Scores & Views Are Only For Educational Purposes And Not For Investing | |
| 12Stocks.com: Top Performing Healthcare Sector Stocks | ||||||||||||||||||||||||||||||||||||||||||||||||
 The top performing Healthcare sector stocks year to date are
Now, more recently, over last week, the top performing Healthcare sector stocks on the move are


|
||||||||||||||||||||||||||||||||||||||||||||||||
| 12Stocks.com: Investing in Healthcare Sector using Exchange Traded Funds | |
|
The following table shows list of key exchange traded funds (ETF) that
help investors track Healthcare Index. For detailed view, check out our ETF Funds section of our website. Quick View: Move mouse or cursor over ETF symbol (ticker) to view short-term Technical chart and over ETF name to view long term chart. Click on ticker or stock name for detailed view. Click on to add stock symbol to your watchlist and to view watchlist. |
12Stocks.com List of ETFs that track Healthcare Index
| Ticker | ETF Name | Watchlist | Recent Price | Smart Investing & Trading Score | Change % | Week % | Year-to-date % |
| XLV | Health Care | | 140.83 | 57 | 0.25 | 0.62 | 3.26% |
| XBI | Biotech | | 89.98 | 69 | 1.86 | 7.77 | 0.77% |
| IBB | Biotechnology | | 132.96 | 69 | 1.77 | 5.12 | -2.13% |
| BBH | Biotech | | 164.15 | 100 | 2.27 | 5.46 | -0.7% |
| VHT | Health Care | | 258.02 | 57 | 0.34 | 1.06 | 2.92% |
| IYH | Healthcare | | 59.26 | 57 | 0.24 | 1.11 | 3.51% |
| IHF | Healthcare Providers | | 51.69 | 30 | 0.08 | -0.44 | -1.56% |
| IHI | Medical Devices | | 55.49 | 32 | 0.60 | -0.07 | 2.82% |
| BIB | Biotechnology | | 55.63 | 74 | 3.40 | 12.02 | -2.49% |
| BIS | Short Biotech | | 17.99 | 36 | -3.59 | -11.03 | -0.44% |
| XHE | Health Care Equipment | | 85.99 | 87 | 1.30 | 4.32 | 2.05% |
| CURE | Healthcare Bull 3X | | 106.89 | 57 | 1.02 | 1.51 | 5.06% |
| LABU | Biotech Bull 3X | | 108.99 | 64 | 5.83 | 24.55 | -10.64% |
| LABD | Biotech Bear 3X | | 8.28 | 36 | -5.48 | -21.29 | -14.55% |
| PSCH | SmallCap Health Care | | 42.43 | 82 | 0.90 | 4.25 | -0.86% |
| XHS | Health Care Services | | 88.53 | 39 | 0.44 | 0.75 | -0.47% |
| PTH | DWA Healthcare Momentum | | 42.05 | 62 | 0.74 | 5.41 | 7.43% |
| BTEC | Principal Healthcare Innovators | | 36.97 | 69 | 2.74 | 7.94 | 1.76% |
| RXL | Health Care | | 95.65 | 57 | 0.46 | 0.87 | 4.64% |
| RXD | Short Health Care | | 11.29 | 49 | -0.49 | -1.44 | -5.37% |
| 12Stocks.com: Charts, Trends, Fundamental Data and Performances of Healthcare Stocks | |
|
We now take in-depth look at all Healthcare stocks including charts, multi-period performances and overall trends (as measured by Smart Investing & Trading Score). One can sort Healthcare stocks (click link to choose) by Daily, Weekly and by Year-to-Date performances. Also, one can sort by size of the company or by market capitalization. |
| Select Your Default Chart Type: | |||||
| |||||
| Click on stock symbol or name for detailed view. Click on to add stock symbol to your watchlist and to view watchlist. Quick View: Move mouse or cursor over "Daily" to quickly view daily Technical stock chart and over "Weekly" to view weekly Technical stock chart. | |||||

 | MNOV MediciNova, Inc. |
| Sector: Health Care | |
| SubSector: Biotechnology | |
| MarketCap: 137.685 Millions | |
| Recent Price: 1.31 Smart Investing & Trading Score: 20 | |
| Day Percent Change: 0.00% Day Change: 0.00 | |
| Week Change: 0% Year-to-date Change: -12.7% | |
| MNOV Links: Profile News Message Board | |
| Charts:- Daily , Weekly | |
| Add MNOV to Watchlist: View: Get Complete MNOV Trend Analysis ➞ | |
 | NCNA NuCana plc |
| Sector: Health Care | |
| SubSector: Biotechnology | |
| MarketCap: 185.785 Millions | |
| Recent Price: 4.00 Smart Investing & Trading Score: 90 | |
| Day Percent Change: 0.88% Day Change: 0.04 | |
| Week Change: 0% Year-to-date Change: 1,252.3% | |
| NCNA Links: Profile News Message Board | |
| Charts:- Daily , Weekly | |
| Add NCNA to Watchlist: View: Get Complete NCNA Trend Analysis ➞ | |
 | DCGO DocGo Inc. |
| Sector: Health Care | |
| SubSector: Medical Care Facilities | |
| MarketCap: 972 Millions | |
| Recent Price: 3.61 Smart Investing & Trading Score: 74 | |
| Day Percent Change: 6.33% Day Change: 0.21 | |
| Week Change: 0% Year-to-date Change: -35.4% | |
| DCGO Links: Profile News Message Board | |
| Charts:- Daily , Weekly | |
| Add DCGO to Watchlist: View: Get Complete DCGO Trend Analysis ➞ | |
 | GRTX Galera Therapeutics, Inc. |
| Sector: Health Care | |
| SubSector: Biotechnology | |
| MarketCap: 277.585 Millions | |
| Recent Price: 0.19 Smart Investing & Trading Score: 42 | |
| Day Percent Change: -3.93% Day Change: -0.01 | |
| Week Change: -0.05% Year-to-date Change: 27.9% | |
| GRTX Links: Profile News Message Board | |
| Charts:- Daily , Weekly | |
| Add GRTX to Watchlist: View: Get Complete GRTX Trend Analysis ➞ | |
 | SGRY Surgery Partners, Inc. |
| Sector: Health Care | |
| SubSector: Hospitals | |
| MarketCap: 328.446 Millions | |
| Recent Price: 24.53 Smart Investing & Trading Score: 29 | |
| Day Percent Change: -1.88% Day Change: -0.47 | |
| Week Change: -0.08% Year-to-date Change: -23.3% | |
| SGRY Links: Profile News Message Board | |
| Charts:- Daily , Weekly | |
| Add SGRY to Watchlist: View: Get Complete SGRY Trend Analysis ➞ | |
 | CYTK Cytokinetics, Incorporated |
| Sector: Health Care | |
| SubSector: Biotechnology | |
| MarketCap: 654.285 Millions | |
| Recent Price: 65.27 Smart Investing & Trading Score: 32 | |
| Day Percent Change: 1.45% Day Change: 0.93 | |
| Week Change: -0.11% Year-to-date Change: -21.8% | |
| CYTK Links: Profile News Message Board | |
| Charts:- Daily , Weekly | |
| Add CYTK to Watchlist: View: Get Complete CYTK Trend Analysis ➞ | |
 | SLGL Sol-Gel Technologies Ltd. |
| Sector: Health Care | |
| SubSector: Biotechnology | |
| MarketCap: 183.285 Millions | |
| Recent Price: 0.85 Smart Investing & Trading Score: 57 | |
| Day Percent Change: 0.00% Day Change: 0.00 | |
| Week Change: -0.12% Year-to-date Change: -23.1% | |
| SLGL Links: Profile News Message Board | |
| Charts:- Daily , Weekly | |
| Add SLGL to Watchlist: View: Get Complete SLGL Trend Analysis ➞ | |
 | CRBU Caribou Biosciences, Inc. |
| Sector: Health Care | |
| SubSector: Biotechnology | |
| MarketCap: 258 Millions | |
| Recent Price: 3.71 Smart Investing & Trading Score: 42 | |
| Day Percent Change: 1.37% Day Change: 0.05 | |
| Week Change: -0.13% Year-to-date Change: -35.1% | |
| CRBU Links: Profile News Message Board | |
| Charts:- Daily , Weekly | |
| Add CRBU to Watchlist: View: Get Complete CRBU Trend Analysis ➞ | |
 | NVS Novartis AG |
| Sector: Health Care | |
| SubSector: Drug Manufacturers - Major | |
| MarketCap: 203929 Millions | |
| Recent Price: 97.27 Smart Investing & Trading Score: 47 | |
| Day Percent Change: -0.07% Day Change: -0.07 | |
| Week Change: -0.17% Year-to-date Change: -3.7% | |
| NVS Links: Profile News Message Board | |
| Charts:- Daily , Weekly | |
| Add NVS to Watchlist: View: Get Complete NVS Trend Analysis ➞ | |
 | TCMD Tactile Systems Technology, Inc. |
| Sector: Health Care | |
| SubSector: Medical Instruments & Supplies | |
| MarketCap: 655.96 Millions | |
| Recent Price: 14.28 Smart Investing & Trading Score: 32 | |
| Day Percent Change: -1.14% Day Change: -0.16 | |
| Week Change: -0.17% Year-to-date Change: -0.2% | |
| TCMD Links: Profile News Message Board | |
| Charts:- Daily , Weekly | |
| Add TCMD to Watchlist: View: Get Complete TCMD Trend Analysis ➞ | |
 | PHVS Pharvaris N.V. |
| Sector: Health Care | |
| SubSector: Biotechnology | |
| MarketCap: 475 Millions | |
| Recent Price: 23.31 Smart Investing & Trading Score: 51 | |
| Day Percent Change: -3.52% Day Change: -0.85 | |
| Week Change: -0.17% Year-to-date Change: -17.7% | |
| PHVS Links: Profile News Message Board | |
| Charts:- Daily , Weekly | |
| Add PHVS to Watchlist: View: Get Complete PHVS Trend Analysis ➞ | |
 | VERO Venus Concept Inc. |
| Sector: Health Care | |
| SubSector: Medical Appliances & Equipment | |
| MarketCap: 101.08 Millions | |
| Recent Price: 0.68 Smart Investing & Trading Score: 50 | |
| Day Percent Change: -1.68% Day Change: -0.01 | |
| Week Change: -0.18% Year-to-date Change: -42.1% | |
| VERO Links: Profile News Message Board | |
| Charts:- Daily , Weekly | |
| Add VERO to Watchlist: View: Get Complete VERO Trend Analysis ➞ | |
 | TMO Thermo Fisher Scientific Inc. |
| Sector: Health Care | |
| SubSector: Medical Laboratories & Research | |
| MarketCap: 112999 Millions | |
| Recent Price: 572.38 Smart Investing & Trading Score: 60 | |
| Day Percent Change: 0.20% Day Change: 1.13 | |
| Week Change: -0.21% Year-to-date Change: 7.8% | |
| TMO Links: Profile News Message Board | |
| Charts:- Daily , Weekly | |
| Add TMO to Watchlist: View: Get Complete TMO Trend Analysis ➞ | |
 | SNY Sanofi |
| Sector: Health Care | |
| SubSector: Drug Manufacturers - Major | |
| MarketCap: 104761 Millions | |
| Recent Price: 49.01 Smart Investing & Trading Score: 83 | |
| Day Percent Change: -0.91% Day Change: -0.45 | |
| Week Change: -0.24% Year-to-date Change: -1.5% | |
| SNY Links: Profile News Message Board | |
| Charts:- Daily , Weekly | |
| Add SNY to Watchlist: View: Get Complete SNY Trend Analysis ➞ | |
 | PRAX Praxis Precision Medicines, Inc. |
| Sector: Health Care | |
| SubSector: Biotechnology | |
| MarketCap: 16587 Millions | |
| Recent Price: 54.67 Smart Investing & Trading Score: 46 | |
| Day Percent Change: 0.94% Day Change: 0.51 | |
| Week Change: -0.24% Year-to-date Change: 143.6% | |
| PRAX Links: Profile News Message Board | |
| Charts:- Daily , Weekly | |
| Add PRAX to Watchlist: View: Get Complete PRAX Trend Analysis ➞ | |
 | NVRO Nevro Corp. |
| Sector: Health Care | |
| SubSector: Medical Appliances & Equipment | |
| MarketCap: 2489.3 Millions | |
| Recent Price: 11.29 Smart Investing & Trading Score: 52 | |
| Day Percent Change: 1.26% Day Change: 0.14 | |
| Week Change: -0.27% Year-to-date Change: -47.5% | |
| NVRO Links: Profile News Message Board | |
| Charts:- Daily , Weekly | |
| Add NVRO to Watchlist: View: Get Complete NVRO Trend Analysis ➞ | |
 | OGI OrganiGram Holdings Inc. |
| Sector: Health Care | |
| SubSector: Drugs - Generic | |
| MarketCap: 256.885 Millions | |
| Recent Price: 1.86 Smart Investing & Trading Score: 7 | |
| Day Percent Change: -1.33% Day Change: -0.02 | |
| Week Change: -0.27% Year-to-date Change: 41.6% | |
| OGI Links: Profile News Message Board | |
| Charts:- Daily , Weekly | |
| Add OGI to Watchlist: View: Get Complete OGI Trend Analysis ➞ | |
 | ENSG The Ensign Group, Inc. |
| Sector: Health Care | |
| SubSector: Long-Term Care Facilities | |
| MarketCap: 2053.76 Millions | |
| Recent Price: 116.89 Smart Investing & Trading Score: 7 | |
| Day Percent Change: 0.29% Day Change: 0.34 | |
| Week Change: -0.31% Year-to-date Change: 4.2% | |
| ENSG Links: Profile News Message Board | |
| Charts:- Daily , Weekly | |
| Add ENSG to Watchlist: View: Get Complete ENSG Trend Analysis ➞ | |
 | RGC Regencell Bioscience Holdings Limited |
| Sector: Health Care | |
| SubSector: Drug Manufacturers - Specialty & Generic | |
| MarketCap: 284 Millions | |
| Recent Price: 5.33 Smart Investing & Trading Score: 10 | |
| Day Percent Change: -17.87% Day Change: -1.16 | |
| Week Change: -0.37% Year-to-date Change: -49.2% | |
| RGC Links: Profile News Message Board | |
| Charts:- Daily , Weekly | |
| Add RGC to Watchlist: View: Get Complete RGC Trend Analysis ➞ | |
 | INVA Innoviva, Inc. |
| Sector: Health Care | |
| SubSector: Biotechnology | |
| MarketCap: 1023.15 Millions | |
| Recent Price: 15.20 Smart Investing & Trading Score: 60 | |
| Day Percent Change: -1.11% Day Change: -0.17 | |
| Week Change: -0.39% Year-to-date Change: -5.2% | |
| INVA Links: Profile News Message Board | |
| Charts:- Daily , Weekly | |
| Add INVA to Watchlist: View: Get Complete INVA Trend Analysis ➞ | |
 | AKRO Akero Therapeutics, Inc. |
| Sector: Health Care | |
| SubSector: Biotechnology | |
| MarketCap: 675.085 Millions | |
| Recent Price: 19.66 Smart Investing & Trading Score: 20 | |
| Day Percent Change: -0.25% Day Change: -0.05 | |
| Week Change: -0.41% Year-to-date Change: -15.8% | |
| AKRO Links: Profile News Message Board | |
| Charts:- Daily , Weekly | |
| Add AKRO to Watchlist: View: Get Complete AKRO Trend Analysis ➞ | |
 | BSX Boston Scientific Corporation |
| Sector: Health Care | |
| SubSector: Medical Appliances & Equipment | |
| MarketCap: 41541.2 Millions | |
| Recent Price: 72.85 Smart Investing & Trading Score: 85 | |
| Day Percent Change: 1.14% Day Change: 0.82 | |
| Week Change: -0.44% Year-to-date Change: 26.0% | |
| BSX Links: Profile News Message Board | |
| Charts:- Daily , Weekly | |
| Add BSX to Watchlist: View: Get Complete BSX Trend Analysis ➞ | |
 | EMBC Embecta Corp. |
| Sector: Health Care | |
| SubSector: Medical Instruments & Supplies | |
| MarketCap: 1260 Millions | |
| Recent Price: 10.26 Smart Investing & Trading Score: 60 | |
| Day Percent Change: 0.20% Day Change: 0.02 | |
| Week Change: -0.48% Year-to-date Change: -46.3% | |
| EMBC Links: Profile News Message Board | |
| Charts:- Daily , Weekly | |
| Add EMBC to Watchlist: View: Get Complete EMBC Trend Analysis ➞ | |
 | RMD ResMed Inc. |
| Sector: Health Care | |
| SubSector: Medical Instruments & Supplies | |
| MarketCap: 18660.2 Millions | |
| Recent Price: 216.98 Smart Investing & Trading Score: 90 | |
| Day Percent Change: -0.54% Day Change: -1.17 | |
| Week Change: -0.5% Year-to-date Change: 26.1% | |
| RMD Links: Profile News Message Board | |
| Charts:- Daily , Weekly | |
| Add RMD to Watchlist: View: Get Complete RMD Trend Analysis ➞ | |
 | TARA ArTara Therapeutics, Inc. |
| Sector: Health Care | |
| SubSector: Biotechnology | |
| MarketCap: 140.685 Millions | |
| Recent Price: 2.91 Smart Investing & Trading Score: 10 | |
| Day Percent Change: 0.69% Day Change: 0.02 | |
| Week Change: -0.51% Year-to-date Change: 55.2% | |
| TARA Links: Profile News Message Board | |
| Charts:- Daily , Weekly | |
| Add TARA to Watchlist: View: Get Complete TARA Trend Analysis ➞ | |
| For tabular summary view of above stock list: Summary View ➞ 0 - 25 , 25 - 50 , 50 - 75 , 75 - 100 , 100 - 125 , 125 - 150 , 150 - 175 , 175 - 200 , 200 - 225 , 225 - 250 , 250 - 275 , 275 - 300 , 300 - 325 , 325 - 350 , 350 - 375 , 375 - 400 , 400 - 425 , 425 - 450 , 450 - 475 , 475 - 500 , 500 - 525 , 525 - 550 , 550 - 575 , 575 - 600 , 600 - 625 , 625 - 650 , 650 - 675 , 675 - 700 , 700 - 725 | ||
| Click To Change The Sort Order: By Market Cap or Company Size Performance: Year-to-date, Week and Day | |
| Select Chart Type: | ||
|
Best Stocks Today 12Stocks.com |
© 2024 12Stocks.com Terms & Conditions Privacy Contact Us
All Information Provided Only For Education And Not To Be Used For Investing or Trading. See Terms & Conditions


One More Thing ... Get Best Stocks Delivered Daily!
Never Ever Miss A Move With Our Top Ten Stocks Lists
Find Best Stocks In Any Market - Bull or Bear Market
Take A Peek At Our Top Ten Stocks Lists: Daily, Weekly, Year-to-Date & Top Trends
Find Best Stocks In Any Market - Bull or Bear Market
Take A Peek At Our Top Ten Stocks Lists: Daily, Weekly, Year-to-Date & Top Trends
Healthcare Stocks With Best Up Trends [0-bearish to 100-bullish]: Twist Bioscience[100], Joint [100], Tandem Diabetes[100], Alignment [100], Emergent Bio[100], DURECT [100], Amgen [100], LeMaitre Vascular[100], Select [100], Quantum-Si [100], Janux [100]
Best Healthcare Stocks Year-to-Date:
Pieris [5987.91%], Avenue [2868.94%], Precision BioSciences[2782.19%], Inovio [2272.55%], Assembly Biosciences[1503.46%], Agenus [1478.69%], Aurora Cannabis[1315.37%], Adverum Biotechnologies[1285.49%], NuCana [1252.27%], Affimed N.V[767.2%], GeneDx [625.37%] Best Healthcare Stocks This Week:
CytomX [178.62%], Emergent Bio[102.6%], GeneDx [78.07%], Deciphera [73.24%], Cue Biopharma[56.04%], Codexis [47.37%], Abeona [41.1%], Seres [40.61%], TransMedics [39%], Ardelyx [35.83%], Poseida [35.21%] Best Healthcare Stocks Daily:
Twist Bioscience[28.74%], Ardelyx [28.42%], Joint [25.35%], Tandem Diabetes[22.32%], Alignment [21.97%], Emergent Bio[17.88%], Butterfly Network[17.42%], Codexis [17.37%], Vaxxinity [17.27%], DURECT [17.17%], OptiNose [15.09%]