
 Login Sign Up


| |||||
 |  | ||||

| 12Stocks.com Market Intelligence |
Best Healthcare Stocks
 | "Discover best trending healthcare stocks with 12Stocks.com." |
| - Subu Vdaygiri, Founder, 12Stocks.com |
| In a hurry? Healthcare Stocks Lists: Performance Trends Table, Stock Charts
Sort Healthcare stocks: Daily, Weekly, Year-to-Date, Market Cap & Trends. Filter Healthcare stocks list by size:All Healthcare Large Mid-Range Small |
| 12Stocks.com Healthcare Stocks Performances & Trends Daily | |||||||||
|
|  The overall Smart Investing & Trading Score is 52 (0-bearish to 100-bullish) which puts Healthcare sector in short term neutral trend. The Smart Investing & Trading Score from previous trading session is 38 and hence an improvement of trend.
| ||||||||
Here are the Smart Investing & Trading Scores of the most requested Healthcare stocks at 12Stocks.com (click stock name for detailed review):
|


| 12Stocks.com: Investing in Healthcare sector with Stocks | |
|
The following table helps investors and traders sort through current performance and trends (as measured by Smart Investing & Trading Score) of various
stocks in the Healthcare sector. Quick View: Move mouse or cursor over stock symbol (ticker) to view short-term Technical chart and over stock name to view long term chart. Click on  to add stock symbol to your watchlist and to add stock symbol to your watchlist and  to view watchlist. Click on any ticker or stock name for detailed market intelligence report for that stock. to view watchlist. Click on any ticker or stock name for detailed market intelligence report for that stock. |
12Stocks.com Performance of Stocks in Healthcare Sector
| Ticker | Stock Name | Watchlist | Category | Recent Price | Smart Investing & Trading Score | Change % | Weekly Change% |
| ZBH | Zimmer Biomet |   | Equipment | 121.52 | 37 | 0.61% | 1.75% |
| XBIT | XBiotech | | Biotechnology | 8.18 | 76 | 2.89% | 1.74% |
| ALKS | Alkermes | | Biotechnology | 24.26 | 32 | 0.79% | 1.72% |
| DERM | Dermira | | Biotechnology | 3.54 | 10 | 0.00% | 1.72% |
| AMGN | Amgen | | Biotechnology | 273.54 | 64 | 0.60% | 1.71% |
| GTHX | G1 | | Biotechnology | 4.19 | 61 | 2.20% | 1.70% |
| OCS | Oculis Holding | | Biotechnology | 11.98 | 52 | 0.25% | 1.70% |
| VREX | Varex Imaging | | Equipment | 17.27 | 52 | 1.23% | 1.65% |
| QTRX | Quanterix | | Biotechnology | 16.10 | 32 | -1.23% | 1.64% |
| OPK | OPKO Health | | Biotechnology | 1.25 | 85 | 1.63% | 1.63% |
| SRDX | Surmodics | | Diagnostic | 26.92 | 50 | 6.03% | 1.62% |
| MASI | Masimo | | Instruments | 136.95 | 68 | 1.96% | 1.62% |
| BHVN | Biohaven | | Biotechnology | 39.61 | 17 | 3.34% | 1.59% |
| OLK | Olink Holding | | Diagnostics & Research | 22.21 | 35 | 0.82% | 1.55% |
| LMAT | LeMaitre Vascular | | Instruments | 64.23 | 66 | 2.33% | 1.53% |
| ALC | Alcon | | Instruments | 80.76 | 58 | 0.19% | 1.52% |
| PRQR | ProQR | | Biotechnology | 2.02 | 39 | 0.25% | 1.51% |
| PTPI | Petros | | Biotechnology | 0.68 | 10 | 1.84% | 1.48% |
| INVA | Innoviva | | Biotechnology | 15.17 | 64 | 1.61% | 1.47% |
| PEN | Penumbra | | Instruments | 205.70 | 32 | 1.33% | 1.47% |
| FLGT | Fulgent Genetics | | Laboratories | 20.64 | 59 | 0.39% | 1.47% |
| CCCC | C4 | | Biotechnology | 6.90 | 56 | 0.58% | 1.47% |
| BLCO | Bausch + | | Instruments | 14.85 | 65 | 1.43% | 1.43% |
| OLMA | Olema | | Biotechnology | 10.00 | 42 | 1.32% | 1.42% |
| USNA | USANA Health | | Pharmaceutical | 44.75 | 59 | 1.18% | 1.40% |
| For chart view version of above stock list: Chart View ➞ 0 - 25 , 25 - 50 , 50 - 75 , 75 - 100 , 100 - 125 , 125 - 150 , 150 - 175 , 175 - 200 , 200 - 225 , 225 - 250 , 250 - 275 , 275 - 300 , 300 - 325 , 325 - 350 , 350 - 375 , 375 - 400 , 400 - 425 , 425 - 450 , 450 - 475 , 475 - 500 , 500 - 525 , 525 - 550 , 550 - 575 , 575 - 600 , 600 - 625 , 625 - 650 , 650 - 675 , 675 - 700 , 700 - 725 | ||
 | Click To Change The Sort Order: By Market Cap or Company Size Performance: Year-to-date, Week and Day |  |
|
Get the most comprehensive stock market coverage daily at 12Stocks.com ➞ Best Stocks Today ➞ Best Stocks Weekly ➞ Best Stocks Year-to-Date ➞ Best Stocks Trends ➞  Best Stocks Today 12Stocks.com Best Nasdaq Stocks ➞ Best S&P 500 Stocks ➞ Best Tech Stocks ➞ Best Biotech Stocks ➞ |
| Detailed Overview of Healthcare Stocks |
| Healthcare Technical Overview, Leaders & Laggards, Top Healthcare ETF Funds & Detailed Healthcare Stocks List, Charts, Trends & More |
| Healthcare Sector: Technical Analysis, Trends & YTD Performance | |
| Healthcare sector is composed of stocks
from pharmaceutical, biotech, diagnostics labs, insurance providers
and healthcare services. Healthcare sector, as represented by XLV, an exchange-traded fund [ETF] that holds basket of Healthcare stocks (e.g, Merck, Amgen) is up by 3.61% and is currently underperforming the overall market by -2.03% year-to-date. Below is a quick view of Technical charts and trends: |
|
 XLV Weekly Chart |
|
| Long Term Trend: Good | |
| Medium Term Trend: Not Good | |
 XLV Daily Chart |
|
| Short Term Trend: Very Good | |
| Overall Trend Score: 52 | |
| YTD Performance: 3.61% | |
| **Trend Scores & Views Are Only For Educational Purposes And Not For Investing | |
| 12Stocks.com: Top Performing Healthcare Sector Stocks | ||||||||||||||||||||||||||||||||||||||||||||||||
 The top performing Healthcare sector stocks year to date are
Now, more recently, over last week, the top performing Healthcare sector stocks on the move are


|
||||||||||||||||||||||||||||||||||||||||||||||||
| 12Stocks.com: Investing in Healthcare Sector using Exchange Traded Funds | |
|
The following table shows list of key exchange traded funds (ETF) that
help investors track Healthcare Index. For detailed view, check out our ETF Funds section of our website. Quick View: Move mouse or cursor over ETF symbol (ticker) to view short-term Technical chart and over ETF name to view long term chart. Click on ticker or stock name for detailed view. Click on to add stock symbol to your watchlist and to view watchlist. |
12Stocks.com List of ETFs that track Healthcare Index
| Ticker | ETF Name | Watchlist | Recent Price | Smart Investing & Trading Score | Change % | Week % | Year-to-date % |
| XLV | Health Care | | 141.30 | 52 | 1.30 | 1.69 | 3.61% |
| XBI | Biotech | | 84.69 | 32 | 2.28 | 2.25 | -5.15% |
| IBB | Biotechnology | | 128.02 | 32 | 1.51 | 2.65 | -5.76% |
| BBH | Biotech | | 157.29 | 49 | 1.77 | 3.24 | -4.85% |
| VHT | Health Care | | 257.82 | 52 | 1.29 | 1.77 | 2.84% |
| IYH | Healthcare | | 59.21 | 52 | 1.33 | 1.81 | 3.43% |
| IHF | Healthcare Providers | | 52.32 | 70 | 0.47 | 0.21 | -0.36% |
| IHI | Medical Devices | | 55.51 | 50 | 1.48 | 2.12 | 2.85% |
| BIB | Biotechnology | | 50.33 | 39 | 2.51 | 4.42 | -11.78% |
| BIS | Short Biotech | | 19.94 | 68 | -2.59 | -4.57 | 10.35% |
| XHE | Health Care Equipment | | 83.01 | 42 | 1.63 | 2.14 | -1.48% |
| CURE | Healthcare Bull 3X | | 108.12 | 39 | 3.52 | 4.64 | 6.27% |
| LABU | Biotech Bull 3X | | 91.98 | 32 | 6.42 | 6.89 | -24.59% |
| LABD | Biotech Bear 3X | | 10.07 | 55 | -6.33 | -6.76 | 3.92% |
| PSCH | SmallCap Health Care | | 41.22 | 55 | 2.05 | 2.58 | -3.7% |
| XHS | Health Care Services | | 88.75 | 75 | 1.49 | 1.91 | -0.22% |
| PTH | DWA Healthcare Momentum | | 40.17 | 68 | 2.11 | 1.62 | 2.63% |
| BTEC | Principal Healthcare Innovators | | 34.81 | 32 | 3.10 | 2.79 | -4.2% |
| RXL | Health Care | | 96.15 | 52 | 0.87 | 3.14 | 5.19% |
| RXD | Short Health Care | | 11.24 | 43 | -2.18 | -3.39 | -5.7% |
| 12Stocks.com: Charts, Trends, Fundamental Data and Performances of Healthcare Stocks | |
|
We now take in-depth look at all Healthcare stocks including charts, multi-period performances and overall trends (as measured by Smart Investing & Trading Score). One can sort Healthcare stocks (click link to choose) by Daily, Weekly and by Year-to-Date performances. Also, one can sort by size of the company or by market capitalization. |
| Select Your Default Chart Type: | |||||
| |||||
| Click on stock symbol or name for detailed view. Click on to add stock symbol to your watchlist and to view watchlist. Quick View: Move mouse or cursor over "Daily" to quickly view daily Technical stock chart and over "Weekly" to view weekly Technical stock chart. | |||||

 | ZBH Zimmer Biomet Holdings, Inc. |
| Sector: Health Care | |
| SubSector: Medical Appliances & Equipment | |
| MarketCap: 19339.4 Millions | |
| Recent Price: 121.52 Smart Investing & Trading Score: 37 | |
| Day Percent Change: 0.61% Day Change: 0.74 | |
| Week Change: 1.75% Year-to-date Change: -0.2% | |
| ZBH Links: Profile News Message Board | |
| Charts:- Daily , Weekly | |
| Add ZBH to Watchlist: View: Get Complete ZBH Trend Analysis ➞ | |
 | XBIT XBiotech Inc. |
| Sector: Health Care | |
| SubSector: Biotechnology | |
| MarketCap: 420.385 Millions | |
| Recent Price: 8.18 Smart Investing & Trading Score: 76 | |
| Day Percent Change: 2.89% Day Change: 0.23 | |
| Week Change: 1.74% Year-to-date Change: 104.5% | |
| XBIT Links: Profile News Message Board | |
| Charts:- Daily , Weekly | |
| Add XBIT to Watchlist: View: Get Complete XBIT Trend Analysis ➞ | |
 | ALKS Alkermes plc |
| Sector: Health Care | |
| SubSector: Biotechnology | |
| MarketCap: 2311.95 Millions | |
| Recent Price: 24.26 Smart Investing & Trading Score: 32 | |
| Day Percent Change: 0.79% Day Change: 0.19 | |
| Week Change: 1.72% Year-to-date Change: -12.6% | |
| ALKS Links: Profile News Message Board | |
| Charts:- Daily , Weekly | |
| Add ALKS to Watchlist: View: Get Complete ALKS Trend Analysis ➞ | |
 | DERM Dermira, Inc. |
| Sector: Health Care | |
| SubSector: Biotechnology | |
| MarketCap: 1312.25 Millions | |
| Recent Price: 3.54 Smart Investing & Trading Score: 10 | |
| Day Percent Change: 0.00% Day Change: 0.00 | |
| Week Change: 1.72% Year-to-date Change: -38.5% | |
| DERM Links: Profile News Message Board | |
| Charts:- Daily , Weekly | |
| Add DERM to Watchlist: View: Get Complete DERM Trend Analysis ➞ | |
 | AMGN Amgen Inc. |
| Sector: Health Care | |
| SubSector: Biotechnology | |
| MarketCap: 121030 Millions | |
| Recent Price: 273.54 Smart Investing & Trading Score: 64 | |
| Day Percent Change: 0.60% Day Change: 1.63 | |
| Week Change: 1.71% Year-to-date Change: -5.0% | |
| AMGN Links: Profile News Message Board | |
| Charts:- Daily , Weekly | |
| Add AMGN to Watchlist: View: Get Complete AMGN Trend Analysis ➞ | |
 | GTHX G1 Therapeutics, Inc. |
| Sector: Health Care | |
| SubSector: Biotechnology | |
| MarketCap: 484.085 Millions | |
| Recent Price: 4.19 Smart Investing & Trading Score: 61 | |
| Day Percent Change: 2.20% Day Change: 0.09 | |
| Week Change: 1.7% Year-to-date Change: 37.4% | |
| GTHX Links: Profile News Message Board | |
| Charts:- Daily , Weekly | |
| Add GTHX to Watchlist: View: Get Complete GTHX Trend Analysis ➞ | |
 | OCS Oculis Holding AG |
| Sector: Health Care | |
| SubSector: Biotechnology | |
| MarketCap: 460 Millions | |
| Recent Price: 11.98 Smart Investing & Trading Score: 52 | |
| Day Percent Change: 0.25% Day Change: 0.03 | |
| Week Change: 1.7% Year-to-date Change: 7.9% | |
| OCS Links: Profile News Message Board | |
| Charts:- Daily , Weekly | |
| Add OCS to Watchlist: View: Get Complete OCS Trend Analysis ➞ | |
 | VREX Varex Imaging Corporation |
| Sector: Health Care | |
| SubSector: Medical Appliances & Equipment | |
| MarketCap: 718.78 Millions | |
| Recent Price: 17.27 Smart Investing & Trading Score: 52 | |
| Day Percent Change: 1.23% Day Change: 0.21 | |
| Week Change: 1.65% Year-to-date Change: -15.8% | |
| VREX Links: Profile News Message Board | |
| Charts:- Daily , Weekly | |
| Add VREX to Watchlist: View: Get Complete VREX Trend Analysis ➞ | |
 | QTRX Quanterix Corporation |
| Sector: Health Care | |
| SubSector: Biotechnology | |
| MarketCap: 448.685 Millions | |
| Recent Price: 16.10 Smart Investing & Trading Score: 32 | |
| Day Percent Change: -1.23% Day Change: -0.20 | |
| Week Change: 1.64% Year-to-date Change: -41.1% | |
| QTRX Links: Profile News Message Board | |
| Charts:- Daily , Weekly | |
| Add QTRX to Watchlist: View: Get Complete QTRX Trend Analysis ➞ | |
 | OPK OPKO Health, Inc. |
| Sector: Health Care | |
| SubSector: Biotechnology | |
| MarketCap: 1116.05 Millions | |
| Recent Price: 1.25 Smart Investing & Trading Score: 85 | |
| Day Percent Change: 1.63% Day Change: 0.02 | |
| Week Change: 1.63% Year-to-date Change: -17.2% | |
| OPK Links: Profile News Message Board | |
| Charts:- Daily , Weekly | |
| Add OPK to Watchlist: View: Get Complete OPK Trend Analysis ➞ | |
 | SRDX Surmodics, Inc. |
| Sector: Health Care | |
| SubSector: Diagnostic Substances | |
| MarketCap: 388.171 Millions | |
| Recent Price: 26.92 Smart Investing & Trading Score: 50 | |
| Day Percent Change: 6.03% Day Change: 1.53 | |
| Week Change: 1.62% Year-to-date Change: -25.9% | |
| SRDX Links: Profile News Message Board | |
| Charts:- Daily , Weekly | |
| Add SRDX to Watchlist: View: Get Complete SRDX Trend Analysis ➞ | |
 | MASI Masimo Corporation |
| Sector: Health Care | |
| SubSector: Medical Instruments & Supplies | |
| MarketCap: 8493.2 Millions | |
| Recent Price: 136.95 Smart Investing & Trading Score: 68 | |
| Day Percent Change: 1.96% Day Change: 2.63 | |
| Week Change: 1.62% Year-to-date Change: 16.8% | |
| MASI Links: Profile News Message Board | |
| Charts:- Daily , Weekly | |
| Add MASI to Watchlist: View: Get Complete MASI Trend Analysis ➞ | |
 | BHVN Biohaven Pharmaceutical Holding Company Ltd. |
| Sector: Health Care | |
| SubSector: Biotechnology | |
| MarketCap: 2024.25 Millions | |
| Recent Price: 39.61 Smart Investing & Trading Score: 17 | |
| Day Percent Change: 3.34% Day Change: 1.28 | |
| Week Change: 1.59% Year-to-date Change: -7.5% | |
| BHVN Links: Profile News Message Board | |
| Charts:- Daily , Weekly | |
| Add BHVN to Watchlist: View: Get Complete BHVN Trend Analysis ➞ | |
 | OLK Olink Holding AB (publ) |
| Sector: Health Care | |
| SubSector: Diagnostics & Research | |
| MarketCap: 2370 Millions | |
| Recent Price: 22.21 Smart Investing & Trading Score: 35 | |
| Day Percent Change: 0.82% Day Change: 0.18 | |
| Week Change: 1.55% Year-to-date Change: -11.8% | |
| OLK Links: Profile News Message Board | |
| Charts:- Daily , Weekly | |
| Add OLK to Watchlist: View: Get Complete OLK Trend Analysis ➞ | |
 | LMAT LeMaitre Vascular, Inc. |
| Sector: Health Care | |
| SubSector: Medical Instruments & Supplies | |
| MarketCap: 522.16 Millions | |
| Recent Price: 64.23 Smart Investing & Trading Score: 66 | |
| Day Percent Change: 2.33% Day Change: 1.46 | |
| Week Change: 1.53% Year-to-date Change: 13.2% | |
| LMAT Links: Profile News Message Board | |
| Charts:- Daily , Weekly | |
| Add LMAT to Watchlist: View: Get Complete LMAT Trend Analysis ➞ | |
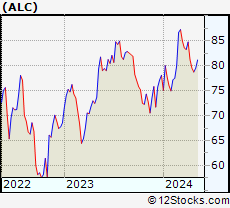 | ALC Alcon, Inc. |
| Sector: Health Care | |
| SubSector: Medical Instruments & Supplies | |
| MarketCap: 20968.1 Millions | |
| Recent Price: 80.76 Smart Investing & Trading Score: 58 | |
| Day Percent Change: 0.19% Day Change: 0.15 | |
| Week Change: 1.52% Year-to-date Change: 3.4% | |
| ALC Links: Profile News Message Board | |
| Charts:- Daily , Weekly | |
| Add ALC to Watchlist: View: Get Complete ALC Trend Analysis ➞ | |
 | PRQR ProQR Therapeutics N.V. |
| Sector: Health Care | |
| SubSector: Biotechnology | |
| MarketCap: 324.385 Millions | |
| Recent Price: 2.02 Smart Investing & Trading Score: 39 | |
| Day Percent Change: 0.25% Day Change: 0.00 | |
| Week Change: 1.51% Year-to-date Change: 2.0% | |
| PRQR Links: Profile News Message Board | |
| Charts:- Daily , Weekly | |
| Add PRQR to Watchlist: View: Get Complete PRQR Trend Analysis ➞ | |
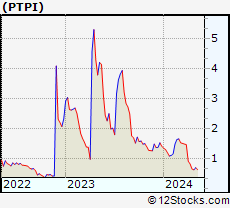 | PTPI Petros Pharmaceuticals, Inc. |
| Sector: Health Care | |
| SubSector: Biotechnology | |
| MarketCap: 21487 Millions | |
| Recent Price: 0.68 Smart Investing & Trading Score: 10 | |
| Day Percent Change: 1.84% Day Change: 0.01 | |
| Week Change: 1.48% Year-to-date Change: -52.3% | |
| PTPI Links: Profile News Message Board | |
| Charts:- Daily , Weekly | |
| Add PTPI to Watchlist: View: Get Complete PTPI Trend Analysis ➞ | |
 | INVA Innoviva, Inc. |
| Sector: Health Care | |
| SubSector: Biotechnology | |
| MarketCap: 1023.15 Millions | |
| Recent Price: 15.17 Smart Investing & Trading Score: 64 | |
| Day Percent Change: 1.61% Day Change: 0.24 | |
| Week Change: 1.47% Year-to-date Change: -5.4% | |
| INVA Links: Profile News Message Board | |
| Charts:- Daily , Weekly | |
| Add INVA to Watchlist: View: Get Complete INVA Trend Analysis ➞ | |
 | PEN Penumbra, Inc. |
| Sector: Health Care | |
| SubSector: Medical Instruments & Supplies | |
| MarketCap: 4854.1 Millions | |
| Recent Price: 205.70 Smart Investing & Trading Score: 32 | |
| Day Percent Change: 1.33% Day Change: 2.70 | |
| Week Change: 1.47% Year-to-date Change: -18.2% | |
| PEN Links: Profile News Message Board | |
| Charts:- Daily , Weekly | |
| Add PEN to Watchlist: View: Get Complete PEN Trend Analysis ➞ | |
 | FLGT Fulgent Genetics, Inc. |
| Sector: Health Care | |
| SubSector: Medical Laboratories & Research | |
| MarketCap: 222.2 Millions | |
| Recent Price: 20.64 Smart Investing & Trading Score: 59 | |
| Day Percent Change: 0.39% Day Change: 0.08 | |
| Week Change: 1.47% Year-to-date Change: -28.6% | |
| FLGT Links: Profile News Message Board | |
| Charts:- Daily , Weekly | |
| Add FLGT to Watchlist: View: Get Complete FLGT Trend Analysis ➞ | |
 | CCCC C4 Therapeutics, Inc. |
| Sector: Health Care | |
| SubSector: Biotechnology | |
| MarketCap: 12587 Millions | |
| Recent Price: 6.90 Smart Investing & Trading Score: 56 | |
| Day Percent Change: 0.58% Day Change: 0.04 | |
| Week Change: 1.47% Year-to-date Change: 22.3% | |
| CCCC Links: Profile News Message Board | |
| Charts:- Daily , Weekly | |
| Add CCCC to Watchlist: View: Get Complete CCCC Trend Analysis ➞ | |
 | BLCO Bausch + Lomb Corporation |
| Sector: Health Care | |
| SubSector: Medical Instruments & Supplies | |
| MarketCap: 7100 Millions | |
| Recent Price: 14.85 Smart Investing & Trading Score: 65 | |
| Day Percent Change: 1.43% Day Change: 0.21 | |
| Week Change: 1.43% Year-to-date Change: -12.7% | |
| BLCO Links: Profile News Message Board | |
| Charts:- Daily , Weekly | |
| Add BLCO to Watchlist: View: Get Complete BLCO Trend Analysis ➞ | |
 | OLMA Olema Pharmaceuticals, Inc. |
| Sector: Health Care | |
| SubSector: Biotechnology | |
| MarketCap: 17687 Millions | |
| Recent Price: 10.00 Smart Investing & Trading Score: 42 | |
| Day Percent Change: 1.32% Day Change: 0.13 | |
| Week Change: 1.42% Year-to-date Change: -28.9% | |
| OLMA Links: Profile News Message Board | |
| Charts:- Daily , Weekly | |
| Add OLMA to Watchlist: View: Get Complete OLMA Trend Analysis ➞ | |
 | USNA USANA Health Sciences, Inc. |
| Sector: Health Care | |
| SubSector: Drug Related Products | |
| MarketCap: 1185.13 Millions | |
| Recent Price: 44.75 Smart Investing & Trading Score: 59 | |
| Day Percent Change: 1.18% Day Change: 0.52 | |
| Week Change: 1.4% Year-to-date Change: -16.5% | |
| USNA Links: Profile News Message Board | |
| Charts:- Daily , Weekly | |
| Add USNA to Watchlist: View: Get Complete USNA Trend Analysis ➞ | |
| For tabular summary view of above stock list: Summary View ➞ 0 - 25 , 25 - 50 , 50 - 75 , 75 - 100 , 100 - 125 , 125 - 150 , 150 - 175 , 175 - 200 , 200 - 225 , 225 - 250 , 250 - 275 , 275 - 300 , 300 - 325 , 325 - 350 , 350 - 375 , 375 - 400 , 400 - 425 , 425 - 450 , 450 - 475 , 475 - 500 , 500 - 525 , 525 - 550 , 550 - 575 , 575 - 600 , 600 - 625 , 625 - 650 , 650 - 675 , 675 - 700 , 700 - 725 | ||
| Click To Change The Sort Order: By Market Cap or Company Size Performance: Year-to-date, Week and Day | |
| Select Chart Type: | ||
|
Best Stocks Today 12Stocks.com |
© 2024 12Stocks.com Terms & Conditions Privacy Contact Us
All Information Provided Only For Education And Not To Be Used For Investing or Trading. See Terms & Conditions


One More Thing ... Get Best Stocks Delivered Daily!
Never Ever Miss A Move With Our Top Ten Stocks Lists
Find Best Stocks In Any Market - Bull or Bear Market
Take A Peek At Our Top Ten Stocks Lists: Daily, Weekly, Year-to-Date & Top Trends
Find Best Stocks In Any Market - Bull or Bear Market
Take A Peek At Our Top Ten Stocks Lists: Daily, Weekly, Year-to-Date & Top Trends
Healthcare Stocks With Best Up Trends [0-bearish to 100-bullish]: Pieris [100], PureTech Health[100], Day One[100], Hutchison China[100], Oscar Health[100], Agios [100], Quest Diagnostics[100], Brookdale Senior[100], Avadel [100], Fresenius [100], PMV [100]
Best Healthcare Stocks Year-to-Date:
Pieris [6493.41%], Precision BioSciences[2702.74%], Inovio [1933.33%], Assembly Biosciences[1518.1%], Aurora Cannabis[1458.17%], Adverum Biotechnologies[1361.21%], NuCana [1252.27%], Affimed N.V[756%], Agenus [680.29%], CareMax [650.52%], Corbus [524.83%] Best Healthcare Stocks This Week:
Pieris [8175.86%], CareMax [41.63%], VolitionRx [37.99%], Seres [35.74%], BeyondSpring [27.22%], GeneDx [24.95%], ProKidney [24.75%], Agenus [21.66%], MSP Recovery[19.2%], Annovis Bio[18.8%], Generation Bio[17.69%] Best Healthcare Stocks Daily:
Pieris [8113.55%], VolitionRx [41.10%], Seres [21.68%], Aurora Cannabis[18.15%], Generation Bio[16.01%], Concord [15.93%], GeneDx [15.93%], Canopy Growth[15.03%], ChromaDex [14.86%], IGM Biosciences[14.07%], CareMax [13.40%]