12Stocks.com
Market
Intelligence

Stock Charts, Performance & Trend Analysis for RXD
ProShares UltraShort HealthCare

RXD
Year-to-Date: -16.2%
This Week: -2.5%
RXD Stock Charts
See Daily ➞
See Weekly ➞
See Monthly ➞

RXD
Year-to-Date (YTD) Return: -16.15%
 
All about FANG Stocks ➞
Popular Trends!AAPL ➞ MSFT ➞ TSLA ➞
S&P 500 ➞ AMZN ➞ GOOGL ➞ FB ➞
Long Term Trend: Not Good
Medium Term Trend: Not Good
Short Term Trend: Not Good
Short
Overall Trend Score:
0 Out Of 100
Bottomline: Bearish Trend


Get YOUR Stock Review:

July 27, 2024 - The year-to-date (YTD) performance of Short HealthCare (RXD) ETF is down -16.15% and is underperforming the overall stock market by -29.84%.

Recently, the weekly returns of Short HealthCare (RXD) is down -2.51% and is underperforming the overall market by -2%.

New! 12Stocks.com introduces Big Monthly, Weekly & Daily Charts
View RXD Stock Charts      Daily    Weekly    Monthly

All the three primary trends (long term, mid-term and short term) for ProShares UltraShort HealthCare are faltering.

The overall 12Stocks.com Smart Investing & Trading Score is 0 (measures stock trend from 0-bearish to 100-bullish) which puts RXD in short term bearish trend.

The Smart Investing & Trading Score from previous trading session is 18 and hence a deterioration of trend. Scroll down for key technical charts, support & resistance levels and analysis for Short.

Stock Analysis for RXD
Name: ProShares UltraShort HealthCare
Sector:
SubSector:
In A Glance
RXD Technical Trend Chart View

Daily RXD Technical Chart
Add RXD To Watch List   View List
12Stocks.com
Short Term Trend Analysis for
0 / 100
The current technical trend score is 0 in a scale where 0 is bearish and 100 is bullish.
The technical trend score from previous session is 18.
Trend score updated daily. Not to be used for investing.
Recent Price: 10.00    
MarketCap: Millions
Day Percent Change: -0.95%
Day Change: -0.10
Week Change: -2.51%
Year-to-date Change: -16.15%

Technical Levels: For the trading inclined, the following are the key levels of resistance (ceiling) and support (floor) for RXD. Ceiling and floor levels are stock prices at which the stock trend gets resistance or support respectively and traders have an eye on them. Long term levels are more important. Stocks that have broken thru their resistance or supports convincingly tend to have stronger trends (confirm with charts above visually).
Key Levels for RXD
 Short TermWeeklyLong Term
Resistance (Ceiling)10.1110.3511
Support (Floor)9.89.8210.33

The table below shows stocks similar to ProShares UltraShort HealthCare , i.e, from same subsector or sector along with year-to-date (YTD), weekly & daily performaces for comparison. Usually, stocks from similar sector tend to move together but companies that have innovative products, services or good management tend to outperform. Quick View: Move mouse or cursor over stock symbol (ticker) to view short-term technical chart and over stock name to view long term chart. Click on ticker or stock name for detailed view. Click on to add stock symbol to your watchlist and to view watchlist.
TickerStock NameWatchlistCategoryRecent PriceChange %Weekly Change%YTD Change%
JNJJohnson & Johnson Drugs160.640.633.852.49%
UNHUnitedHealth Group Incorporated Insurance569.721.790.788.22%
NVSNovartis AG Drugs110.320.353.959.26%
MRKMerck & Co., Inc. Drugs125.26-0.47-0.4114.9%
PFEPfizer Inc. Drugs30.771.952.676.88%
LLYEli Lilly and Company Drugs804.62-2.02-6.1638.03%
ABTAbbott Laboratories Instrument105.24-0.683.15-4.39%
AMGNAmgen Inc. Biotechnology334.850.161.0716.26%
BMYBristol-Myers Squibb Company Drugs50.4511.4418.32-1.68%
MDTMedtronic plc Instrument78.700.31-0.98-4.47%
AZNAstraZeneca PLC Drugs78.13-0.50-0.7416.01%
TMOThermo Fisher Scientific Inc. Health Services607.142.1313.6214.38%
ABBVAbbVie Inc. Drugs185.161.647.4519.48%
SNYSanofi Drugs52.40-1.323.525.37%
NVONovo Nordisk A/S Biotechnology126.73-0.88-3.6622.5%
GILDGilead Sciences, Inc. Biotechnology77.010.656.13-4.94%
PLRXPliant Therapeutics, Inc. Biotechnology13.320.157.77-26.49%
ANNXAnnexon, Inc. Biotechnology6.251.3011.0137.06%
ATHAAthira Pharma, Inc. Biotechnology3.31-0.456.4335.66%
LNSRLENSAR, Inc. Healthcare5.211.46648.58%
GSKGlaxoSmithKline plc Drugs39.862.021.37.56%
DYNDyne Therapeutics, Inc. Biotechnology44.534.297.38234.81%
GLSIGreenwich LifeSciences, Inc. Biotechnology16.07-3.028.3651.6%
CALTCalliditas Therapeutics AB (publ) Healthcare38.15-0.27-1.6548.62%
CVSCVS Health Corporation Insurance61.004.012.4-22.75%
You can find complete coverage in the following
Related Pages: 2024 Best Performing Stocks, 2024 Best Performing ETF Funds

Technical Levels: For the trading inclined, the following are the key levels of resistance (ceiling) and support (floor) for RXD. Ceiling and floor levels are stock prices at which the stock trend gets resistance or support respectively. Stocks & their trends tend to pause at these levels and hence traders have an eye on them.

Long term levels are more important. Stocks that have broken thru their resistance or support levels convincingly tend to have stronger trends (confirm with charts above visually).
Key Technical Levels for RXD
 Short TermWeeklyLong Term
Resistance (Ceiling)10.1110.3511
Support (Floor)9.89.8210.33

        
RELATIVE PERFORMANCE OF
ProShares UltraShort HealthCare
Vs
THE MARKET
Relative performance of ProShares UltraShort HealthCare
How is RXD faring versus the market [S&P 500] ? Is it lagging or leading ? How is its relative performance ?
Symbol Day Change Week Change Year-to-Date Change
VTI 1.20% -0.51% 13.69%
RXD -0.95% -2.51% -16.15%

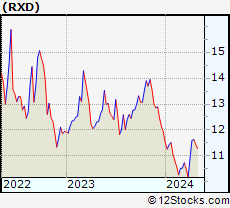
RXD Daily Chart

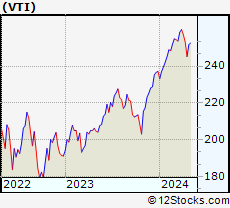
Total Market Daily Chart
Year to date returns RXD is underperforming the market by -29.84%
This week, RXD is underperforming the market by -2%


List Of ETF Funds Similar To ProShares UltraShort HealthCare

The table below shows ETFs (Exchange Traded Funds) similar to ProShares UltraShort HealthCare , i.e, from same sector along with year-to-date (YTD), weekly & daily performaces for comparison. Usually, ETFs and associated stocks from similar sector tend to move together but companies that have innovative products, services or good management tend to outperform. Move mouse or cursor over ETF symbol to view short-term technical chart and over ETF name to view long term chart. Click on to add ETF symbol to your watchlist and to view watchlist.
TickerStock NameWatchlistCategoryRecent PriceChange %Weekly Change%YTD Change%
SRTYProShares Triple Short Russel 2000 General20.22-5.16-10.05-33.09%
TWMProShares UltraShort Russell 2000  General9.15-3.17-6.73-21.46%
SMDDProShares Triple Short Midcap General9.82-3.85-5.62-27.08%
MZZProShares Double Short MidCap400 General10.38-2.41-3.71-17.43%
DXDProShares Double Short Dow30 Value29.89-3.21-1.42-11.93%
QIDProShares Double Short QQQ Technology41.06-1.895.15-22.6%
SQQQProShares Triple Short Nasdaq 100 General9.10-2.887.57-32.34%
SDOWProShares Triple Short Dow 30 General14.97-4.65-2.16-18.6%
SPXUProShares Triple Short S&P 500 General29.02-3.172.51-32.51%
SDSProShares Double Short S&P 500 General23.21-2.071.75-22.43%
FXPUltraShort FTSE/Xinhua China 25 Pacific31.95-0.782.3-18.43%
EDZTripleShort Emerging Markets Emerging Markets9.48-2.873.04-13.5%
EEVUltraShort MSCI Emerging Markets Emerging Markets17.93-1.282.07-9.11%
EFUUltraShort MSCI EAFE  Developed Markets7.47-1.250.61-11.69%
TBTUltraShort 20+ Year Bond Government33.58-1.520.0311.19%
PPHPharmaceutical HOLDRs Health Care93.280.701.514.64%
RXLProShares Ultra HealthCare  Health Care106.600.182.516.63%
BBHBiotech HOLDRs Health Care179.060.531.888.32%
XLVHealth Care SPDR Health Care149.960.561.419.96%
IHFiShares U. S. Healthcare Providers Health Care56.202.114.447.03%
IXJiShares Global Healthcare  Health Care95.580.671.410.22%
IBBiShares Nasdaq Biotechnology Health Care148.260.842.949.14%
IYHiShares US Healthcare Health Care63.030.591.4210.1%
PBEPowerShares Biotech  Health Care70.841.063.587.6%
XBISPDR Biotech Health Care101.540.554.1313.72%
PJPPowerShares Pharmaceuticals Health Care86.020.652.313.04%
VHTVanguard Health Care VIPERS Health Care275.430.691.679.86%
IHIiShares U.S. Medical Devices Health Care54.39-1.47-3.580.78%
FBTFT Biotech Index Fund Health Care165.790.483.494.89%
IHEiShares U.S. Pharmaceuticals Health Care69.150.761.911.89%
Get the most comprehensive stock market coverage daily at 12Stocks.com ➞
Best Stocks Today ➞
Best Stocks Weekly ➞
Best Stocks Year-to-Date ➞
Best Stocks Trends ➞


Best Stocks Today
12Stocks.com


Best Nasdaq Stocks ➞
Best S&P 500 Stocks ➞
Best Tech Stocks ➞
Best Biotech Stocks ➞
 

© 2024 12Stocks.com       Terms & Conditions   Privacy   Contact Us
All Information Provided Only For Education And Not To Be Used For Investing or Trading. See Terms & Conditions

 WatchListmy12Stocks
Best Stocks Today