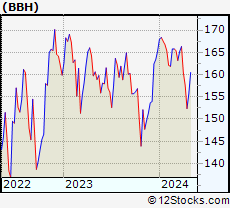
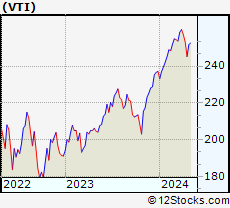
The Smart Investing & Trading Score from previous trading session is 42 and hence a minor deterioration of trend. Scroll down for key technical charts, support & resistance levels and analysis for Biotech.
The current technical trend score is 35 in a scale where 0 is bearish and 100 is bullish.
The technical trend score from previous session is 42.
Trend score updated daily. Not to be used for investing.
Recent Price: 152.17
MarketCap: Millions
Day Percent Change: 0.34%
Day Change: 0.51
Week Change: -2.03%
Year-to-date Change: -3.06%
Technical Levels: For the trading inclined, the following are the key levels of resistance (ceiling) and support (floor) for BBH. Ceiling and floor levels are stock prices at which the stock trend gets resistance or support respectively and traders have an eye on them. Long term levels are more important. Stocks that have broken thru their resistance or supports convincingly tend to have stronger trends (confirm with charts above visually).
Key Levels for BBH
Short Term
Weekly
Long Term
Resistance (Ceiling)
154.25
156.36
152.93
Support (Floor)
151.66
151.64
139.92
The table below shows stocks similar to Biotech HOLDRs, i.e, from same subsector or sector along with year-to-date (YTD), weekly & daily performaces for comparison. Usually, stocks from similar sector tend to move together but companies that have innovative products, services or good management tend to outperform. Quick View: Move mouse or cursor over stock symbol (ticker) to view short-term technical chart and over stock name to view long term chart. Click on ticker or stock name for detailed view. Click on to add stock symbol to your watchlist and to view watchlist.
Technical Levels: For the trading inclined, the following are the key levels of resistance (ceiling) and support (floor) for BBH. Ceiling and floor levels are stock prices at which the stock trend gets resistance or support respectively. Stocks & their trends tend to pause at these levels and hence traders have an eye on them.
Long term levels are more important. Stocks that have broken thru their resistance or support levels convincingly tend to have stronger trends (confirm with charts above visually).
Key Technical Levels for BBH
Short Term
Weekly
Long Term
Resistance (Ceiling)
154.25
156.36
152.93
Support (Floor)
151.66
151.64
139.92
RELATIVE PERFORMANCE OF Biotech HOLDRs Vs THE MARKET
Relative performance of Biotech HOLDRs
How is BBH faring versus the market [S&P 500] ? Is it lagging or leading ? How is its relative performance ?
Symbol
Day Change
Week Change
Year-to-Date Change
VTI
0.04%
0.18%
1.84%
BBH
0.34%
-2.03%
-3.06%
BBH Daily Chart
Total Market Daily Chart
Year to date returns BBH is underperforming the market by -4.9%
This week, BBH is underperforming the market by -2.21%
List Of ETF Funds Similar To Biotech HOLDRs
The table below shows ETFs (Exchange Traded Funds) similar to Biotech HOLDRs, i.e, from same sector along with year-to-date (YTD), weekly & daily performaces for comparison. Usually, ETFs and associated stocks from similar sector tend to move together but companies that have innovative products, services or good management tend to outperform. Move mouse or cursor over ETF symbol to view short-term technical chart and over ETF name to view long term chart. Click on to add ETF symbol to your watchlist and to view watchlist.
Dow Stocks With Best Current Trends [0-bearish to 100-bullish]: Goldman Sachs[100], Chase[100], Cisco Systems[100], Microsoft [95], IBM [90], American Express[83], Caterpillar [83], Amazon.com [76], Intel [74], S&P[71] Best S&P 500 Stocks Year-to-Date Update: NRG Energy[69.92%], Newmont [57.46%], Seagate [53.37%], Philip Morris[53.07%], CVS Health[52.34%], Dollar General[50.25%], Mosaic [49.61%], Micron [44.94%], Jabil [42.29%], General Electric[41.69%] Best Nasdaq 100 Stocks Weekly Update: Marvell [11.55%], Advanced Micro[9.15%], Datadog [7.96%], Intel [6.7%], Micron [5.38%], Illumina [3.83%], Take-Two Interactive[3.59%], Microchip [3.48%], Constellation Energy[3.21%], Lam Research[3.04%] Today's Stock Market In A Nutshell:US Small Cap [0.5%], US Mid Cap [0.4%], US Dollar [0.2%], Bonds [0.1%], Emerging Markets [-0%], US Large Cap [-0%], Oil [-0%], Euro [-0.1%], Gold [-0.5%], China [-1.4%],