
 Login Sign Up


| |||||
 |  | ||||

| 12Stocks.com Market Intelligence |
Best Healthcare Stocks
 | "Discover best trending healthcare stocks with 12Stocks.com." |
| - Subu Vdaygiri, Founder, 12Stocks.com |
| In a hurry? Healthcare Stocks Lists: Performance Trends Table, Stock Charts
Sort Healthcare stocks: Daily, Weekly, Year-to-Date, Market Cap & Trends. Filter Healthcare stocks list by size:All Healthcare Large Mid-Range Small |
| 12Stocks.com Healthcare Stocks Performances & Trends Daily | |||||||||
|
|  The overall Smart Investing & Trading Score is 18 (0-bearish to 100-bullish) which puts Healthcare sector in short term bearish trend. The Smart Investing & Trading Score from previous trading session is 10 and an improvement of trend continues.
| ||||||||
Here are the Smart Investing & Trading Scores of the most requested Healthcare stocks at 12Stocks.com (click stock name for detailed review):
|


| 12Stocks.com: Investing in Healthcare sector with Stocks | |
|
The following table helps investors and traders sort through current performance and trends (as measured by Smart Investing & Trading Score) of various
stocks in the Healthcare sector. Quick View: Move mouse or cursor over stock symbol (ticker) to view short-term Technical chart and over stock name to view long term chart. Click on  to add stock symbol to your watchlist and to add stock symbol to your watchlist and  to view watchlist. Click on any ticker or stock name for detailed market intelligence report for that stock. to view watchlist. Click on any ticker or stock name for detailed market intelligence report for that stock. |
12Stocks.com Performance of Stocks in Healthcare Sector
| Ticker | Stock Name | Watchlist | Category | Recent Price | Smart Investing & Trading Score | Change % | Weekly Change% |
| FOLD | Amicus |   | Biotechnology | 10.35 | 0 | -1.90% | -7.75% |
| CLLS | Cellectis S.A | | Biotechnology | 2.48 | 0 | 0.81% | -7.81% |
| SDGR | Schrodinger | | Health Information | 24.37 | 0 | -2.68% | -7.86% |
| UHS | Universal Health | | Hospitals | 153.65 | 0 | -3.99% | -7.88% |
| VCEL | Vericel | | Biotechnology | 44.09 | 31 | -4.69% | -7.95% |
| MNOV | MediciNova | | Biotechnology | 1.45 | 54 | 1.05% | -7.96% |
| RLMD | Relmada | | Biotechnology | 4.28 | 61 | -8.55% | -7.96% |
| RVNC | Revance | | Biotechnology | 3.80 | 20 | 1.06% | -7.99% |
| HCA | HCA | | Hospitals | 297.00 | 0 | -4.51% | -8.00% |
| AMRN | Amarin | | Biotechnology | 0.88 | 5 | -4.06% | -8.06% |
| TNDM | Tandem Diabetes | | Instruments | 30.80 | 44 | -2.99% | -8.06% |
| CVRX | CVRx | | Medical Devices | 15.83 | 17 | 0.51% | -8.13% |
| APLT | Applied | | Biotechnology | 4.74 | 36 | -1.86% | -8.14% |
| VXRT | Vaxart | | Biotechnology | 0.84 | 15 | -3.48% | -8.14% |
| LTRN | Lantern Pharma | | Biotechnology | 5.87 | 36 | -2.17% | -8.14% |
| ILMN | Illumina | | Biotechnology | 116.64 | 10 | -1.39% | -8.21% |
| TRVI | Trevi | | Biotechnology | 2.68 | 48 | 3.88% | -8.22% |
| SNDL | Sundial Growers | | Pharmaceutical | 1.84 | 41 | 0.27% | -8.25% |
| APLS | Apellis | | Biotechnology | 47.51 | 10 | -1.08% | -8.26% |
| MGNX | MacroGenics | | Biotechnology | 16.08 | 46 | -0.12% | -8.32% |
| SCPH | sc | | Biotechnology | 4.52 | 0 | 2.26% | -8.32% |
| GLYC | GlycoMimetics | | Biotechnology | 2.19 | 10 | -6.41% | -8.37% |
| CERT | Certara | | Biotechnology | 16.19 | 36 | -4.51% | -8.38% |
| HCM | Hutchison China | | Pharmaceutical | 16.38 | 41 | -0.43% | -8.39% |
| RGEN | Repligen | | Biotechnology | 157.12 | 0 | -2.40% | -8.40% |
| For chart view version of above stock list: Chart View ➞ 0 - 25 , 25 - 50 , 50 - 75 , 75 - 100 , 100 - 125 , 125 - 150 , 150 - 175 , 175 - 200 , 200 - 225 , 225 - 250 , 250 - 275 , 275 - 300 , 300 - 325 , 325 - 350 , 350 - 375 , 375 - 400 , 400 - 425 , 425 - 450 , 450 - 475 , 475 - 500 , 500 - 525 , 525 - 550 , 550 - 575 , 575 - 600 , 600 - 625 , 625 - 650 , 650 - 675 , 675 - 700 , 700 - 725 | ||
 | Click To Change The Sort Order: By Market Cap or Company Size Performance: Year-to-date, Week and Day |  |
|
Get the most comprehensive stock market coverage daily at 12Stocks.com ➞ Best Stocks Today ➞ Best Stocks Weekly ➞ Best Stocks Year-to-Date ➞ Best Stocks Trends ➞  Best Stocks Today 12Stocks.com Best Nasdaq Stocks ➞ Best S&P 500 Stocks ➞ Best Tech Stocks ➞ Best Biotech Stocks ➞ |
| Detailed Overview of Healthcare Stocks |
| Healthcare Technical Overview, Leaders & Laggards, Top Healthcare ETF Funds & Detailed Healthcare Stocks List, Charts, Trends & More |
| Healthcare Sector: Technical Analysis, Trends & YTD Performance | |
| Healthcare sector is composed of stocks
from pharmaceutical, biotech, diagnostics labs, insurance providers
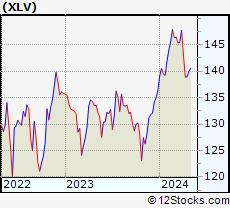
and healthcare services. Healthcare sector, as represented by XLV, an exchange-traded fund [ETF] that holds basket of Healthcare stocks (e.g, Merck, Amgen) is up by 1.5% and is currently underperforming the overall market by -2.69% year-to-date. Below is a quick view of Technical charts and trends: |
|
 XLV Weekly Chart |
|
| Long Term Trend: Not Good | |
| Medium Term Trend: Not Good | |
 XLV Daily Chart |
|
| Short Term Trend: Deteriorating | |
| Overall Trend Score: 18 | |
| YTD Performance: 1.5% | |
| **Trend Scores & Views Are Only For Educational Purposes And Not For Investing | |
| 12Stocks.com: Top Performing Healthcare Sector Stocks | ||||||||||||||||||||||||||||||||||||||||||||||||
 The top performing Healthcare sector stocks year to date are
Now, more recently, over last week, the top performing Healthcare sector stocks on the move are


|
||||||||||||||||||||||||||||||||||||||||||||||||
| 12Stocks.com: Investing in Healthcare Sector using Exchange Traded Funds | |
|
The following table shows list of key exchange traded funds (ETF) that
help investors track Healthcare Index. For detailed view, check out our ETF Funds section of our website. Quick View: Move mouse or cursor over ETF symbol (ticker) to view short-term Technical chart and over ETF name to view long term chart. Click on ticker or stock name for detailed view. Click on to add stock symbol to your watchlist and to view watchlist. |
12Stocks.com List of ETFs that track Healthcare Index
| Ticker | ETF Name | Watchlist | Recent Price | Smart Investing & Trading Score | Change % | Week % | Year-to-date % |
| XLV | Health Care | | 138.43 | 18 | -0.01 | -0.35 | 1.5% |
| XBI | Biotech | | 83.48 | 10 | -1.38 | -5.3 | -6.51% |
| IBB | Biotechnology | | 124.65 | 0 | -0.98 | -3.8 | -8.24% |
| BBH | Biotech | | 152.32 | 10 | -0.45 | -3.34 | -7.86% |
| VHT | Health Care | | 252.83 | 18 | -0.12 | -0.76 | 0.85% |
| IYH | Healthcare | | 58.05 | 10 | -0.02 | -0.6 | 1.4% |
| IHF | Healthcare Providers | | 51.53 | 45 | 0.90 | 1.96 | -1.87% |
| IHI | Medical Devices | | 54.53 | 5 | -0.46 | -2.8 | 1.04% |
| BIB | Biotechnology | | 48.23 | 0 | -1.44 | -6.16 | -15.47% |
| BIS | Short Biotech | | 20.57 | 95 | 0.24 | 4.95 | 13.84% |
| XHE | Health Care Equipment | | 82.31 | 20 | 0.32 | -1.89 | -2.32% |
| CURE | Healthcare Bull 3X | | 102.23 | 18 | -0.42 | -1.12 | 0.48% |
| LABU | Biotech Bull 3X | | 88.04 | 10 | -4.33 | -15.63 | -27.82% |
| LABD | Biotech Bear 3X | | 10.52 | 82 | 4.37 | 17.15 | 8.57% |
| PSCH | SmallCap Health Care | | 40.42 | 28 | -0.03 | -2.44 | -5.56% |
| XHS | Health Care Services | | 86.19 | 23 | -0.16 | -2.07 | -3.1% |
| PTH | DWA Healthcare Momentum | | 40.51 | 46 | 0.15 | -3.16 | 3.5% |
| BTEC | Principal Healthcare Innovators | | 34.41 | 10 | -0.58 | -4.39 | -5.28% |
| RXL | Health Care | | 92.44 | 10 | -0.61 | -0.88 | 1.13% |
| RXD | Short Health Care | | 11.67 | 68 | -0.05 | 0.64 | -2.11% |
| 12Stocks.com: Charts, Trends, Fundamental Data and Performances of Healthcare Stocks | |
|
We now take in-depth look at all Healthcare stocks including charts, multi-period performances and overall trends (as measured by Smart Investing & Trading Score). One can sort Healthcare stocks (click link to choose) by Daily, Weekly and by Year-to-Date performances. Also, one can sort by size of the company or by market capitalization. |
| Select Your Default Chart Type: | |||||
| |||||
| Click on stock symbol or name for detailed view. Click on to add stock symbol to your watchlist and to view watchlist. Quick View: Move mouse or cursor over "Daily" to quickly view daily Technical stock chart and over "Weekly" to view weekly Technical stock chart. | |||||

 | FOLD Amicus Therapeutics, Inc. |
| Sector: Health Care | |
| SubSector: Biotechnology | |
| MarketCap: 2676.75 Millions | |
| Recent Price: 10.35 Smart Investing & Trading Score: 0 | |
| Day Percent Change: -1.90% Day Change: -0.20 | |
| Week Change: -7.75% Year-to-date Change: -27.1% | |
| FOLD Links: Profile News Message Board | |
| Charts:- Daily , Weekly | |
| Add FOLD to Watchlist: View: Get Complete FOLD Trend Analysis ➞ | |
 | CLLS Cellectis S.A. |
| Sector: Health Care | |
| SubSector: Biotechnology | |
| MarketCap: 398.685 Millions | |
| Recent Price: 2.48 Smart Investing & Trading Score: 0 | |
| Day Percent Change: 0.81% Day Change: 0.02 | |
| Week Change: -7.81% Year-to-date Change: -19.5% | |
| CLLS Links: Profile News Message Board | |
| Charts:- Daily , Weekly | |
| Add CLLS to Watchlist: View: Get Complete CLLS Trend Analysis ➞ | |
 | SDGR Schrodinger, Inc. |
| Sector: Health Care | |
| SubSector: Health Information Services | |
| MarketCap: 47287 Millions | |
| Recent Price: 24.37 Smart Investing & Trading Score: 0 | |
| Day Percent Change: -2.68% Day Change: -0.67 | |
| Week Change: -7.86% Year-to-date Change: -31.9% | |
| SDGR Links: Profile News Message Board | |
| Charts:- Daily , Weekly | |
| Add SDGR to Watchlist: View: Get Complete SDGR Trend Analysis ➞ | |
 | UHS Universal Health Services, Inc. |
| Sector: Health Care | |
| SubSector: Hospitals | |
| MarketCap: 7217.66 Millions | |
| Recent Price: 153.65 Smart Investing & Trading Score: 0 | |
| Day Percent Change: -3.99% Day Change: -6.38 | |
| Week Change: -7.88% Year-to-date Change: 0.8% | |
| UHS Links: Profile News Message Board | |
| Charts:- Daily , Weekly | |
| Add UHS to Watchlist: View: Get Complete UHS Trend Analysis ➞ | |
 | VCEL Vericel Corporation |
| Sector: Health Care | |
| SubSector: Biotechnology | |
| MarketCap: 391.885 Millions | |
| Recent Price: 44.09 Smart Investing & Trading Score: 31 | |
| Day Percent Change: -4.69% Day Change: -2.17 | |
| Week Change: -7.95% Year-to-date Change: 23.8% | |
| VCEL Links: Profile News Message Board | |
| Charts:- Daily , Weekly | |
| Add VCEL to Watchlist: View: Get Complete VCEL Trend Analysis ➞ | |
 | MNOV MediciNova, Inc. |
| Sector: Health Care | |
| SubSector: Biotechnology | |
| MarketCap: 137.685 Millions | |
| Recent Price: 1.45 Smart Investing & Trading Score: 54 | |
| Day Percent Change: 1.05% Day Change: 0.02 | |
| Week Change: -7.96% Year-to-date Change: -3.7% | |
| MNOV Links: Profile News Message Board | |
| Charts:- Daily , Weekly | |
| Add MNOV to Watchlist: View: Get Complete MNOV Trend Analysis ➞ | |
 | RLMD Relmada Therapeutics, Inc. |
| Sector: Health Care | |
| SubSector: Biotechnology | |
| MarketCap: 499.685 Millions | |
| Recent Price: 4.28 Smart Investing & Trading Score: 61 | |
| Day Percent Change: -8.55% Day Change: -0.40 | |
| Week Change: -7.96% Year-to-date Change: 3.4% | |
| RLMD Links: Profile News Message Board | |
| Charts:- Daily , Weekly | |
| Add RLMD to Watchlist: View: Get Complete RLMD Trend Analysis ➞ | |
 | RVNC Revance Therapeutics, Inc. |
| Sector: Health Care | |
| SubSector: Biotechnology | |
| MarketCap: 854.185 Millions | |
| Recent Price: 3.80 Smart Investing & Trading Score: 20 | |
| Day Percent Change: 1.06% Day Change: 0.04 | |
| Week Change: -7.99% Year-to-date Change: -56.8% | |
| RVNC Links: Profile News Message Board | |
| Charts:- Daily , Weekly | |
| Add RVNC to Watchlist: View: Get Complete RVNC Trend Analysis ➞ | |
 | HCA HCA Healthcare, Inc. |
| Sector: Health Care | |
| SubSector: Hospitals | |
| MarketCap: 29466.6 Millions | |
| Recent Price: 297.00 Smart Investing & Trading Score: 0 | |
| Day Percent Change: -4.51% Day Change: -14.03 | |
| Week Change: -8% Year-to-date Change: 9.7% | |
| HCA Links: Profile News Message Board | |
| Charts:- Daily , Weekly | |
| Add HCA to Watchlist: View: Get Complete HCA Trend Analysis ➞ | |
 | AMRN Amarin Corporation plc |
| Sector: Health Care | |
| SubSector: Biotechnology | |
| MarketCap: 4197.45 Millions | |
| Recent Price: 0.88 Smart Investing & Trading Score: 5 | |
| Day Percent Change: -4.06% Day Change: -0.04 | |
| Week Change: -8.06% Year-to-date Change: 1.1% | |
| AMRN Links: Profile News Message Board | |
| Charts:- Daily , Weekly | |
| Add AMRN to Watchlist: View: Get Complete AMRN Trend Analysis ➞ | |
 | TNDM Tandem Diabetes Care, Inc. |
| Sector: Health Care | |
| SubSector: Medical Instruments & Supplies | |
| MarketCap: 3359.1 Millions | |
| Recent Price: 30.80 Smart Investing & Trading Score: 44 | |
| Day Percent Change: -2.99% Day Change: -0.95 | |
| Week Change: -8.06% Year-to-date Change: 4.1% | |
| TNDM Links: Profile News Message Board | |
| Charts:- Daily , Weekly | |
| Add TNDM to Watchlist: View: Get Complete TNDM Trend Analysis ➞ | |
 | CVRX CVRx, Inc. |
| Sector: Health Care | |
| SubSector: Medical Devices | |
| MarketCap: 327 Millions | |
| Recent Price: 15.83 Smart Investing & Trading Score: 17 | |
| Day Percent Change: 0.51% Day Change: 0.08 | |
| Week Change: -8.13% Year-to-date Change: -49.7% | |
| CVRX Links: Profile News Message Board | |
| Charts:- Daily , Weekly | |
| Add CVRX to Watchlist: View: Get Complete CVRX Trend Analysis ➞ | |
 | APLT Applied Therapeutics, Inc. |
| Sector: Health Care | |
| SubSector: Biotechnology | |
| MarketCap: 641.285 Millions | |
| Recent Price: 4.74 Smart Investing & Trading Score: 36 | |
| Day Percent Change: -1.86% Day Change: -0.09 | |
| Week Change: -8.14% Year-to-date Change: 41.5% | |
| APLT Links: Profile News Message Board | |
| Charts:- Daily , Weekly | |
| Add APLT to Watchlist: View: Get Complete APLT Trend Analysis ➞ | |
 | VXRT Vaxart, Inc. |
| Sector: Health Care | |
| SubSector: Biotechnology | |
| MarketCap: 129.785 Millions | |
| Recent Price: 0.84 Smart Investing & Trading Score: 15 | |
| Day Percent Change: -3.48% Day Change: -0.03 | |
| Week Change: -8.14% Year-to-date Change: 46.0% | |
| VXRT Links: Profile News Message Board | |
| Charts:- Daily , Weekly | |
| Add VXRT to Watchlist: View: Get Complete VXRT Trend Analysis ➞ | |
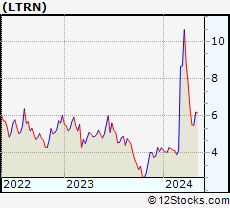 | LTRN Lantern Pharma Inc. |
| Sector: Health Care | |
| SubSector: Biotechnology | |
| MarketCap: 11487 Millions | |
| Recent Price: 5.87 Smart Investing & Trading Score: 36 | |
| Day Percent Change: -2.17% Day Change: -0.13 | |
| Week Change: -8.14% Year-to-date Change: 36.8% | |
| LTRN Links: Profile News Message Board | |
| Charts:- Daily , Weekly | |
| Add LTRN to Watchlist: View: Get Complete LTRN Trend Analysis ➞ | |
 | ILMN Illumina, Inc. |
| Sector: Health Care | |
| SubSector: Biotechnology | |
| MarketCap: 39194.3 Millions | |
| Recent Price: 116.64 Smart Investing & Trading Score: 10 | |
| Day Percent Change: -1.39% Day Change: -1.65 | |
| Week Change: -8.21% Year-to-date Change: -16.2% | |
| ILMN Links: Profile News Message Board | |
| Charts:- Daily , Weekly | |
| Add ILMN to Watchlist: View: Get Complete ILMN Trend Analysis ➞ | |
 | TRVI Trevi Therapeutics, Inc. |
| Sector: Health Care | |
| SubSector: Biotechnology | |
| MarketCap: 50.6785 Millions | |
| Recent Price: 2.68 Smart Investing & Trading Score: 48 | |
| Day Percent Change: 3.88% Day Change: 0.10 | |
| Week Change: -8.22% Year-to-date Change: 100.0% | |
| TRVI Links: Profile News Message Board | |
| Charts:- Daily , Weekly | |
| Add TRVI to Watchlist: View: Get Complete TRVI Trend Analysis ➞ | |
 | SNDL Sundial Growers Inc. |
| Sector: Health Care | |
| SubSector: Drug Manufacturers - Other | |
| MarketCap: 94.4033 Millions | |
| Recent Price: 1.84 Smart Investing & Trading Score: 41 | |
| Day Percent Change: 0.27% Day Change: 0.00 | |
| Week Change: -8.25% Year-to-date Change: 11.9% | |
| SNDL Links: Profile News Message Board | |
| Charts:- Daily , Weekly | |
| Add SNDL to Watchlist: View: Get Complete SNDL Trend Analysis ➞ | |
 | APLS Apellis Pharmaceuticals, Inc. |
| Sector: Health Care | |
| SubSector: Biotechnology | |
| MarketCap: 2030.95 Millions | |
| Recent Price: 47.51 Smart Investing & Trading Score: 10 | |
| Day Percent Change: -1.08% Day Change: -0.52 | |
| Week Change: -8.26% Year-to-date Change: -20.6% | |
| APLS Links: Profile News Message Board | |
| Charts:- Daily , Weekly | |
| Add APLS to Watchlist: View: Get Complete APLS Trend Analysis ➞ | |
 | MGNX MacroGenics, Inc. |
| Sector: Health Care | |
| SubSector: Biotechnology | |
| MarketCap: 262.785 Millions | |
| Recent Price: 16.08 Smart Investing & Trading Score: 46 | |
| Day Percent Change: -0.12% Day Change: -0.02 | |
| Week Change: -8.32% Year-to-date Change: 67.2% | |
| MGNX Links: Profile News Message Board | |
| Charts:- Daily , Weekly | |
| Add MGNX to Watchlist: View: Get Complete MGNX Trend Analysis ➞ | |
 | SCPH scPharmaceuticals Inc. |
| Sector: Health Care | |
| SubSector: Biotechnology | |
| MarketCap: 136.185 Millions | |
| Recent Price: 4.52 Smart Investing & Trading Score: 0 | |
| Day Percent Change: 2.26% Day Change: 0.10 | |
| Week Change: -8.32% Year-to-date Change: -27.9% | |
| SCPH Links: Profile News Message Board | |
| Charts:- Daily , Weekly | |
| Add SCPH to Watchlist: View: Get Complete SCPH Trend Analysis ➞ | |
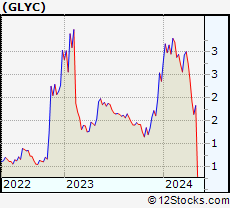 | GLYC GlycoMimetics, Inc. |
| Sector: Health Care | |
| SubSector: Biotechnology | |
| MarketCap: 100.785 Millions | |
| Recent Price: 2.19 Smart Investing & Trading Score: 10 | |
| Day Percent Change: -6.41% Day Change: -0.15 | |
| Week Change: -8.37% Year-to-date Change: -7.2% | |
| GLYC Links: Profile News Message Board | |
| Charts:- Daily , Weekly | |
| Add GLYC to Watchlist: View: Get Complete GLYC Trend Analysis ➞ | |
 | CERT Certara, Inc. |
| Sector: Health Care | |
| SubSector: Biotechnology | |
| MarketCap: 21487 Millions | |
| Recent Price: 16.19 Smart Investing & Trading Score: 36 | |
| Day Percent Change: -4.51% Day Change: -0.76 | |
| Week Change: -8.38% Year-to-date Change: -8.0% | |
| CERT Links: Profile News Message Board | |
| Charts:- Daily , Weekly | |
| Add CERT to Watchlist: View: Get Complete CERT Trend Analysis ➞ | |
 | HCM Hutchison China MediTech Limited |
| Sector: Health Care | |
| SubSector: Drug Manufacturers - Major | |
| MarketCap: 2324.43 Millions | |
| Recent Price: 16.38 Smart Investing & Trading Score: 41 | |
| Day Percent Change: -0.43% Day Change: -0.07 | |
| Week Change: -8.39% Year-to-date Change: -9.6% | |
| HCM Links: Profile News Message Board | |
| Charts:- Daily , Weekly | |
| Add HCM to Watchlist: View: Get Complete HCM Trend Analysis ➞ | |
 | RGEN Repligen Corporation |
| Sector: Health Care | |
| SubSector: Biotechnology | |
| MarketCap: 4711.75 Millions | |
| Recent Price: 157.12 Smart Investing & Trading Score: 0 | |
| Day Percent Change: -2.40% Day Change: -3.86 | |
| Week Change: -8.4% Year-to-date Change: -12.6% | |
| RGEN Links: Profile News Message Board | |
| Charts:- Daily , Weekly | |
| Add RGEN to Watchlist: View: Get Complete RGEN Trend Analysis ➞ | |
| For tabular summary view of above stock list: Summary View ➞ 0 - 25 , 25 - 50 , 50 - 75 , 75 - 100 , 100 - 125 , 125 - 150 , 150 - 175 , 175 - 200 , 200 - 225 , 225 - 250 , 250 - 275 , 275 - 300 , 300 - 325 , 325 - 350 , 350 - 375 , 375 - 400 , 400 - 425 , 425 - 450 , 450 - 475 , 475 - 500 , 500 - 525 , 525 - 550 , 550 - 575 , 575 - 600 , 600 - 625 , 625 - 650 , 650 - 675 , 675 - 700 , 700 - 725 | ||
| Click To Change The Sort Order: By Market Cap or Company Size Performance: Year-to-date, Week and Day | |
| Select Chart Type: | ||
|
Best Stocks Today 12Stocks.com |
© 2024 12Stocks.com Terms & Conditions Privacy Contact Us
All Information Provided Only For Education And Not To Be Used For Investing or Trading. See Terms & Conditions


One More Thing ... Get Best Stocks Delivered Daily!
Never Ever Miss A Move With Our Top Ten Stocks Lists
Find Best Stocks In Any Market - Bull or Bear Market
Take A Peek At Our Top Ten Stocks Lists: Daily, Weekly, Year-to-Date & Top Trends
Find Best Stocks In Any Market - Bull or Bear Market
Take A Peek At Our Top Ten Stocks Lists: Daily, Weekly, Year-to-Date & Top Trends
Healthcare Stocks With Best Up Trends [0-bearish to 100-bullish]: Cullinan Oncology[100], Oscar Health[100], Lantheus [100], Geron [100], ALX Oncology[100], Zura Bio[93], PROCEPT BioRobotics[93], NuCana [93], Reneo [93], Avadel [93], Vanda [93]
Best Healthcare Stocks Year-to-Date:
Precision BioSciences[2850.68%], Inovio [1903.92%], Assembly Biosciences[1479.08%], Adverum Biotechnologies[1361.21%], Aurora Cannabis[1276.52%], NuCana [1269.17%], Zhongchao [825.77%], Affimed N.V[733.6%], Corbus [503.73%], Agenus [500.31%], CareMax [417.53%] Best Healthcare Stocks This Week:
NuCana [1708.84%], Zhongchao [106.1%], Agile [65.44%], Regencell Bioscience[60.89%], 23andMe Holding[33.3%], ProKidney [32%], ALX Oncology[20.64%], Vanda [20.63%], Galera [16.43%], Venus Concept[15.35%], Cullinan Oncology[13.89%] Best Healthcare Stocks Daily:
Zhongchao [146.72%], 23andMe Holding[65.91%], Agile [64.76%], Regencell Bioscience[29.41%], Veru [22.41%], Canopy Growth[20.49%], Zura Bio[17.20%], Aurora Cannabis[13.21%], Bicycle [12.33%], RedHill Biopharma[11.57%], DURECT [10.48%]