
 Login Sign Up


| |||||
 |  | ||||

| 12Stocks.com Market Intelligence |
Best Healthcare Stocks
 | "Discover best trending healthcare stocks with 12Stocks.com." |
| - Subu Vdaygiri, Founder, 12Stocks.com |
| In a hurry? Healthcare Stocks Lists: Performance Trends Table, Stock Charts
Sort Healthcare stocks: Daily, Weekly, Year-to-Date, Market Cap & Trends. Filter Healthcare stocks list by size:All Healthcare Large Mid-Range Small |
| 12Stocks.com Healthcare Stocks Performances & Trends Daily | |||||||||
|
|  The overall Smart Investing & Trading Score is 18 (0-bearish to 100-bullish) which puts Healthcare sector in short term bearish trend. The Smart Investing & Trading Score from previous trading session is 10 and an improvement of trend continues.
| ||||||||
Here are the Smart Investing & Trading Scores of the most requested Healthcare stocks at 12Stocks.com (click stock name for detailed review):
|


| 12Stocks.com: Investing in Healthcare sector with Stocks | |
|
The following table helps investors and traders sort through current performance and trends (as measured by Smart Investing & Trading Score) of various
stocks in the Healthcare sector. Quick View: Move mouse or cursor over stock symbol (ticker) to view short-term Technical chart and over stock name to view long term chart. Click on  to add stock symbol to your watchlist and to add stock symbol to your watchlist and  to view watchlist. Click on any ticker or stock name for detailed market intelligence report for that stock. to view watchlist. Click on any ticker or stock name for detailed market intelligence report for that stock. |
12Stocks.com Performance of Stocks in Healthcare Sector
| Ticker | Stock Name | Watchlist | Category | Recent Price | Smart Investing & Trading Score | Change % | Weekly Change% |
| DYN | Dyne |   | Biotechnology | 23.65 | 20 | -4.71% | -8.51% |
| ARWR | Arrowhead | | Biotechnology | 22.61 | 0 | -3.02% | -8.54% |
| JANX | Janux | | Biotechnology | 48.15 | 51 | 0.46% | -8.55% |
| OLMA | Olema | | Biotechnology | 9.92 | 0 | -7.46% | -8.66% |
| EXAI | Exscientia | | Biotechnology | 4.49 | 32 | 3.82% | -8.66% |
| WRBY | Warby Parker | | Instruments | 12.07 | 5 | -0.17% | -8.70% |
| ABCL | AbCellera Biologics | | Biotechnology | 3.96 | 12 | 1.02% | -8.76% |
| STOK | Stoke | | Biotechnology | 11.65 | 36 | -0.60% | -8.77% |
| ARDX | Ardelyx | | Biotechnology | 6.44 | 0 | -1.68% | -8.78% |
| WAT | Waters | | Instruments | 294.23 | 0 | -3.27% | -8.81% |
| VIGL | Vigil Neuroscience | | Biotechnology | 2.94 | 43 | 0.86% | -8.85% |
| AMRN | Amarin | | Biotechnology | 0.87 | 5 | -4.94% | -8.90% |
| VALN | Valneva SE | | Biotechnology | 7.75 | 15 | -3.12% | -8.93% |
| ALLO | Allogene | | Biotechnology | 3.46 | 15 | -1.42% | -8.95% |
| SGHT | Sight Sciences | | Medical Devices | 5.29 | 36 | -1.49% | -8.95% |
| INSM | Insmed | | Biotechnology | 24.80 | 0 | -5.27% | -8.99% |
| ASMB | Assembly Biosciences | | Biotechnology | 13.33 | 44 | 3.17% | -9.01% |
| EYEN | Eyenovia | | Biotechnology | 0.54 | 10 | -0.15% | -9.04% |
| TARS | Tarsus | | Biotechnology | 32.89 | 31 | -4.50% | -9.07% |
| DNLI | Denali | | Biotechnology | 16.60 | 36 | -1.31% | -9.09% |
| NVAX | Novavax | | Biotechnology | 3.89 | 20 | 0.00% | -9.11% |
| AXGN | AxoGen | | Equipment | 6.55 | 0 | -5.62% | -9.15% |
| OMGA | Omega | | Biotechnology | 2.43 | 10 | -5.26% | -9.16% |
| RNLX | Renalytix AI | | Diagnostics & Research | 0.81 | 36 | -2.17% | -9.17% |
| STRO | Sutro Biopharma | | Biotechnology | 3.76 | 10 | -1.05% | -9.18% |
| For chart view version of above stock list: Chart View ➞ 0 - 25 , 25 - 50 , 50 - 75 , 75 - 100 , 100 - 125 , 125 - 150 , 150 - 175 , 175 - 200 , 200 - 225 , 225 - 250 , 250 - 275 , 275 - 300 , 300 - 325 , 325 - 350 , 350 - 375 , 375 - 400 , 400 - 425 , 425 - 450 , 450 - 475 , 475 - 500 , 500 - 525 , 525 - 550 , 550 - 575 , 575 - 600 , 600 - 625 , 625 - 650 , 650 - 675 , 675 - 700 , 700 - 725 | ||
 | Click To Change The Sort Order: By Market Cap or Company Size Performance: Year-to-date, Week and Day |  |
|
Get the most comprehensive stock market coverage daily at 12Stocks.com ➞ Best Stocks Today ➞ Best Stocks Weekly ➞ Best Stocks Year-to-Date ➞ Best Stocks Trends ➞  Best Stocks Today 12Stocks.com Best Nasdaq Stocks ➞ Best S&P 500 Stocks ➞ Best Tech Stocks ➞ Best Biotech Stocks ➞ |
| Detailed Overview of Healthcare Stocks |
| Healthcare Technical Overview, Leaders & Laggards, Top Healthcare ETF Funds & Detailed Healthcare Stocks List, Charts, Trends & More |
| Healthcare Sector: Technical Analysis, Trends & YTD Performance | |
| Healthcare sector is composed of stocks
from pharmaceutical, biotech, diagnostics labs, insurance providers
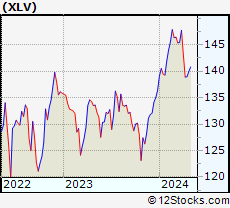
and healthcare services. Healthcare sector, as represented by XLV, an exchange-traded fund [ETF] that holds basket of Healthcare stocks (e.g, Merck, Amgen) is up by 1.5% and is currently underperforming the overall market by -2.69% year-to-date. Below is a quick view of Technical charts and trends: |
|
 XLV Weekly Chart |
|
| Long Term Trend: Not Good | |
| Medium Term Trend: Not Good | |
 XLV Daily Chart |
|
| Short Term Trend: Deteriorating | |
| Overall Trend Score: 18 | |
| YTD Performance: 1.5% | |
| **Trend Scores & Views Are Only For Educational Purposes And Not For Investing | |
| 12Stocks.com: Top Performing Healthcare Sector Stocks | ||||||||||||||||||||||||||||||||||||||||||||||||
 The top performing Healthcare sector stocks year to date are
Now, more recently, over last week, the top performing Healthcare sector stocks on the move are


|
||||||||||||||||||||||||||||||||||||||||||||||||
| 12Stocks.com: Investing in Healthcare Sector using Exchange Traded Funds | |
|
The following table shows list of key exchange traded funds (ETF) that
help investors track Healthcare Index. For detailed view, check out our ETF Funds section of our website. Quick View: Move mouse or cursor over ETF symbol (ticker) to view short-term Technical chart and over ETF name to view long term chart. Click on ticker or stock name for detailed view. Click on to add stock symbol to your watchlist and to view watchlist. |
12Stocks.com List of ETFs that track Healthcare Index
| Ticker | ETF Name | Watchlist | Recent Price | Smart Investing & Trading Score | Change % | Week % | Year-to-date % |
| XLV | Health Care | | 138.43 | 18 | -0.01 | -0.35 | 1.5% |
| XBI | Biotech | | 83.48 | 0 | -1.38 | -5.3 | -6.51% |
| IBB | Biotechnology | | 124.64 | 0 | -0.99 | -3.81 | -8.25% |
| BBH | Biotech | | 152.35 | 10 | -0.43 | -3.33 | -7.84% |
| VHT | Health Care | | 252.83 | 18 | -0.12 | -0.76 | 0.85% |
| IYH | Healthcare | | 58.05 | 18 | -0.02 | -0.6 | 1.4% |
| IHF | Healthcare Providers | | 51.55 | 32 | 0.93 | 1.99 | -1.84% |
| IHI | Medical Devices | | 54.53 | 5 | -0.46 | -2.8 | 1.04% |
| BIB | Biotechnology | | 47.94 | 0 | -2.02 | -6.71 | -15.97% |
| BIS | Short Biotech | | 20.87 | 100 | 1.69 | 6.46 | 15.47% |
| XHE | Health Care Equipment | | 81.44 | 10 | -0.74 | -2.93 | -3.35% |
| CURE | Healthcare Bull 3X | | 102.22 | 18 | -0.44 | -1.14 | 0.47% |
| LABU | Biotech Bull 3X | | 88.04 | 0 | -4.33 | -15.63 | -27.82% |
| LABD | Biotech Bear 3X | | 10.52 | 100 | 4.37 | 17.15 | 8.57% |
| PSCH | SmallCap Health Care | | 40.08 | 10 | -0.87 | -3.26 | -6.36% |
| XHS | Health Care Services | | 86.19 | 10 | -0.16 | -2.07 | -3.1% |
| PTH | DWA Healthcare Momentum | | 39.57 | 23 | -2.18 | -5.4 | 1.1% |
| BTEC | Principal Healthcare Innovators | | 34.09 | 0 | -1.51 | -5.29 | -6.17% |
| RXL | Health Care | | 92.44 | 10 | -0.61 | -0.88 | 1.13% |
| RXD | Short Health Care | | 11.67 | 76 | -0.05 | 0.64 | -2.11% |
| 12Stocks.com: Charts, Trends, Fundamental Data and Performances of Healthcare Stocks | |
|
We now take in-depth look at all Healthcare stocks including charts, multi-period performances and overall trends (as measured by Smart Investing & Trading Score). One can sort Healthcare stocks (click link to choose) by Daily, Weekly and by Year-to-Date performances. Also, one can sort by size of the company or by market capitalization. |
| Select Your Default Chart Type: | |||||
| |||||
| Click on stock symbol or name for detailed view. Click on to add stock symbol to your watchlist and to view watchlist. Quick View: Move mouse or cursor over "Daily" to quickly view daily Technical stock chart and over "Weekly" to view weekly Technical stock chart. | |||||

 | DYN Dyne Therapeutics, Inc. |
| Sector: Health Care | |
| SubSector: Biotechnology | |
| MarketCap: 88487 Millions | |
| Recent Price: 23.65 Smart Investing & Trading Score: 20 | |
| Day Percent Change: -4.71% Day Change: -1.17 | |
| Week Change: -8.51% Year-to-date Change: 77.8% | |
| DYN Links: Profile News Message Board | |
| Charts:- Daily , Weekly | |
| Add DYN to Watchlist: View: Get Complete DYN Trend Analysis ➞ | |
 | ARWR Arrowhead Pharmaceuticals, Inc. |
| Sector: Health Care | |
| SubSector: Biotechnology | |
| MarketCap: 3226.15 Millions | |
| Recent Price: 22.61 Smart Investing & Trading Score: 0 | |
| Day Percent Change: -3.02% Day Change: -0.71 | |
| Week Change: -8.54% Year-to-date Change: -26.1% | |
| ARWR Links: Profile News Message Board | |
| Charts:- Daily , Weekly | |
| Add ARWR to Watchlist: View: Get Complete ARWR Trend Analysis ➞ | |
 | JANX Janux Therapeutics, Inc. |
| Sector: Health Care | |
| SubSector: Biotechnology | |
| MarketCap: 496 Millions | |
| Recent Price: 48.15 Smart Investing & Trading Score: 51 | |
| Day Percent Change: 0.46% Day Change: 0.22 | |
| Week Change: -8.55% Year-to-date Change: 348.1% | |
| JANX Links: Profile News Message Board | |
| Charts:- Daily , Weekly | |
| Add JANX to Watchlist: View: Get Complete JANX Trend Analysis ➞ | |
 | OLMA Olema Pharmaceuticals, Inc. |
| Sector: Health Care | |
| SubSector: Biotechnology | |
| MarketCap: 17687 Millions | |
| Recent Price: 9.92 Smart Investing & Trading Score: 0 | |
| Day Percent Change: -7.46% Day Change: -0.80 | |
| Week Change: -8.66% Year-to-date Change: -29.5% | |
| OLMA Links: Profile News Message Board | |
| Charts:- Daily , Weekly | |
| Add OLMA to Watchlist: View: Get Complete OLMA Trend Analysis ➞ | |
 | EXAI Exscientia plc |
| Sector: Health Care | |
| SubSector: Biotechnology | |
| MarketCap: 796 Millions | |
| Recent Price: 4.49 Smart Investing & Trading Score: 32 | |
| Day Percent Change: 3.82% Day Change: 0.17 | |
| Week Change: -8.66% Year-to-date Change: -30.7% | |
| EXAI Links: Profile News Message Board | |
| Charts:- Daily , Weekly | |
| Add EXAI to Watchlist: View: Get Complete EXAI Trend Analysis ➞ | |
 | WRBY Warby Parker Inc. |
| Sector: Health Care | |
| SubSector: Medical Instruments & Supplies | |
| MarketCap: 1380 Millions | |
| Recent Price: 12.07 Smart Investing & Trading Score: 5 | |
| Day Percent Change: -0.17% Day Change: -0.02 | |
| Week Change: -8.7% Year-to-date Change: -14.4% | |
| WRBY Links: Profile News Message Board | |
| Charts:- Daily , Weekly | |
| Add WRBY to Watchlist: View: Get Complete WRBY Trend Analysis ➞ | |
 | ABCL AbCellera Biologics Inc. |
| Sector: Health Care | |
| SubSector: Biotechnology | |
| MarketCap: 1870 Millions | |
| Recent Price: 3.96 Smart Investing & Trading Score: 12 | |
| Day Percent Change: 1.02% Day Change: 0.04 | |
| Week Change: -8.76% Year-to-date Change: -29.9% | |
| ABCL Links: Profile News Message Board | |
| Charts:- Daily , Weekly | |
| Add ABCL to Watchlist: View: Get Complete ABCL Trend Analysis ➞ | |
 | STOK Stoke Therapeutics, Inc. |
| Sector: Health Care | |
| SubSector: Biotechnology | |
| MarketCap: 772.485 Millions | |
| Recent Price: 11.65 Smart Investing & Trading Score: 36 | |
| Day Percent Change: -0.60% Day Change: -0.07 | |
| Week Change: -8.77% Year-to-date Change: 121.5% | |
| STOK Links: Profile News Message Board | |
| Charts:- Daily , Weekly | |
| Add STOK to Watchlist: View: Get Complete STOK Trend Analysis ➞ | |
 | ARDX Ardelyx, Inc. |
| Sector: Health Care | |
| SubSector: Biotechnology | |
| MarketCap: 541.985 Millions | |
| Recent Price: 6.44 Smart Investing & Trading Score: 0 | |
| Day Percent Change: -1.68% Day Change: -0.11 | |
| Week Change: -8.78% Year-to-date Change: 3.9% | |
| ARDX Links: Profile News Message Board | |
| Charts:- Daily , Weekly | |
| Add ARDX to Watchlist: View: Get Complete ARDX Trend Analysis ➞ | |
 | WAT Waters Corporation |
| Sector: Health Care | |
| SubSector: Medical Instruments & Supplies | |
| MarketCap: 11882 Millions | |
| Recent Price: 294.23 Smart Investing & Trading Score: 0 | |
| Day Percent Change: -3.27% Day Change: -9.95 | |
| Week Change: -8.81% Year-to-date Change: -10.6% | |
| WAT Links: Profile News Message Board | |
| Charts:- Daily , Weekly | |
| Add WAT to Watchlist: View: Get Complete WAT Trend Analysis ➞ | |
 | VIGL Vigil Neuroscience, Inc. |
| Sector: Health Care | |
| SubSector: Biotechnology | |
| MarketCap: 339 Millions | |
| Recent Price: 2.94 Smart Investing & Trading Score: 43 | |
| Day Percent Change: 0.86% Day Change: 0.02 | |
| Week Change: -8.85% Year-to-date Change: -14.4% | |
| VIGL Links: Profile News Message Board | |
| Charts:- Daily , Weekly | |
| Add VIGL to Watchlist: View: Get Complete VIGL Trend Analysis ➞ | |
 | AMRN Amarin Corporation plc |
| Sector: Health Care | |
| SubSector: Biotechnology | |
| MarketCap: 4197.45 Millions | |
| Recent Price: 0.87 Smart Investing & Trading Score: 5 | |
| Day Percent Change: -4.94% Day Change: -0.05 | |
| Week Change: -8.9% Year-to-date Change: 0.2% | |
| AMRN Links: Profile News Message Board | |
| Charts:- Daily , Weekly | |
| Add AMRN to Watchlist: View: Get Complete AMRN Trend Analysis ➞ | |
 | VALN Valneva SE |
| Sector: Health Care | |
| SubSector: Biotechnology | |
| MarketCap: 1010 Millions | |
| Recent Price: 7.75 Smart Investing & Trading Score: 15 | |
| Day Percent Change: -3.12% Day Change: -0.25 | |
| Week Change: -8.93% Year-to-date Change: -25.3% | |
| VALN Links: Profile News Message Board | |
| Charts:- Daily , Weekly | |
| Add VALN to Watchlist: View: Get Complete VALN Trend Analysis ➞ | |
 | ALLO Allogene Therapeutics, Inc. |
| Sector: Health Care | |
| SubSector: Biotechnology | |
| MarketCap: 2858.65 Millions | |
| Recent Price: 3.46 Smart Investing & Trading Score: 15 | |
| Day Percent Change: -1.42% Day Change: -0.05 | |
| Week Change: -8.95% Year-to-date Change: 7.8% | |
| ALLO Links: Profile News Message Board | |
| Charts:- Daily , Weekly | |
| Add ALLO to Watchlist: View: Get Complete ALLO Trend Analysis ➞ | |
 | SGHT Sight Sciences, Inc. |
| Sector: Health Care | |
| SubSector: Medical Devices | |
| MarketCap: 381 Millions | |
| Recent Price: 5.29 Smart Investing & Trading Score: 36 | |
| Day Percent Change: -1.49% Day Change: -0.08 | |
| Week Change: -8.95% Year-to-date Change: 2.4% | |
| SGHT Links: Profile News Message Board | |
| Charts:- Daily , Weekly | |
| Add SGHT to Watchlist: View: Get Complete SGHT Trend Analysis ➞ | |
 | INSM Insmed Incorporated |
| Sector: Health Care | |
| SubSector: Biotechnology | |
| MarketCap: 1452.45 Millions | |
| Recent Price: 24.80 Smart Investing & Trading Score: 0 | |
| Day Percent Change: -5.27% Day Change: -1.38 | |
| Week Change: -8.99% Year-to-date Change: -20.0% | |
| INSM Links: Profile News Message Board | |
| Charts:- Daily , Weekly | |
| Add INSM to Watchlist: View: Get Complete INSM Trend Analysis ➞ | |
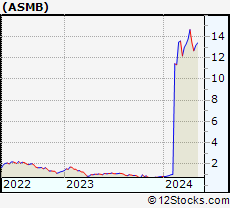 | ASMB Assembly Biosciences, Inc. |
| Sector: Health Care | |
| SubSector: Biotechnology | |
| MarketCap: 569.485 Millions | |
| Recent Price: 13.33 Smart Investing & Trading Score: 44 | |
| Day Percent Change: 3.17% Day Change: 0.41 | |
| Week Change: -9.01% Year-to-date Change: 1,525.4% | |
| ASMB Links: Profile News Message Board | |
| Charts:- Daily , Weekly | |
| Add ASMB to Watchlist: View: Get Complete ASMB Trend Analysis ➞ | |
 | EYEN Eyenovia, Inc. |
| Sector: Health Care | |
| SubSector: Biotechnology | |
| MarketCap: 52.2785 Millions | |
| Recent Price: 0.54 Smart Investing & Trading Score: 10 | |
| Day Percent Change: -0.15% Day Change: 0.00 | |
| Week Change: -9.04% Year-to-date Change: -74.2% | |
| EYEN Links: Profile News Message Board | |
| Charts:- Daily , Weekly | |
| Add EYEN to Watchlist: View: Get Complete EYEN Trend Analysis ➞ | |
 | TARS Tarsus Pharmaceuticals, Inc. |
| Sector: Health Care | |
| SubSector: Biotechnology | |
| MarketCap: 74487 Millions | |
| Recent Price: 32.89 Smart Investing & Trading Score: 31 | |
| Day Percent Change: -4.50% Day Change: -1.55 | |
| Week Change: -9.07% Year-to-date Change: 62.2% | |
| TARS Links: Profile News Message Board | |
| Charts:- Daily , Weekly | |
| Add TARS to Watchlist: View: Get Complete TARS Trend Analysis ➞ | |
 | DNLI Denali Therapeutics Inc. |
| Sector: Health Care | |
| SubSector: Biotechnology | |
| MarketCap: 2020.05 Millions | |
| Recent Price: 16.60 Smart Investing & Trading Score: 36 | |
| Day Percent Change: -1.31% Day Change: -0.22 | |
| Week Change: -9.09% Year-to-date Change: -22.7% | |
| DNLI Links: Profile News Message Board | |
| Charts:- Daily , Weekly | |
| Add DNLI to Watchlist: View: Get Complete DNLI Trend Analysis ➞ | |
 | NVAX Novavax, Inc. |
| Sector: Health Care | |
| SubSector: Biotechnology | |
| MarketCap: 376.185 Millions | |
| Recent Price: 3.89 Smart Investing & Trading Score: 20 | |
| Day Percent Change: 0.00% Day Change: 0.00 | |
| Week Change: -9.11% Year-to-date Change: -19.0% | |
| NVAX Links: Profile News Message Board | |
| Charts:- Daily , Weekly | |
| Add NVAX to Watchlist: View: Get Complete NVAX Trend Analysis ➞ | |
 | AXGN AxoGen, Inc. |
| Sector: Health Care | |
| SubSector: Medical Appliances & Equipment | |
| MarketCap: 349.28 Millions | |
| Recent Price: 6.55 Smart Investing & Trading Score: 0 | |
| Day Percent Change: -5.62% Day Change: -0.39 | |
| Week Change: -9.15% Year-to-date Change: -4.1% | |
| AXGN Links: Profile News Message Board | |
| Charts:- Daily , Weekly | |
| Add AXGN to Watchlist: View: Get Complete AXGN Trend Analysis ➞ | |
 | OMGA Omega Therapeutics, Inc. |
| Sector: Health Care | |
| SubSector: Biotechnology | |
| MarketCap: 304 Millions | |
| Recent Price: 2.43 Smart Investing & Trading Score: 10 | |
| Day Percent Change: -5.26% Day Change: -0.13 | |
| Week Change: -9.16% Year-to-date Change: -19.3% | |
| OMGA Links: Profile News Message Board | |
| Charts:- Daily , Weekly | |
| Add OMGA to Watchlist: View: Get Complete OMGA Trend Analysis ➞ | |
 | RNLX Renalytix AI plc |
| Sector: Health Care | |
| SubSector: Diagnostics & Research | |
| MarketCap: 45487 Millions | |
| Recent Price: 0.81 Smart Investing & Trading Score: 36 | |
| Day Percent Change: -2.17% Day Change: -0.02 | |
| Week Change: -9.17% Year-to-date Change: 107.4% | |
| RNLX Links: Profile News Message Board | |
| Charts:- Daily , Weekly | |
| Add RNLX to Watchlist: View: Get Complete RNLX Trend Analysis ➞ | |
 | STRO Sutro Biopharma, Inc. |
| Sector: Health Care | |
| SubSector: Biotechnology | |
| MarketCap: 196.485 Millions | |
| Recent Price: 3.76 Smart Investing & Trading Score: 10 | |
| Day Percent Change: -1.05% Day Change: -0.04 | |
| Week Change: -9.18% Year-to-date Change: -12.4% | |
| STRO Links: Profile News Message Board | |
| Charts:- Daily , Weekly | |
| Add STRO to Watchlist: View: Get Complete STRO Trend Analysis ➞ | |
| For tabular summary view of above stock list: Summary View ➞ 0 - 25 , 25 - 50 , 50 - 75 , 75 - 100 , 100 - 125 , 125 - 150 , 150 - 175 , 175 - 200 , 200 - 225 , 225 - 250 , 250 - 275 , 275 - 300 , 300 - 325 , 325 - 350 , 350 - 375 , 375 - 400 , 400 - 425 , 425 - 450 , 450 - 475 , 475 - 500 , 500 - 525 , 525 - 550 , 550 - 575 , 575 - 600 , 600 - 625 , 625 - 650 , 650 - 675 , 675 - 700 , 700 - 725 | ||
| Click To Change The Sort Order: By Market Cap or Company Size Performance: Year-to-date, Week and Day | |
| Select Chart Type: | ||
|
Best Stocks Today 12Stocks.com |
© 2024 12Stocks.com Terms & Conditions Privacy Contact Us
All Information Provided Only For Education And Not To Be Used For Investing or Trading. See Terms & Conditions


One More Thing ... Get Best Stocks Delivered Daily!
Never Ever Miss A Move With Our Top Ten Stocks Lists
Find Best Stocks In Any Market - Bull or Bear Market
Take A Peek At Our Top Ten Stocks Lists: Daily, Weekly, Year-to-Date & Top Trends
Find Best Stocks In Any Market - Bull or Bear Market
Take A Peek At Our Top Ten Stocks Lists: Daily, Weekly, Year-to-Date & Top Trends
Healthcare Stocks With Best Up Trends [0-bearish to 100-bullish]: Zhongchao [100], Cullinan Oncology[100], Oscar Health[100], ALX Oncology[100], Geron [95], Zura Bio[93], PROCEPT BioRobotics[93], NuCana [93], Reneo [93], Vanda [93], Lantheus [93]
Best Healthcare Stocks Year-to-Date:
Precision BioSciences[2836.99%], Inovio [1900%], Assembly Biosciences[1525.41%], Adverum Biotechnologies[1381.14%], Aurora Cannabis[1272.32%], NuCana [1269.17%], Zhongchao [825.77%], Affimed N.V[711.2%], Corbus [504.8%], Agenus [500.31%], CareMax [417.53%] Best Healthcare Stocks This Week:
NuCana [1708.84%], Zhongchao [106.1%], Regencell Bioscience[37.01%], 23andMe Holding[33.3%], ProKidney [32%], ALX Oncology[20.64%], Vanda [20.63%], Galera [16.43%], Venus Concept[15.35%], Cullinan Oncology[13.89%], Rani [13.15%] Best Healthcare Stocks Daily:
Zhongchao [146.72%], 23andMe Holding[65.91%], Veru [22.41%], Canopy Growth[20.65%], Zura Bio[17.20%], Aurora Cannabis[12.87%], Bicycle [12.33%], Regencell Bioscience[10.20%], Vaxxinity [10.05%], DURECT [9.77%], Annovis Bio[9.57%]