
 Login Sign Up


| |||||
 |  | ||||

| 12Stocks.com Market Intelligence |
Best Healthcare Stocks
 | "Discover best trending healthcare stocks with 12Stocks.com." |
| - Subu Vdaygiri, Founder, 12Stocks.com |
| In a hurry? Healthcare Stocks Lists: Performance Trends Table, Stock Charts
Sort Healthcare stocks: Daily, Weekly, Year-to-Date, Market Cap & Trends. Filter Healthcare stocks list by size:All Healthcare Large Mid-Range Small |
| 12Stocks.com Healthcare Stocks Performances & Trends Daily | |||||||||
|
|  The overall Smart Investing & Trading Score is 18 (0-bearish to 100-bullish) which puts Healthcare sector in short term bearish trend. The Smart Investing & Trading Score from previous trading session is 10 and an improvement of trend continues.
| ||||||||
Here are the Smart Investing & Trading Scores of the most requested Healthcare stocks at 12Stocks.com (click stock name for detailed review):
|


| 12Stocks.com: Investing in Healthcare sector with Stocks | |
|
The following table helps investors and traders sort through current performance and trends (as measured by Smart Investing & Trading Score) of various
stocks in the Healthcare sector. Quick View: Move mouse or cursor over stock symbol (ticker) to view short-term Technical chart and over stock name to view long term chart. Click on  to add stock symbol to your watchlist and to add stock symbol to your watchlist and  to view watchlist. Click on any ticker or stock name for detailed market intelligence report for that stock. to view watchlist. Click on any ticker or stock name for detailed market intelligence report for that stock. |
12Stocks.com Performance of Stocks in Healthcare Sector
| Ticker | Stock Name | Watchlist | Category | Recent Price | Smart Investing & Trading Score | Change % | Weekly Change% |
| ARCT | Arcturus |   | Biotechnology | 26.31 | 0 | -4.81% | -13.54% |
| PLRX | Pliant | | Biotechnology | 12.23 | 0 | -4.90% | -13.57% |
| RAPT | RAPT | | Biotechnology | 7.93 | 10 | -1.37% | -13.71% |
| NRIX | Nurix | | Biotechnology | 14.43 | 43 | 2.34% | -13.80% |
| CASI | CASI | | Biotechnology | 2.24 | 17 | 0.00% | -13.85% |
| BYSI | BeyondSpring | | Biotechnology | 1.80 | 51 | -2.70% | -13.88% |
| PRME | Prime Medicine | | Biotechnology | 4.93 | 55 | -0.10% | -13.96% |
| FGEN | FibroGen | | Biotechnology | 1.17 | 20 | -7.87% | -13.97% |
| QTRX | Quanterix | | Biotechnology | 15.79 | 10 | 0.25% | -14.04% |
| EPIX | ESSA Pharma | | Biotechnology | 6.67 | 0 | -5.66% | -14.05% |
| HROW | Harrow Health | | Pharmaceutical | 10.84 | 36 | -8.29% | -14.31% |
| XBIT | XBiotech | | Biotechnology | 7.91 | 36 | -2.47% | -14.49% |
| OMER | Omeros | | Biotechnology | 3.21 | 0 | -3.89% | -14.63% |
| TALK | Talkspace | | Health Information | 2.97 | 33 | 1.02% | -14.66% |
| GALT | Galectin | | Biotechnology | 3.38 | 56 | 0.00% | -14.86% |
| ABOS | Acumen | | Biotechnology | 3.18 | 0 | -8.49% | -14.97% |
| IFRX | InflaRx N.V | | Biotechnology | 1.27 | 7 | 0.79% | -15.00% |
| AVTE | Aerovate | | Biotechnology | 21.43 | 36 | -4.03% | -15.10% |
| AIM | AIM ImmunoTech | | Pharmaceutical | 0.48 | 31 | 0.25% | -15.14% |
| ATHA | Athira Pharma | | Biotechnology | 2.07 | 0 | -2.13% | -15.16% |
| FATE | Fate | | Biotechnology | 5.04 | 20 | -4.36% | -15.29% |
| ANVS | Annovis Bio | | Biotechnology | 9.85 | 0 | 9.57% | -15.31% |
| PRQR | ProQR | | Biotechnology | 1.86 | 10 | -2.11% | -15.45% |
| ALEC | Alector | | Biotechnology | 5.09 | 0 | 0.39% | -15.45% |
| PRAX | Praxis Precision | | Biotechnology | 46.62 | 26 | -7.86% | -15.49% |
| For chart view version of above stock list: Chart View ➞ 0 - 25 , 25 - 50 , 50 - 75 , 75 - 100 , 100 - 125 , 125 - 150 , 150 - 175 , 175 - 200 , 200 - 225 , 225 - 250 , 250 - 275 , 275 - 300 , 300 - 325 , 325 - 350 , 350 - 375 , 375 - 400 , 400 - 425 , 425 - 450 , 450 - 475 , 475 - 500 , 500 - 525 , 525 - 550 , 550 - 575 , 575 - 600 , 600 - 625 , 625 - 650 , 650 - 675 , 675 - 700 , 700 - 725 | ||
 | Click To Change The Sort Order: By Market Cap or Company Size Performance: Year-to-date, Week and Day |  |
|
Get the most comprehensive stock market coverage daily at 12Stocks.com ➞ Best Stocks Today ➞ Best Stocks Weekly ➞ Best Stocks Year-to-Date ➞ Best Stocks Trends ➞  Best Stocks Today 12Stocks.com Best Nasdaq Stocks ➞ Best S&P 500 Stocks ➞ Best Tech Stocks ➞ Best Biotech Stocks ➞ |
| Detailed Overview of Healthcare Stocks |
| Healthcare Technical Overview, Leaders & Laggards, Top Healthcare ETF Funds & Detailed Healthcare Stocks List, Charts, Trends & More |
| Healthcare Sector: Technical Analysis, Trends & YTD Performance | |
| Healthcare sector is composed of stocks
from pharmaceutical, biotech, diagnostics labs, insurance providers
and healthcare services. Healthcare sector, as represented by XLV, an exchange-traded fund [ETF] that holds basket of Healthcare stocks (e.g, Merck, Amgen) is up by 1.5% and is currently underperforming the overall market by -2.69% year-to-date. Below is a quick view of Technical charts and trends: |
|
 XLV Weekly Chart |
|
| Long Term Trend: Not Good | |
| Medium Term Trend: Not Good | |
 XLV Daily Chart |
|
| Short Term Trend: Deteriorating | |
| Overall Trend Score: 18 | |
| YTD Performance: 1.5% | |
| **Trend Scores & Views Are Only For Educational Purposes And Not For Investing | |
| 12Stocks.com: Top Performing Healthcare Sector Stocks | ||||||||||||||||||||||||||||||||||||||||||||||||
 The top performing Healthcare sector stocks year to date are
Now, more recently, over last week, the top performing Healthcare sector stocks on the move are


|
||||||||||||||||||||||||||||||||||||||||||||||||
| 12Stocks.com: Investing in Healthcare Sector using Exchange Traded Funds | |
|
The following table shows list of key exchange traded funds (ETF) that
help investors track Healthcare Index. For detailed view, check out our ETF Funds section of our website. Quick View: Move mouse or cursor over ETF symbol (ticker) to view short-term Technical chart and over ETF name to view long term chart. Click on ticker or stock name for detailed view. Click on to add stock symbol to your watchlist and to view watchlist. |
12Stocks.com List of ETFs that track Healthcare Index
| Ticker | ETF Name | Watchlist | Recent Price | Smart Investing & Trading Score | Change % | Week % | Year-to-date % |
| XLV | Health Care | | 138.43 | 18 | -0.01 | -0.35 | 1.5% |
| XBI | Biotech | | 83.48 | 10 | -1.38 | -5.3 | -6.51% |
| IBB | Biotechnology | | 124.64 | 0 | -0.99 | -3.81 | -8.25% |
| BBH | Biotech | | 152.35 | 10 | -0.43 | -3.33 | -7.84% |
| VHT | Health Care | | 252.83 | 18 | -0.12 | -0.76 | 0.85% |
| IYH | Healthcare | | 58.05 | 10 | -0.02 | -0.6 | 1.4% |
| IHF | Healthcare Providers | | 51.55 | 32 | 0.93 | 1.99 | -1.84% |
| IHI | Medical Devices | | 54.53 | 5 | -0.46 | -2.8 | 1.04% |
| BIB | Biotechnology | | 47.94 | 0 | -2.02 | -6.71 | -15.97% |
| BIS | Short Biotech | | 20.87 | 100 | 1.69 | 6.46 | 15.47% |
| XHE | Health Care Equipment | | 81.44 | 20 | -0.74 | -2.93 | -3.35% |
| CURE | Healthcare Bull 3X | | 102.22 | 18 | -0.44 | -1.14 | 0.47% |
| LABU | Biotech Bull 3X | | 88.04 | 10 | -4.33 | -15.63 | -27.82% |
| LABD | Biotech Bear 3X | | 10.52 | 82 | 4.37 | 17.15 | 8.57% |
| PSCH | SmallCap Health Care | | 40.08 | 20 | -0.87 | -3.26 | -6.36% |
| XHS | Health Care Services | | 86.19 | 10 | -0.16 | -2.07 | -3.1% |
| PTH | DWA Healthcare Momentum | | 39.57 | 46 | -2.18 | -5.4 | 1.1% |
| BTEC | Principal Healthcare Innovators | | 34.09 | 0 | -1.51 | -5.29 | -6.17% |
| RXL | Health Care | | 92.44 | 10 | -0.61 | -0.88 | 1.13% |
| RXD | Short Health Care | | 11.67 | 76 | -0.05 | 0.64 | -2.11% |
| 12Stocks.com: Charts, Trends, Fundamental Data and Performances of Healthcare Stocks | |
|
We now take in-depth look at all Healthcare stocks including charts, multi-period performances and overall trends (as measured by Smart Investing & Trading Score). One can sort Healthcare stocks (click link to choose) by Daily, Weekly and by Year-to-Date performances. Also, one can sort by size of the company or by market capitalization. |
| Select Your Default Chart Type: | |||||
| |||||
| Click on stock symbol or name for detailed view. Click on to add stock symbol to your watchlist and to view watchlist. Quick View: Move mouse or cursor over "Daily" to quickly view daily Technical stock chart and over "Weekly" to view weekly Technical stock chart. | |||||

 | ARCT Arcturus Therapeutics Holdings Inc. |
| Sector: Health Care | |
| SubSector: Biotechnology | |
| MarketCap: 241.385 Millions | |
| Recent Price: 26.31 Smart Investing & Trading Score: 0 | |
| Day Percent Change: -4.81% Day Change: -1.33 | |
| Week Change: -13.54% Year-to-date Change: -16.6% | |
| ARCT Links: Profile News Message Board | |
| Charts:- Daily , Weekly | |
| Add ARCT to Watchlist: View: Get Complete ARCT Trend Analysis ➞ | |
 | PLRX Pliant Therapeutics, Inc. |
| Sector: Health Care | |
| SubSector: Biotechnology | |
| MarketCap: 96487 Millions | |
| Recent Price: 12.23 Smart Investing & Trading Score: 0 | |
| Day Percent Change: -4.90% Day Change: -0.63 | |
| Week Change: -13.57% Year-to-date Change: -32.5% | |
| PLRX Links: Profile News Message Board | |
| Charts:- Daily , Weekly | |
| Add PLRX to Watchlist: View: Get Complete PLRX Trend Analysis ➞ | |
 | RAPT RAPT Therapeutics, Inc. |
| Sector: Health Care | |
| SubSector: Biotechnology | |
| MarketCap: 368.785 Millions | |
| Recent Price: 7.93 Smart Investing & Trading Score: 10 | |
| Day Percent Change: -1.37% Day Change: -0.11 | |
| Week Change: -13.71% Year-to-date Change: -68.1% | |
| RAPT Links: Profile News Message Board | |
| Charts:- Daily , Weekly | |
| Add RAPT to Watchlist: View: Get Complete RAPT Trend Analysis ➞ | |
 | NRIX Nurix Therapeutics, Inc. |
| Sector: Health Care | |
| SubSector: Biotechnology | |
| MarketCap: 16787 Millions | |
| Recent Price: 14.43 Smart Investing & Trading Score: 43 | |
| Day Percent Change: 2.34% Day Change: 0.33 | |
| Week Change: -13.8% Year-to-date Change: 39.7% | |
| NRIX Links: Profile News Message Board | |
| Charts:- Daily , Weekly | |
| Add NRIX to Watchlist: View: Get Complete NRIX Trend Analysis ➞ | |
 | CASI CASI Pharmaceuticals, Inc. |
| Sector: Health Care | |
| SubSector: Biotechnology | |
| MarketCap: 210.085 Millions | |
| Recent Price: 2.24 Smart Investing & Trading Score: 17 | |
| Day Percent Change: 0.00% Day Change: 0.00 | |
| Week Change: -13.85% Year-to-date Change: -68.7% | |
| CASI Links: Profile News Message Board | |
| Charts:- Daily , Weekly | |
| Add CASI to Watchlist: View: Get Complete CASI Trend Analysis ➞ | |
 | BYSI BeyondSpring Inc. |
| Sector: Health Care | |
| SubSector: Biotechnology | |
| MarketCap: 432.785 Millions | |
| Recent Price: 1.80 Smart Investing & Trading Score: 51 | |
| Day Percent Change: -2.70% Day Change: -0.05 | |
| Week Change: -13.88% Year-to-date Change: 100.0% | |
| BYSI Links: Profile News Message Board | |
| Charts:- Daily , Weekly | |
| Add BYSI to Watchlist: View: Get Complete BYSI Trend Analysis ➞ | |
 | PRME Prime Medicine, Inc. |
| Sector: Health Care | |
| SubSector: Biotechnology | |
| MarketCap: 1440 Millions | |
| Recent Price: 4.93 Smart Investing & Trading Score: 55 | |
| Day Percent Change: -0.10% Day Change: 0.00 | |
| Week Change: -13.96% Year-to-date Change: -45.9% | |
| PRME Links: Profile News Message Board | |
| Charts:- Daily , Weekly | |
| Add PRME to Watchlist: View: Get Complete PRME Trend Analysis ➞ | |
 | FGEN FibroGen, Inc. |
| Sector: Health Care | |
| SubSector: Biotechnology | |
| MarketCap: 2502.95 Millions | |
| Recent Price: 1.17 Smart Investing & Trading Score: 20 | |
| Day Percent Change: -7.87% Day Change: -0.10 | |
| Week Change: -13.97% Year-to-date Change: 32.0% | |
| FGEN Links: Profile News Message Board | |
| Charts:- Daily , Weekly | |
| Add FGEN to Watchlist: View: Get Complete FGEN Trend Analysis ➞ | |
 | QTRX Quanterix Corporation |
| Sector: Health Care | |
| SubSector: Biotechnology | |
| MarketCap: 448.685 Millions | |
| Recent Price: 15.79 Smart Investing & Trading Score: 10 | |
| Day Percent Change: 0.25% Day Change: 0.04 | |
| Week Change: -14.04% Year-to-date Change: -42.3% | |
| QTRX Links: Profile News Message Board | |
| Charts:- Daily , Weekly | |
| Add QTRX to Watchlist: View: Get Complete QTRX Trend Analysis ➞ | |
 | EPIX ESSA Pharma Inc. |
| Sector: Health Care | |
| SubSector: Biotechnology | |
| MarketCap: 70.5785 Millions | |
| Recent Price: 6.67 Smart Investing & Trading Score: 0 | |
| Day Percent Change: -5.66% Day Change: -0.40 | |
| Week Change: -14.05% Year-to-date Change: 2.0% | |
| EPIX Links: Profile News Message Board | |
| Charts:- Daily , Weekly | |
| Add EPIX to Watchlist: View: Get Complete EPIX Trend Analysis ➞ | |
 | HROW Harrow Health, Inc. |
| Sector: Health Care | |
| SubSector: Drug Manufacturers - Other | |
| MarketCap: 104.033 Millions | |
| Recent Price: 10.84 Smart Investing & Trading Score: 36 | |
| Day Percent Change: -8.29% Day Change: -0.98 | |
| Week Change: -14.31% Year-to-date Change: -3.2% | |
| HROW Links: Profile News Message Board | |
| Charts:- Daily , Weekly | |
| Add HROW to Watchlist: View: Get Complete HROW Trend Analysis ➞ | |
 | XBIT XBiotech Inc. |
| Sector: Health Care | |
| SubSector: Biotechnology | |
| MarketCap: 420.385 Millions | |
| Recent Price: 7.91 Smart Investing & Trading Score: 36 | |
| Day Percent Change: -2.47% Day Change: -0.20 | |
| Week Change: -14.49% Year-to-date Change: 97.8% | |
| XBIT Links: Profile News Message Board | |
| Charts:- Daily , Weekly | |
| Add XBIT to Watchlist: View: Get Complete XBIT Trend Analysis ➞ | |
 | OMER Omeros Corporation |
| Sector: Health Care | |
| SubSector: Biotechnology | |
| MarketCap: 759.585 Millions | |
| Recent Price: 3.21 Smart Investing & Trading Score: 0 | |
| Day Percent Change: -3.89% Day Change: -0.13 | |
| Week Change: -14.63% Year-to-date Change: -1.8% | |
| OMER Links: Profile News Message Board | |
| Charts:- Daily , Weekly | |
| Add OMER to Watchlist: View: Get Complete OMER Trend Analysis ➞ | |
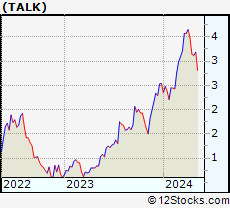 | TALK Talkspace, Inc. |
| Sector: Health Care | |
| SubSector: Health Information Services | |
| MarketCap: 209 Millions | |
| Recent Price: 2.97 Smart Investing & Trading Score: 33 | |
| Day Percent Change: 1.02% Day Change: 0.03 | |
| Week Change: -14.66% Year-to-date Change: 16.9% | |
| TALK Links: Profile News Message Board | |
| Charts:- Daily , Weekly | |
| Add TALK to Watchlist: View: Get Complete TALK Trend Analysis ➞ | |
 | GALT Galectin Therapeutics, Inc. |
| Sector: Health Care | |
| SubSector: Biotechnology | |
| MarketCap: 114.185 Millions | |
| Recent Price: 3.38 Smart Investing & Trading Score: 56 | |
| Day Percent Change: 0.00% Day Change: 0.00 | |
| Week Change: -14.86% Year-to-date Change: 103.6% | |
| GALT Links: Profile News Message Board | |
| Charts:- Daily , Weekly | |
| Add GALT to Watchlist: View: Get Complete GALT Trend Analysis ➞ | |
 | ABOS Acumen Pharmaceuticals, Inc. |
| Sector: Health Care | |
| SubSector: Biotechnology | |
| MarketCap: 199 Millions | |
| Recent Price: 3.18 Smart Investing & Trading Score: 0 | |
| Day Percent Change: -8.49% Day Change: -0.29 | |
| Week Change: -14.97% Year-to-date Change: -17.2% | |
| ABOS Links: Profile News Message Board | |
| Charts:- Daily , Weekly | |
| Add ABOS to Watchlist: View: Get Complete ABOS Trend Analysis ➞ | |
 | IFRX InflaRx N.V. |
| Sector: Health Care | |
| SubSector: Biotechnology | |
| MarketCap: 103.185 Millions | |
| Recent Price: 1.27 Smart Investing & Trading Score: 7 | |
| Day Percent Change: 0.79% Day Change: 0.01 | |
| Week Change: -15% Year-to-date Change: -21.8% | |
| IFRX Links: Profile News Message Board | |
| Charts:- Daily , Weekly | |
| Add IFRX to Watchlist: View: Get Complete IFRX Trend Analysis ➞ | |
 | AVTE Aerovate Therapeutics, Inc. |
| Sector: Health Care | |
| SubSector: Biotechnology | |
| MarketCap: 478 Millions | |
| Recent Price: 21.43 Smart Investing & Trading Score: 36 | |
| Day Percent Change: -4.03% Day Change: -0.90 | |
| Week Change: -15.1% Year-to-date Change: -5.1% | |
| AVTE Links: Profile News Message Board | |
| Charts:- Daily , Weekly | |
| Add AVTE to Watchlist: View: Get Complete AVTE Trend Analysis ➞ | |
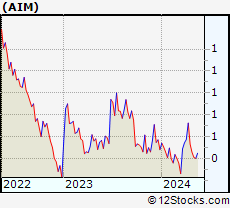 | AIM AIM ImmunoTech Inc. |
| Sector: Health Care | |
| SubSector: Drug Manufacturers - Other | |
| MarketCap: 61.4033 Millions | |
| Recent Price: 0.48 Smart Investing & Trading Score: 31 | |
| Day Percent Change: 0.25% Day Change: 0.00 | |
| Week Change: -15.14% Year-to-date Change: 8.4% | |
| AIM Links: Profile News Message Board | |
| Charts:- Daily , Weekly | |
| Add AIM to Watchlist: View: Get Complete AIM Trend Analysis ➞ | |
 | ATHA Athira Pharma, Inc. |
| Sector: Health Care | |
| SubSector: Biotechnology | |
| MarketCap: 92487 Millions | |
| Recent Price: 2.07 Smart Investing & Trading Score: 0 | |
| Day Percent Change: -2.13% Day Change: -0.05 | |
| Week Change: -15.16% Year-to-date Change: -15.2% | |
| ATHA Links: Profile News Message Board | |
| Charts:- Daily , Weekly | |
| Add ATHA to Watchlist: View: Get Complete ATHA Trend Analysis ➞ | |
 | FATE Fate Therapeutics, Inc. |
| Sector: Health Care | |
| SubSector: Biotechnology | |
| MarketCap: 2022.45 Millions | |
| Recent Price: 5.04 Smart Investing & Trading Score: 20 | |
| Day Percent Change: -4.36% Day Change: -0.23 | |
| Week Change: -15.29% Year-to-date Change: 34.8% | |
| FATE Links: Profile News Message Board | |
| Charts:- Daily , Weekly | |
| Add FATE to Watchlist: View: Get Complete FATE Trend Analysis ➞ | |
 | ANVS Annovis Bio, Inc. |
| Sector: Health Care | |
| SubSector: Biotechnology | |
| MarketCap: 41487 Millions | |
| Recent Price: 9.85 Smart Investing & Trading Score: 0 | |
| Day Percent Change: 9.57% Day Change: 0.86 | |
| Week Change: -15.31% Year-to-date Change: -47.3% | |
| ANVS Links: Profile News Message Board | |
| Charts:- Daily , Weekly | |
| Add ANVS to Watchlist: View: Get Complete ANVS Trend Analysis ➞ | |
 | PRQR ProQR Therapeutics N.V. |
| Sector: Health Care | |
| SubSector: Biotechnology | |
| MarketCap: 324.385 Millions | |
| Recent Price: 1.86 Smart Investing & Trading Score: 10 | |
| Day Percent Change: -2.11% Day Change: -0.04 | |
| Week Change: -15.45% Year-to-date Change: -6.1% | |
| PRQR Links: Profile News Message Board | |
| Charts:- Daily , Weekly | |
| Add PRQR to Watchlist: View: Get Complete PRQR Trend Analysis ➞ | |
 | ALEC Alector, Inc. |
| Sector: Health Care | |
| SubSector: Biotechnology | |
| MarketCap: 2719.35 Millions | |
| Recent Price: 5.09 Smart Investing & Trading Score: 0 | |
| Day Percent Change: 0.39% Day Change: 0.02 | |
| Week Change: -15.45% Year-to-date Change: -36.2% | |
| ALEC Links: Profile News Message Board | |
| Charts:- Daily , Weekly | |
| Add ALEC to Watchlist: View: Get Complete ALEC Trend Analysis ➞ | |
 | PRAX Praxis Precision Medicines, Inc. |
| Sector: Health Care | |
| SubSector: Biotechnology | |
| MarketCap: 16587 Millions | |
| Recent Price: 46.62 Smart Investing & Trading Score: 26 | |
| Day Percent Change: -7.86% Day Change: -3.98 | |
| Week Change: -15.49% Year-to-date Change: 107.7% | |
| PRAX Links: Profile News Message Board | |
| Charts:- Daily , Weekly | |
| Add PRAX to Watchlist: View: Get Complete PRAX Trend Analysis ➞ | |
| For tabular summary view of above stock list: Summary View ➞ 0 - 25 , 25 - 50 , 50 - 75 , 75 - 100 , 100 - 125 , 125 - 150 , 150 - 175 , 175 - 200 , 200 - 225 , 225 - 250 , 250 - 275 , 275 - 300 , 300 - 325 , 325 - 350 , 350 - 375 , 375 - 400 , 400 - 425 , 425 - 450 , 450 - 475 , 475 - 500 , 500 - 525 , 525 - 550 , 550 - 575 , 575 - 600 , 600 - 625 , 625 - 650 , 650 - 675 , 675 - 700 , 700 - 725 | ||
| Click To Change The Sort Order: By Market Cap or Company Size Performance: Year-to-date, Week and Day | |
| Select Chart Type: | ||
|
Best Stocks Today 12Stocks.com |
© 2024 12Stocks.com Terms & Conditions Privacy Contact Us
All Information Provided Only For Education And Not To Be Used For Investing or Trading. See Terms & Conditions


One More Thing ... Get Best Stocks Delivered Daily!
Never Ever Miss A Move With Our Top Ten Stocks Lists
Find Best Stocks In Any Market - Bull or Bear Market
Take A Peek At Our Top Ten Stocks Lists: Daily, Weekly, Year-to-Date & Top Trends
Find Best Stocks In Any Market - Bull or Bear Market
Take A Peek At Our Top Ten Stocks Lists: Daily, Weekly, Year-to-Date & Top Trends
Healthcare Stocks With Best Up Trends [0-bearish to 100-bullish]: Zhongchao [100], Cullinan Oncology[100], Oscar Health[100], ALX Oncology[100], Zura Bio[93], PROCEPT BioRobotics[93], NuCana [93], Reneo [93], Vanda [93], Lantheus [93], Aurora Cannabis[88]
Best Healthcare Stocks Year-to-Date:
Precision BioSciences[2836.99%], Inovio [1900%], Assembly Biosciences[1525.41%], Adverum Biotechnologies[1381.14%], Aurora Cannabis[1272.32%], NuCana [1269.17%], Zhongchao [825.77%], Affimed N.V[711.2%], Corbus [504.8%], Agenus [500.31%], CareMax [417.53%] Best Healthcare Stocks This Week:
NuCana [1708.84%], Zhongchao [106.1%], Regencell Bioscience[37.01%], 23andMe Holding[33.3%], ProKidney [32%], ALX Oncology[20.64%], Vanda [20.63%], Galera [16.43%], Venus Concept[15.35%], Cullinan Oncology[13.89%], Rani [13.15%] Best Healthcare Stocks Daily:
Zhongchao [146.72%], 23andMe Holding[65.91%], Veru [22.41%], Canopy Growth[20.65%], Zura Bio[17.20%], Aurora Cannabis[12.87%], Bicycle [12.33%], Regencell Bioscience[10.20%], Vaxxinity [10.05%], DURECT [9.77%], Annovis Bio[9.57%]