
 Login Sign Up


| |||||
 |  | ||||

| 12Stocks.com Market Intelligence |
Best Healthcare Stocks
 | "Discover best trending healthcare stocks with 12Stocks.com." |
| - Subu Vdaygiri, Founder, 12Stocks.com |
| In a hurry? Healthcare Stocks Lists: Performance Trends Table, Stock Charts
Sort Healthcare stocks: Daily, Weekly, Year-to-Date, Market Cap & Trends. Filter Healthcare stocks list by size:All Healthcare Large Mid-Range Small |
| 12Stocks.com Healthcare Stocks Performances & Trends Daily | |||||||||
|
|  The overall Smart Investing & Trading Score is 38 (0-bearish to 100-bullish) which puts Healthcare sector in short term bearish to neutral trend. The Smart Investing & Trading Score from previous trading session is 52 and hence a deterioration of trend.
| ||||||||
Here are the Smart Investing & Trading Scores of the most requested Healthcare stocks at 12Stocks.com (click stock name for detailed review):
|


| 12Stocks.com: Investing in Healthcare sector with Stocks | |
|
The following table helps investors and traders sort through current performance and trends (as measured by Smart Investing & Trading Score) of various
stocks in the Healthcare sector. Quick View: Move mouse or cursor over stock symbol (ticker) to view short-term Technical chart and over stock name to view long term chart. Click on  to add stock symbol to your watchlist and to add stock symbol to your watchlist and  to view watchlist. Click on any ticker or stock name for detailed market intelligence report for that stock. to view watchlist. Click on any ticker or stock name for detailed market intelligence report for that stock. |
12Stocks.com Performance of Stocks in Healthcare Sector
| Ticker | Stock Name | Watchlist | Category | Recent Price | Smart Investing & Trading Score | Change % | Weekly Change% |
| USNA | USANA Health |   | Pharmaceutical | 43.14 | 17 | -1.28% | -2.24% |
| INMD | InMode | | Equipment | 17.03 | 10 | -1.90% | -2.24% |
| DCGO | DocGo | | Medical Care Facilities | 3.49 | 32 | 0.00% | -2.24% |
| JAZZ | Jazz | | Biotechnology | 107.43 | 10 | -0.82% | -2.28% |
| HLVX | HilleVax | | Biotechnology | 12.02 | 25 | -5.54% | -2.28% |
| ASND | Ascendis Pharma | | Biotechnology | 136.93 | 56 | -4.37% | -2.31% |
| TNYA | Tenaya | | Biotechnology | 4.22 | 56 | -4.09% | -2.31% |
| CLLS | Cellectis S.A | | Biotechnology | 2.49 | 15 | -0.40% | -2.35% |
| STTK | Shattuck Labs | | Biotechnology | 9.56 | 81 | -3.14% | -2.35% |
| ATEC | Alphatec | | Instruments | 12.24 | 35 | -3.92% | -2.39% |
| CRSP | CRISPR | | Biotechnology | 53.73 | 25 | -3.45% | -2.40% |
| AUPH | Aurinia | | Biotechnology | 4.87 | 25 | -3.18% | -2.40% |
| PCVX | Vaxcyte | | Biotechnology | 59.25 | 18 | -1.66% | -2.40% |
| HYPR | Hyperfine | | Medical Devices | 0.81 | 17 | 0.50% | -2.41% |
| CLPT | ClearPoint Neuro | | Equipment | 5.22 | 10 | -2.06% | -2.43% |
| ANNX | Annexon | | Biotechnology | 4.58 | 43 | 3.15% | -2.45% |
| ATRC | AtriCure | | Instruments | 22.61 | 28 | -1.91% | -2.54% |
| LTRN | Lantern Pharma | | Biotechnology | 5.38 | 36 | -1.10% | -2.54% |
| PBYI | Puma Biotechnology | | Biotechnology | 4.88 | 26 | 1.04% | -2.59% |
| OBIO | Orchestra BioMed | | Biotechnology | 4.52 | 17 | 0.67% | -2.59% |
| ARDX | Ardelyx | | Biotechnology | 6.31 | 18 | -1.87% | -2.62% |
| VOR | Vor Biopharma | | Biotechnology | 1.67 | 30 | -4.58% | -2.63% |
| WVE | Wave Life | | Biotechnology | 4.74 | 51 | -5.39% | -2.67% |
| QURE | uniQure N.V | | Biotechnology | 4.54 | 20 | -0.44% | -2.78% |
| ACCD | Accolade | | Health Information | 9.10 | 17 | -3.19% | -2.78% |
| For chart view version of above stock list: Chart View ➞ 0 - 25 , 25 - 50 , 50 - 75 , 75 - 100 , 100 - 125 , 125 - 150 , 150 - 175 , 175 - 200 , 200 - 225 , 225 - 250 , 250 - 275 , 275 - 300 , 300 - 325 , 325 - 350 , 350 - 375 , 375 - 400 , 400 - 425 , 425 - 450 , 450 - 475 , 475 - 500 , 500 - 525 , 525 - 550 , 550 - 575 , 575 - 600 , 600 - 625 , 625 - 650 , 650 - 675 , 675 - 700 , 700 - 725 | ||
 | Click To Change The Sort Order: By Market Cap or Company Size Performance: Year-to-date, Week and Day |  |
|
Get the most comprehensive stock market coverage daily at 12Stocks.com ➞ Best Stocks Today ➞ Best Stocks Weekly ➞ Best Stocks Year-to-Date ➞ Best Stocks Trends ➞  Best Stocks Today 12Stocks.com Best Nasdaq Stocks ➞ Best S&P 500 Stocks ➞ Best Tech Stocks ➞ Best Biotech Stocks ➞ |
| Detailed Overview of Healthcare Stocks |
| Healthcare Technical Overview, Leaders & Laggards, Top Healthcare ETF Funds & Detailed Healthcare Stocks List, Charts, Trends & More |
| Healthcare Sector: Technical Analysis, Trends & YTD Performance | |
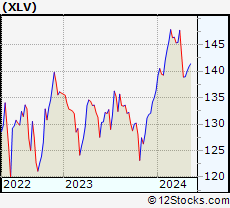
| Healthcare sector is composed of stocks
from pharmaceutical, biotech, diagnostics labs, insurance providers
and healthcare services. Healthcare sector, as represented by XLV, an exchange-traded fund [ETF] that holds basket of Healthcare stocks (e.g, Merck, Amgen) is up by 2.6% and is currently underperforming the overall market by -2.56% year-to-date. Below is a quick view of Technical charts and trends: |
|
 XLV Weekly Chart |
|
| Long Term Trend: Not Good | |
| Medium Term Trend: Not Good | |
 XLV Daily Chart |
|
| Short Term Trend: Very Good | |
| Overall Trend Score: 38 | |
| YTD Performance: 2.6% | |
| **Trend Scores & Views Are Only For Educational Purposes And Not For Investing | |
| 12Stocks.com: Top Performing Healthcare Sector Stocks | ||||||||||||||||||||||||||||||||||||||||||||||||
 The top performing Healthcare sector stocks year to date are
Now, more recently, over last week, the top performing Healthcare sector stocks on the move are


|
||||||||||||||||||||||||||||||||||||||||||||||||
| 12Stocks.com: Investing in Healthcare Sector using Exchange Traded Funds | |
|
The following table shows list of key exchange traded funds (ETF) that
help investors track Healthcare Index. For detailed view, check out our ETF Funds section of our website. Quick View: Move mouse or cursor over ETF symbol (ticker) to view short-term Technical chart and over ETF name to view long term chart. Click on ticker or stock name for detailed view. Click on to add stock symbol to your watchlist and to view watchlist. |
12Stocks.com List of ETFs that track Healthcare Index
| Ticker | ETF Name | Watchlist | Recent Price | Smart Investing & Trading Score | Change % | Week % | Year-to-date % |
| XLV | Health Care | | 139.92 | 38 | -0.67 | 0.7 | 2.6% |
| XBI | Biotech | | 82.22 | 25 | -2.05 | -0.74 | -7.92% |
| IBB | Biotechnology | | 125.67 | 18 | -1.64 | 0.76 | -7.49% |
| BBH | Biotech | | 154.61 | 49 | -1.73 | 1.48 | -6.47% |
| VHT | Health Care | | 255.24 | 45 | -0.79 | 0.75 | 1.81% |
| IYH | Healthcare | | 58.68 | 45 | -0.69 | 0.89 | 2.5% |
| IHF | Healthcare Providers | | 52.11 | 55 | -0.29 | -0.19 | -0.76% |
| IHI | Medical Devices | | 55.27 | 43 | -0.66 | 1.67 | 2.41% |
| BIB | Biotechnology | | 48.83 | 32 | -2.69 | 1.31 | -14.41% |
| BIS | Short Biotech | | 20.59 | 61 | 2.49 | -1.46 | 13.95% |
| XHE | Health Care Equipment | | 81.77 | 28 | -1.73 | 0.62 | -2.96% |
| CURE | Healthcare Bull 3X | | 105.32 | 25 | -2.35 | 1.92 | 3.52% |
| LABU | Biotech Bull 3X | | 83.72 | 25 | -6.35 | -2.71 | -31.36% |
| LABD | Biotech Bear 3X | | 11.03 | 75 | 6.36 | 2.13 | 13.83% |
| PSCH | SmallCap Health Care | | 40.31 | 35 | -1.98 | 0.32 | -5.82% |
| XHS | Health Care Services | | 87.68 | 68 | -1.15 | 0.68 | -1.43% |
| PTH | DWA Healthcare Momentum | | 39.60 | 46 | -0.08 | 0.18 | 1.18% |
| BTEC | Principal Healthcare Innovators | | 34.21 | 32 | 0.02 | 1.04 | -5.83% |
| RXL | Health Care | | 94.52 | 17 | -1.55 | 1.39 | 3.41% |
| RXD | Short Health Care | | 11.46 | 71 | 0.98 | -1.59 | -3.94% |
| 12Stocks.com: Charts, Trends, Fundamental Data and Performances of Healthcare Stocks | |
|
We now take in-depth look at all Healthcare stocks including charts, multi-period performances and overall trends (as measured by Smart Investing & Trading Score). One can sort Healthcare stocks (click link to choose) by Daily, Weekly and by Year-to-Date performances. Also, one can sort by size of the company or by market capitalization. |
| Select Your Default Chart Type: | |||||
| |||||
| Click on stock symbol or name for detailed view. Click on to add stock symbol to your watchlist and to view watchlist. Quick View: Move mouse or cursor over "Daily" to quickly view daily Technical stock chart and over "Weekly" to view weekly Technical stock chart. | |||||

 | USNA USANA Health Sciences, Inc. |
| Sector: Health Care | |
| SubSector: Drug Related Products | |
| MarketCap: 1185.13 Millions | |
| Recent Price: 43.14 Smart Investing & Trading Score: 17 | |
| Day Percent Change: -1.28% Day Change: -0.56 | |
| Week Change: -2.24% Year-to-date Change: -19.5% | |
| USNA Links: Profile News Message Board | |
| Charts:- Daily , Weekly | |
| Add USNA to Watchlist: View: Get Complete USNA Trend Analysis ➞ | |
 | INMD InMode Ltd. |
| Sector: Health Care | |
| SubSector: Medical Appliances & Equipment | |
| MarketCap: 689.08 Millions | |
| Recent Price: 17.03 Smart Investing & Trading Score: 10 | |
| Day Percent Change: -1.90% Day Change: -0.33 | |
| Week Change: -2.24% Year-to-date Change: -23.4% | |
| INMD Links: Profile News Message Board | |
| Charts:- Daily , Weekly | |
| Add INMD to Watchlist: View: Get Complete INMD Trend Analysis ➞ | |
 | DCGO DocGo Inc. |
| Sector: Health Care | |
| SubSector: Medical Care Facilities | |
| MarketCap: 972 Millions | |
| Recent Price: 3.49 Smart Investing & Trading Score: 32 | |
| Day Percent Change: 0.00% Day Change: 0.00 | |
| Week Change: -2.24% Year-to-date Change: -37.6% | |
| DCGO Links: Profile News Message Board | |
| Charts:- Daily , Weekly | |
| Add DCGO to Watchlist: View: Get Complete DCGO Trend Analysis ➞ | |
 | JAZZ Jazz Pharmaceuticals plc |
| Sector: Health Care | |
| SubSector: Biotechnology | |
| MarketCap: 5576.05 Millions | |
| Recent Price: 107.43 Smart Investing & Trading Score: 10 | |
| Day Percent Change: -0.82% Day Change: -0.89 | |
| Week Change: -2.28% Year-to-date Change: -12.7% | |
| JAZZ Links: Profile News Message Board | |
| Charts:- Daily , Weekly | |
| Add JAZZ to Watchlist: View: Get Complete JAZZ Trend Analysis ➞ | |
 | HLVX HilleVax, Inc. |
| Sector: Health Care | |
| SubSector: Biotechnology | |
| MarketCap: 680 Millions | |
| Recent Price: 12.02 Smart Investing & Trading Score: 25 | |
| Day Percent Change: -5.54% Day Change: -0.71 | |
| Week Change: -2.28% Year-to-date Change: -27.0% | |
| HLVX Links: Profile News Message Board | |
| Charts:- Daily , Weekly | |
| Add HLVX to Watchlist: View: Get Complete HLVX Trend Analysis ➞ | |
 | ASND Ascendis Pharma A/S |
| Sector: Health Care | |
| SubSector: Biotechnology | |
| MarketCap: 5470.35 Millions | |
| Recent Price: 136.93 Smart Investing & Trading Score: 56 | |
| Day Percent Change: -4.37% Day Change: -6.25 | |
| Week Change: -2.31% Year-to-date Change: 8.7% | |
| ASND Links: Profile News Message Board | |
| Charts:- Daily , Weekly | |
| Add ASND to Watchlist: View: Get Complete ASND Trend Analysis ➞ | |
 | TNYA Tenaya Therapeutics, Inc. |
| Sector: Health Care | |
| SubSector: Biotechnology | |
| MarketCap: 395 Millions | |
| Recent Price: 4.22 Smart Investing & Trading Score: 56 | |
| Day Percent Change: -4.09% Day Change: -0.18 | |
| Week Change: -2.31% Year-to-date Change: 32.7% | |
| TNYA Links: Profile News Message Board | |
| Charts:- Daily , Weekly | |
| Add TNYA to Watchlist: View: Get Complete TNYA Trend Analysis ➞ | |
 | CLLS Cellectis S.A. |
| Sector: Health Care | |
| SubSector: Biotechnology | |
| MarketCap: 398.685 Millions | |
| Recent Price: 2.49 Smart Investing & Trading Score: 15 | |
| Day Percent Change: -0.40% Day Change: -0.01 | |
| Week Change: -2.35% Year-to-date Change: -19.2% | |
| CLLS Links: Profile News Message Board | |
| Charts:- Daily , Weekly | |
| Add CLLS to Watchlist: View: Get Complete CLLS Trend Analysis ➞ | |
 | STTK Shattuck Labs, Inc. |
| Sector: Health Care | |
| SubSector: Biotechnology | |
| MarketCap: 16987 Millions | |
| Recent Price: 9.56 Smart Investing & Trading Score: 81 | |
| Day Percent Change: -3.14% Day Change: -0.31 | |
| Week Change: -2.35% Year-to-date Change: 34.7% | |
| STTK Links: Profile News Message Board | |
| Charts:- Daily , Weekly | |
| Add STTK to Watchlist: View: Get Complete STTK Trend Analysis ➞ | |
 | ATEC Alphatec Holdings, Inc. |
| Sector: Health Care | |
| SubSector: Medical Instruments & Supplies | |
| MarketCap: 181.16 Millions | |
| Recent Price: 12.24 Smart Investing & Trading Score: 35 | |
| Day Percent Change: -3.92% Day Change: -0.50 | |
| Week Change: -2.39% Year-to-date Change: -19.0% | |
| ATEC Links: Profile News Message Board | |
| Charts:- Daily , Weekly | |
| Add ATEC to Watchlist: View: Get Complete ATEC Trend Analysis ➞ | |
 | CRSP CRISPR Therapeutics AG |
| Sector: Health Care | |
| SubSector: Biotechnology | |
| MarketCap: 2691.35 Millions | |
| Recent Price: 53.73 Smart Investing & Trading Score: 25 | |
| Day Percent Change: -3.45% Day Change: -1.92 | |
| Week Change: -2.4% Year-to-date Change: -14.2% | |
| CRSP Links: Profile News Message Board | |
| Charts:- Daily , Weekly | |
| Add CRSP to Watchlist: View: Get Complete CRSP Trend Analysis ➞ | |
 | AUPH Aurinia Pharmaceuticals Inc. |
| Sector: Health Care | |
| SubSector: Biotechnology | |
| MarketCap: 1319.75 Millions | |
| Recent Price: 4.87 Smart Investing & Trading Score: 25 | |
| Day Percent Change: -3.18% Day Change: -0.16 | |
| Week Change: -2.4% Year-to-date Change: -45.8% | |
| AUPH Links: Profile News Message Board | |
| Charts:- Daily , Weekly | |
| Add AUPH to Watchlist: View: Get Complete AUPH Trend Analysis ➞ | |
 | PCVX Vaxcyte, Inc. |
| Sector: Health Care | |
| SubSector: Biotechnology | |
| MarketCap: 13887 Millions | |
| Recent Price: 59.25 Smart Investing & Trading Score: 18 | |
| Day Percent Change: -1.66% Day Change: -1.00 | |
| Week Change: -2.4% Year-to-date Change: -5.6% | |
| PCVX Links: Profile News Message Board | |
| Charts:- Daily , Weekly | |
| Add PCVX to Watchlist: View: Get Complete PCVX Trend Analysis ➞ | |
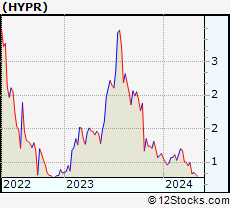 | HYPR Hyperfine, Inc. |
| Sector: Health Care | |
| SubSector: Medical Devices | |
| MarketCap: 154 Millions | |
| Recent Price: 0.81 Smart Investing & Trading Score: 17 | |
| Day Percent Change: 0.50% Day Change: 0.00 | |
| Week Change: -2.41% Year-to-date Change: -28.3% | |
| HYPR Links: Profile News Message Board | |
| Charts:- Daily , Weekly | |
| Add HYPR to Watchlist: View: Get Complete HYPR Trend Analysis ➞ | |
 | CLPT ClearPoint Neuro, Inc. |
| Sector: Health Care | |
| SubSector: Medical Appliances & Equipment | |
| MarketCap: 55.108 Millions | |
| Recent Price: 5.22 Smart Investing & Trading Score: 10 | |
| Day Percent Change: -2.06% Day Change: -0.11 | |
| Week Change: -2.43% Year-to-date Change: -23.4% | |
| CLPT Links: Profile News Message Board | |
| Charts:- Daily , Weekly | |
| Add CLPT to Watchlist: View: Get Complete CLPT Trend Analysis ➞ | |
 | ANNX Annexon, Inc. |
| Sector: Health Care | |
| SubSector: Biotechnology | |
| MarketCap: 94487 Millions | |
| Recent Price: 4.58 Smart Investing & Trading Score: 43 | |
| Day Percent Change: 3.15% Day Change: 0.14 | |
| Week Change: -2.45% Year-to-date Change: 0.4% | |
| ANNX Links: Profile News Message Board | |
| Charts:- Daily , Weekly | |
| Add ANNX to Watchlist: View: Get Complete ANNX Trend Analysis ➞ | |
 | ATRC AtriCure, Inc. |
| Sector: Health Care | |
| SubSector: Medical Instruments & Supplies | |
| MarketCap: 1158.7 Millions | |
| Recent Price: 22.61 Smart Investing & Trading Score: 28 | |
| Day Percent Change: -1.91% Day Change: -0.44 | |
| Week Change: -2.54% Year-to-date Change: -36.7% | |
| ATRC Links: Profile News Message Board | |
| Charts:- Daily , Weekly | |
| Add ATRC to Watchlist: View: Get Complete ATRC Trend Analysis ➞ | |
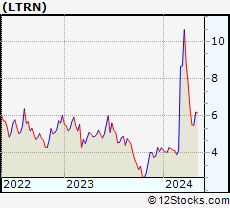 | LTRN Lantern Pharma Inc. |
| Sector: Health Care | |
| SubSector: Biotechnology | |
| MarketCap: 11487 Millions | |
| Recent Price: 5.38 Smart Investing & Trading Score: 36 | |
| Day Percent Change: -1.10% Day Change: -0.06 | |
| Week Change: -2.54% Year-to-date Change: 25.4% | |
| LTRN Links: Profile News Message Board | |
| Charts:- Daily , Weekly | |
| Add LTRN to Watchlist: View: Get Complete LTRN Trend Analysis ➞ | |
 | PBYI Puma Biotechnology, Inc. |
| Sector: Health Care | |
| SubSector: Biotechnology | |
| MarketCap: 385.585 Millions | |
| Recent Price: 4.88 Smart Investing & Trading Score: 26 | |
| Day Percent Change: 1.04% Day Change: 0.05 | |
| Week Change: -2.59% Year-to-date Change: 12.7% | |
| PBYI Links: Profile News Message Board | |
| Charts:- Daily , Weekly | |
| Add PBYI to Watchlist: View: Get Complete PBYI Trend Analysis ➞ | |
 | OBIO Orchestra BioMed Holdings, Inc. |
| Sector: Health Care | |
| SubSector: Biotechnology | |
| MarketCap: 271 Millions | |
| Recent Price: 4.52 Smart Investing & Trading Score: 17 | |
| Day Percent Change: 0.67% Day Change: 0.03 | |
| Week Change: -2.59% Year-to-date Change: -50.4% | |
| OBIO Links: Profile News Message Board | |
| Charts:- Daily , Weekly | |
| Add OBIO to Watchlist: View: Get Complete OBIO Trend Analysis ➞ | |
 | ARDX Ardelyx, Inc. |
| Sector: Health Care | |
| SubSector: Biotechnology | |
| MarketCap: 541.985 Millions | |
| Recent Price: 6.31 Smart Investing & Trading Score: 18 | |
| Day Percent Change: -1.87% Day Change: -0.12 | |
| Week Change: -2.62% Year-to-date Change: 1.8% | |
| ARDX Links: Profile News Message Board | |
| Charts:- Daily , Weekly | |
| Add ARDX to Watchlist: View: Get Complete ARDX Trend Analysis ➞ | |
 | VOR Vor Biopharma Inc. |
| Sector: Health Care | |
| SubSector: Biotechnology | |
| MarketCap: 224 Millions | |
| Recent Price: 1.67 Smart Investing & Trading Score: 30 | |
| Day Percent Change: -4.58% Day Change: -0.08 | |
| Week Change: -2.63% Year-to-date Change: -25.0% | |
| VOR Links: Profile News Message Board | |
| Charts:- Daily , Weekly | |
| Add VOR to Watchlist: View: Get Complete VOR Trend Analysis ➞ | |
 | WVE Wave Life Sciences Ltd. |
| Sector: Health Care | |
| SubSector: Biotechnology | |
| MarketCap: 452.785 Millions | |
| Recent Price: 4.74 Smart Investing & Trading Score: 51 | |
| Day Percent Change: -5.39% Day Change: -0.27 | |
| Week Change: -2.67% Year-to-date Change: -6.1% | |
| WVE Links: Profile News Message Board | |
| Charts:- Daily , Weekly | |
| Add WVE to Watchlist: View: Get Complete WVE Trend Analysis ➞ | |
 | QURE uniQure N.V. |
| Sector: Health Care | |
| SubSector: Biotechnology | |
| MarketCap: 2267.25 Millions | |
| Recent Price: 4.54 Smart Investing & Trading Score: 20 | |
| Day Percent Change: -0.44% Day Change: -0.02 | |
| Week Change: -2.78% Year-to-date Change: -32.9% | |
| QURE Links: Profile News Message Board | |
| Charts:- Daily , Weekly | |
| Add QURE to Watchlist: View: Get Complete QURE Trend Analysis ➞ | |
 | ACCD Accolade, Inc. |
| Sector: Health Care | |
| SubSector: Health Information Services | |
| MarketCap: 32987 Millions | |
| Recent Price: 9.10 Smart Investing & Trading Score: 17 | |
| Day Percent Change: -3.19% Day Change: -0.30 | |
| Week Change: -2.78% Year-to-date Change: -24.3% | |
| ACCD Links: Profile News Message Board | |
| Charts:- Daily , Weekly | |
| Add ACCD to Watchlist: View: Get Complete ACCD Trend Analysis ➞ | |
| For tabular summary view of above stock list: Summary View ➞ 0 - 25 , 25 - 50 , 50 - 75 , 75 - 100 , 100 - 125 , 125 - 150 , 150 - 175 , 175 - 200 , 200 - 225 , 225 - 250 , 250 - 275 , 275 - 300 , 300 - 325 , 325 - 350 , 350 - 375 , 375 - 400 , 400 - 425 , 425 - 450 , 450 - 475 , 475 - 500 , 500 - 525 , 525 - 550 , 550 - 575 , 575 - 600 , 600 - 625 , 625 - 650 , 650 - 675 , 675 - 700 , 700 - 725 | ||
| Click To Change The Sort Order: By Market Cap or Company Size Performance: Year-to-date, Week and Day | |
| Select Chart Type: | ||
|
Best Stocks Today 12Stocks.com |
© 2024 12Stocks.com Terms & Conditions Privacy Contact Us
All Information Provided Only For Education And Not To Be Used For Investing or Trading. See Terms & Conditions


One More Thing ... Get Best Stocks Delivered Daily!
Never Ever Miss A Move With Our Top Ten Stocks Lists
Find Best Stocks In Any Market - Bull or Bear Market
Take A Peek At Our Top Ten Stocks Lists: Daily, Weekly, Year-to-Date & Top Trends
Find Best Stocks In Any Market - Bull or Bear Market
Take A Peek At Our Top Ten Stocks Lists: Daily, Weekly, Year-to-Date & Top Trends
Healthcare Stocks With Best Up Trends [0-bearish to 100-bullish]: AstraZeneca [100], Merck [100], Annovis Bio[100], Haemonetics [100], Tandem Diabetes[100], Boston Scientific[100], Agios [100], Agenus [95], Mesoblast [95], Cullinan Oncology[93], Avadel [93]
Best Healthcare Stocks Year-to-Date:
Pieris [6273.63%], Precision BioSciences[2590.41%], Inovio [1885.29%], Assembly Biosciences[1529.07%], Aurora Cannabis[1311.17%], NuCana [1198.17%], Adverum Biotechnologies[1147.34%], Agenus [902.54%], Affimed N.V[680.8%], CareMax [490.72%], Mesoblast [459.09%] Best Healthcare Stocks This Week:
Pieris [7900%], Agenus [56.31%], VolitionRx [44.5%], ProKidney [32.84%], Seres [32.65%], Annovis Bio[30%], BeyondSpring [26.11%], Cullinan Oncology[22.92%], Pharvaris N.V[18.84%], OptiNose [18.42%], GeneDx [18.15%] Best Healthcare Stocks Daily:
OptiNose [14.56%], Galera [13.74%], Agenus [11.86%], VolitionRx [11.26%], ADiTx [10.57%], Apollomics [9.94%], Pharming [9.06%], Structure [8.13%], Pharvaris N.V[7.91%], ProKidney [7.75%], Community Health[7.26%]